PRODUCTION OF CALCIUM MONOHYDROGENPHOSPHATE
FROM SEBAIYA PHOSPHATE ORE LEACHED BY NITRIC
ACID
Adel A. El-Zahhar,
[a]Mohsen M. Aly,
[a], Ahmed M. Ahmad,
[a], Magdy I.
Khalifa,
[b], Ahmed A. El-Asmy
[b]*Keywords: Sebaiya phosphate ore, calcium monohydrogenphosphate production, nitric acid leaching
The production of phosphoric acid and/or calcium monohydrogenphosphate from Sebaiya phosphate ore was investigated by leaching with nitric acid. Various factors affecting the process such as particle size, leaching time, leaching temperature, phosphate rock/HNO3 ratio and
mixing stirring speed and temperature have been studied to estimate the favor phosphate ore dissolution in relation to impurity. These parameters were fixed at a leaching time of 16 min, stirring speed of 400 rpm, temperature of 25 oC, nitric acid concentration of 2.5 % and acid/phosphate ore mass ratio of 25 ml/5 g. The produced aqueous acidic solution was neutralized in such a way that a pure calcium monohydrogenphosphate, CaHPO4, is precipitated to be used as animal fodder. The production efficiency was 97.2 %.
Corresponding Authors
E-Mail: [email protected]
[a] Nuclear Chemistry Department, Hot Labs Center, AEA, Cairo, Egypt
[b] Chemistry Department, Faculty of Science, Mansoura University, Mansura, Egypt
Introduction
Phosphoric acid (H3PO4) is the secondary most important
inorganic acid after sulfuric acid produced over the world. It is primarily used for the manufacture of phosphate salts, which are used in fertilizers, animals fodder production and detergents.
The composition of phosphate ores varies from one deposit to another. Therefore, phosphate rocks from different sources are expected to behave differently in acidification processes. Phosphate ores are of two major geological origins, igneous and sedimentary. The phosphate minerals in both types of ore are of the apatite group, of which the most commonly encountered variants are;
fluorapatite, Ca10(PO4)6(F,OH)2 and francolite,
Ca10(PO4)6(CO3)x(F,OH)2-x), where fluorapatite
predomina-tes in igneous phosphate rocks and francolite predominapredomina-tes in sedimentary phosphate rocks.1
Phosphate ores occur in Egypt in three main provinces, Western desert, Nile valley, and Red sea. Added to these are some phosphate- bearing sediments present in Wadi Qena, Wadi Araba, Esh El-Mallana range and Sinai.2,3
Phosphoric acid can be prepared by two methods, thermal and wet processes. The acid produced by thermal method is extremely pure; however, it is also expensive. The wet process which is based on the acidification of phosphate ores using any mineral acid is the more popular as a result of the increased demand for high-grade fertilizers, and the energy saving in the wet processes compared with thermal process.4
The wet process presents 90% of the world current phosphoric acid production. In this process, there are three possible subgroups depending on the mineral acid that is used for the acidification. This may be sulfuric acid,5,6
hydrochloric acid7,8ornitric acid.9-11
When phosphate rock is treated with nitric acid, phosphoric acid and soluble calcium nitrate are formed according to the following equation:
Ca10F2(PO4)6 + 20 HNO3 → 6H3PO4 + 10 Ca(NO3)2 + 2 HF
The process includes first acidulating of crushed phosphate rock in a reaction mixture vessel with excess nitric acid. The nitric acid concentration should be between 40 and 70%. The reaction temperature is at 120 - 130 °C and the reaction time ranges from 1 to 2.5 hrs. The product phosphoric acid contains from 55 - 72 % P2O5.12-15 Food
grade calcium phosphate has successfully produced from
phosphoric acid produced by Abu-Zaabal Fertilizers
and Chemicals Company by two steps. The first step includes clarification and defluorination of crude phosphoric acid. The second step includes the precipitation of food grade calcium phosphate by using different calcium salts as calcium oxide, calcium hydroxide and calcium carbonate.16
The production of calcium monohydrogenphosphate for use as animal fodders, by direct acidulation of phosphate rock with mineral acids has long been a goal of the fertilizer industry, since it use much less mineral acid consumption than by conventional other processes.17-20
The aim of the present work is to investigate different conditions as particle size, leaching time, leaching temperature, phosphate rock/HNO3 ratio and mixing speed
Eur. Chem. Bull., 2013, 2(10), 752-757 DOI: 10.17628/ECB.2013.2.752
753
Experimental
Materials
HNO3 (MERCK, Germany), H2SO4 (FLUKA,
Switzerland) and H3PO4 (BDH, England) were chemical
reagents grade. CaCO3 and Ca(OH)2 from El-Nasr
Pharmaceutical Chemicals (ADWIC, Egypt) were used as a source of calcium ions. A composite sample of Sebaiya phosphate ore was delivered from Abu-Zaabal Fertilizers. The chemical analysis of the phosphate rock is shown in Table 1.
Table 1. Chemical analysis of Sebaiya phosphate ore
Constituent %
P2O5 28.6
CaO 47.4
Fe2O3 2.3
F 2.9
SiO2 6.5
Constituent mg/kg
Cd 3.30
Pb 25.80
As 30.5
Apparatus
All reactions were carried out in a cylindrical 1 L reactor of 10 cm diameter. It was fitted with Teflon-coated stirrer and placed in thermostatically controlled water bath. The impeller tip speed was adjusted at 400 rpm unless otherwise stated. Filtration was performed using Buchner type filter of 4.6 in. diameter. Polypropylene filter cloth of 80 mesh aperture size was used. A vacuum pump was used for filtration.
Procedure
The phosphate ore sample was crushed with a jaw crusher and sieved using ASTM standard sieves to collect various size fractions for analysis. All the sieved samples were dried in an electric oven at 105 oC, cooled to room temperature and stored in a closed desiccator. These sample fractions were analyzed for P2O5 content as shown in Table 2.
For each run 5 g of phosphate sample was transferred with the proper determined amount of nitric acid solution into the reactor. Defoamer (oleic acid) is added when necessary. After the desired reaction time, the leach slurry was immediately separated by filtration. The remaining solids were dried and weighed. In the filtrate the P2O5 content was
determined by a colorimetric method (spectrophotometer type Shimadzu UV 1208, ammonium molybdate and ammonium metavanadate were used for P2O5 analysis).
CaHPO4 experiments were carried out by adding 4 g of
calcium carbonate to the proper amount of acidulate solution into the reactor. After the desired reaction time, the produced CHP was filtrated, dried and weighted. P2O5
content was determined in both CHP and the precipitation
raffinate solution by colorimetric method
(spectrophotometer type Shimadzu UV 1208, ammonium
molybdate and ammonium metavanadate were used for P2O5
analysis).
Table 2. Sieve analysis and P2O5 content of phosphate ore
fractions
Fraction No. Size,
µm
Weight, kg
Recovery, %
P2O5,
wt. %
1 1180 5.00 100.0 28.60
2 1180–1000 0.519 10.38 26.10
3 750– 710 0.731 14.62 28.40
4 600–500 0.741 14.82 29.59
5 420–315 1.000 20.00 29.76
6 315–250 0.764 15.28 30.06
7 250–160 1.215 24.30 30.40
The recovery (, in %) of P2O5 was calculated by the
following equation:
The precipitation efficiency ( was calculated by:
Results and Discussion
Nitric Acid Leaching Investigation
The results obtained when Sebaiya phosphate ore was subjected to leaching with nitric acid solution under the following parameters: particle size, reaction time, reaction temperature, nitric acid concentration, HNO3/phosphate ore
mass ratio and stirring speed.
Effect of particle size
The effect of particle size on the phosphate ore leaching process was studied using particle size fractions ≤ 1180, 750- 700, 600- 500, 420- 315, 315- 250, 250- 150 and 160- 63 µm. The results in Table 3 relating the P2O5 recovery %
and particle size clarify that, the phosphate ore fractionation has a slight effect on the P2O5 recovery %, where the
difference in P2O5 recovery % between the largest particle
size (≤ 1180 µm) and the smallest (160 – 63 µm) is less than 1 %.
Table 3. Effect of particle size on P2O5 recovery % from phosphate
ore at 16 min, 25 oC, 400 rpm, 1.0 M HCl and L/S 20 ml/ 5 g.
Fraction, µm P2O5 leaching %
≤ 1180 20.5
1180 - 1000 15.9
750 – 710 17.2
600 – 500 17.5
420 – 315 20.6
315 – 250 20.8
250 – 160 20.9
160 – 63 20.5
dissolved P O amount2 5 100
total P O amount in the rock2 5
2 5
2 5
amount of P O in produced DCP χ = 100 ×
Therefore, all investigations were carried out with particle size fractionation ≤ 1180 µm to cancel mid cost.
Effect of reaction time
To study the effect of leaching time on phosphate ore leaching by 10 % nitric acid, several experiments were carried at different times (1.0-60 min) at 25 oC; stirring speed of 400 rpm; L/S mass ratio of 25 ml/5 g and particle size ≤ 1180 µm. The results given in Figure 1 clearly show that, as the time increases from 1.0 to 15 min, the leaching % of P2O5 increases from 73.80 to 91.23 %
meaning that the reaction is fast. After 15 min, there is a slight increase in the reaction %. Therefore, 15 min is taken as optimum to maximize the phosphate ore leaching by nitric acid.
Figure 1. Effect of reaction time on P2O5 leaching % from
phosphate ore at room temperature, a stirring speed of 400 rpm, an acid concentration of 10 %, L/S mass ratio 25 ml/5 g and a particle size ≤1180 µm.
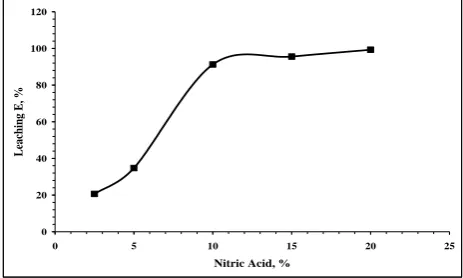
Effect of acid concentration
The effect of nitric acid concentration on the phosphate ore leaching process was studied at different concentrations (2.5 – 20 %) at 15 min, 400 rpm, 25 oC, particle size fraction of ≤ 1180 µm, and L/S of 25 ml/5 g. The experimental results (Fig. 2) clarify that, as the acid concentration increases from 2.5 to 10 %, the P2O5 recovery increases
from 20.63 to 91.23 %; further increase shows slight effect. This may be due to the increase of H+ concentration
increases the number of collisions with PO4-3 or the H+ ions
collisions with PO4-3, HPO4-2, H2PO4- in aqueous phase.
Therefore, 10 % nitric acid is preferred for the phosphate ore dissolution process.
Effect of reaction temperature
The effect of reaction temperature on the leaching process was investigated at 25 - 60 oC, 15 min, 400 rpm, acid
concentration 10%, particle size fraction ≤ 1180 µm, and L/S mass ratio 25 ml/5 g. The results given in Fig. 3 indicate that the reaction temperature has a slight effect on the reaction rate. Therefore, room temperature (25 oC) is
preferred for the leaching process.
Effect of stirring speed
The leaching process was performed using 10 % nitric acid with different stirring speed ranging from 200 to 600 rpm and reaction time of 15 min, L/S mass ratio of 25 ml/5g,
Figure 2. Effect of acid concentration on P2O5 leaching % from
phosphate ore at a room temperature, for time 15 min, a stirring speed of 400 rpm, L/S mass ratio 25 ml/ 5 g and a particle size ≤ 1180 µm.
Figure 3. Effect of reaction temperature on P2O5 leaching % from
phosphate ore for time 15 min, a stirring speed of 400 rpm, an acid concentration of 10 , L/S ratio 25 ml/ 5 g and a particle size ≤ 1180 µm.
temperature 25 °C and particle size fraction of ≤ 1180 µm to study the effect of mechanical stirring speed on the leaching process. The results in Fig. 4 reflect slight effect. Accordingly, all experiments were carried out at 400 rpm.
Figure 4. Effect of mixing stirring speed on P2O5 leaching % from
phosphate ore at L/S mass ratio 25 ml/ 5 g, a room temperature, for time 15 min, an acid concentration of 10%, and a particle size ≤ 1180 µm.
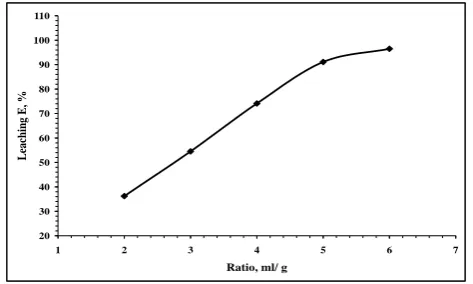
Effect of HNO3/phosphate rock mass ratio
The effect of nitric acid volume to phosphate ore mass ratio was studied within the range from 2 ml/1 g to 6 ml/1 g. Figure 5 shows that, as the liquid/solid ratio increases from 2/1 to 6/1, the recovery % of P2O5 increases from 36.21 to
96.50 % meaning that the decrease of bulk density (increase
60 65 70 75 80 85 90 95 100
0 10 20 30 40 50 60 70
Time, min
Leac
hin
g
E,
%
0 20 40 60 80 100 120
0 5 10 15 20 25
Nitric Acid, %
Leac
hin
g
E,
%
70 75 80 85 90 95 100
10 20 30 40 50 60 70
Temperature, oC
Leac
hin
g
E,
%
70 75 80 85 90 95 100
100 200 300 400 500 600 700
Stirring Speed, rpm
Leac
hin
g
E,
Eur. Chem. Bull., 2013, 2(10), 752-757 DOI: 10.17628/ECB.2013.2.752
755
volume/solid ratio) increases the P2O5 leaching %. The
volume/solid mass ratio of 6 ml/1 g is the optimum ratio.
Figure 5. Effect of HNO3: phosphate ore ratio on P2O5 leaching %
from Phosphate ore at mixing stirring speed of 400 rpm, a room temperature, for time 15 min, an acid concentration of 10 %, and a particle size ≤ 1180 µm.
Specification of leached H3PO4
From the aforementioned investigation on leaching
Sebaiya phosphate ore by HNO3, a leaching experiment was
carried out at phosphate ore particle size ≤ 1180 µm, leaching nitric acid concentration of 10 %, L/S mass ratio 6 ml/1 g, leaching reaction time 15 min, and mixing speed 400 rpm at room temperature. Accordingly, 600 ml of 10% HNO3 was added to 100 g of phosphate ore of particle size
fraction of ≤ 1180 µm and stirring for 15 min at room temperature. After filtration, the obtained acidulated solution was analyzed and the results obtained are given in Table 4.
Table 4. The chemical analysis of the produced acidulated phosphoric acid solution
Constituent Mass, g Constituent C, ppm
P2O5 27.55 Cd 0.65
Fe2O3 1.41 Pb 2.51
F 1.10 As 6.00
Precipitation of Calcium monohydrogenphosphate
Calcium carbonate was used as calcium source to precipitate calcium monohydrogenphosphate from the produced acidic solution according to the following equation:
CaCO3 + H3PO4 + H2O → CaHPO4.2H2O + CO2 ↑
The parameters affecting the calcium
monohydrogenphosphate precipitation efficiency such as mixing time, acidulated solution to calcium carbonate mass ratio, reaction temperature and reaction stirring speed were optimized.
Effect of mixing time
The precipitation of calcium monohydrogenphosphate from the produced acidic solution was studied at different mixing times (1-60 min). The obtained results are given in
Fig. 6 which clarify that as the mixing time increases (1-15 min), the precipitation efficiency increases from 5.6 to 68.1
Figure 6. Effect of mixing time on calcium monohydrogen phosphate
and further increase in mixing time has a slight effect on the precipitation efficiency. Therefore, 15 min is preferred for calcium monohydrogenphosphate precipitation process.
Effect of acidulate solution to calcium carbonate mass ratio
The effect of acidic solution/calcium carbonate mass ratio, L/S on calcium monohydrogenphosphate precipitation process was investigated within the range (50 ml/3.0 g-50 ml/6.0 g) at 15 min, stirring speed of 400 rpm, and at room temperature. The results in Fig. 6 indicate that, by increasing the acidic solution/calcium carbonate ratio from 50 ml/3.0 g to 50 ml/6.0 g, an increase in the precipitation efficiency was observed from 22.08 to 99.3 % and by further increase, a slight effect was noticed. The optimum ratio is 50 ml/4.0 g.
Figure 7. Effect of acidic solution/calcium carbonate mass ratio, L/S on calcium monohydrogen phosphate precipitation%.
Effect of reaction temperature
The process was carried out at different temperatures (20 - 60 oC) for 15 min, stirring speed of 400 rpm and acidulate
solution/calcium carbonate mass ratio was 50 ml/4 g. Figure 8 shows a slight effect on the precipitation efficiency (20 - 40 oC) while at 40 - 60 oC, the precipitation efficiency
decreases. This could be due to the solubility of calcium
20 30 40 50 60 70 80 90 100 110
1 2 3 4 5 6 7
Ratio, ml/ g
Leac
hin
g
E,
%
0 10 20 30 40 50 60 70 80
0 10 20 30 40 50 60 70
Time, min
Pr
ec
ipitati
on E,
%
0 20 40 60 80 100 120
2 2.5 3 3.5 4 4.5 5 5.5 6 6.5
Amount of Addition, g
Pr
ec
ipitati
on E,
Eur. Chem. Bull., 2013, 2(10), 752-757 DOI: 10.17628/ECB.2013.2.752
756
monohydrogenphosphate precipitate again at high
temperature. Therefore, room temperature is preferred.
Figure 8. Effect of temperature on calcium monohydrogen phosphate precipitation %
Effect of mixing stirring speed
The effect of mixing stirring speed was assayed in the
range of 200 to 800 rpm on the calcium
monohydrogenphosphate precipitation. The results in Fig. 9 indicate that, as the speed increases from 200 to 800, the precipitation efficiency increases from 72.5 to 78.60 meaning that the speed has a slight increase in calcium monohydrogenphosphate precipitation %. Accordingly, 400 rpm is suitable.
Figure 9. Effect of mixing stirring speed on calcium monohydrogenphosphate precipitation%
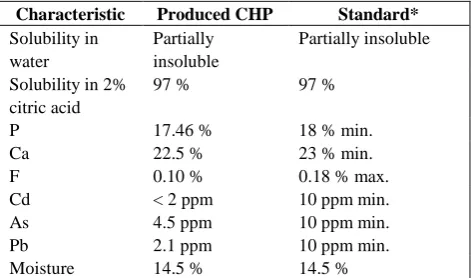
Table 5. Calcium monohydrogenphosphate produced from addition of 100 g of calcium carbonate to 1000 ml of acidulate solution for 15 min at room temperature and stirring speed was 400 rpm according to ISO-9001:2000 standard.
* According to ISO-9001:2000 standard.
Developed
CHP
production flow sheetBased on the aforementioned investigation, a process for CHP production was developed. In this respect, 1000 ml of the produced acidulate solution was reacted with 100 g of calcium carbonate by mixing at 400 rpm for 15 min at room temperature. The precipitate was filtered and dried at 105 oC
for 5 h. Analysis of the product is given in Table 5 together with the standard quality of CHP given in the ISO-9001: 2000. From this table, it is clear that the specification of CHP produced by the developed method is combatable with ISO-9001: 2000 specifications.
Conclusion
The preferred leaching conditions for Sebaiya phosphate
ore of particle size ≤ 1180 µm were HNO3 (10%),
temperature (25 oC), HNO
3/Sebaiya phosphate ore mass
ratio (6 ml/1 g), stirring speed (400 rpm) and mixing period (15 min). The leaching efficiency was 96.5%. Calcium monohydrogenphosphate from the produced acidulate solution was successfully precipitated using calcium carbonate. The precipitation efficiency was 97.2% using acidulate solution/calcium carbonate mass ration of 10, stirring time of 15 min, stirring speed of 400 rpm and at 25
oC. The specification of the produced CHP is combatable
with the ISO-9001: 2000 specifications.
References
1European Fertilizer Manufacturers Association, Booklet No. 4(8)
Production of phosphoric acid, Belgium, 2000.
2Zidan, I. H. Geological and mineralogical studies of Abu-Tartur
phosphates western desert-Egypt, M.Sc. Thesis, Fac. of Sci.
Geology Dept., Al-Azhar University, 1998.
3Al-Wakeel, G. M.. Int. J. Miner. Process, 2005, 75, 101–112. 4Chojnacki, A., Chojnack, K. and Gorecki, H., J. Chem. Tech.
Biotech., 2005, 80, 1331.
5Abdel-Aal E. A. and Amer, A. M., Bull. Fac. Sci., Alexandria
Univ., 1991, 31, 344-359.
6Rashad, M. M. Mahmoud, M. H. H. Ibrahim I. A.and Abdel-Aal,
E. A., J. Cryst. Grow, 2004, 267, 372.
7Rashad, M. M., Mahmoud, M. H. H., Ibrahim I. A. and Abdel-Aal,
E. A., J. Cryst. Grow, 2005, 40, 741.
8Abdel-Aal, E. A., Cryst. Res. Technol., 39 (2004) 123.
9Mahmoud, M. H. H., Rashad, M. M., Ibrahim I. A. and Abdel-Aal, E. A., J. Colloid Interface Sci., 2004, 270, 99.
10El-Shafie, A. S. Studies on the production of phosphoric acid
from Abu-Tartur phosphate ore deposits, M.Sc. Thesis, Fac.
of Sci. Chemistry Dept., Zagazig University, 2008.
11Abdel-Aal, E. A., Minerals Eng. J., 2000, 13, 223-226. 12De Waal, J. C., US 6183712 B1, 2001.
13Takhim, M., US 2005-0238558 A1, 2005.
14Zafar, I. Z. Mahmood, A. T. Mohammad, A. Amin, A. M.,
Iranian J. Chem. Chem. Eng. 2006, 25, 47-57.
15Takhim, M. US 2007-0122326, 2007
16Khadr, M. E., Phsico-chemical studies on wet process phosphoric
acid. M.Sc. Thesis, Fac. of Sci., Chem. Dept. Al-Azhar University, 1999.
17Mizane, A. and Louhi, A., J. Eng. Appl. Sci., 2007, 2, 1016-1019.
61 62 63 64 65 66 67 68 69 70
10 20 30 40 50 60 70
Temperature, oC
Pr
ec
ipitati
on E,
%
50 55 60 65 70 75 80 85 90 95 100
100 200 300 400 500 600 700 800 900
Stirring Speed, rpm
Prec
ipitatio
n E,
%
Standard* Produced CHP
Characteristic
Partially insoluble Partially
insoluble Solubility in
water
97 % 97 %
Solubility in 2% citric acid
18 % min. 17.46 %
P
23 % min. 22.5 %
Ca
0.18 % max. 0.10 %
F
10 ppm min. < 2 ppm
Cd
10 ppm min. 4.5 ppm
As
10 ppm min. 2.1 ppm
Pb
14.5 % 14.5 %
Eur. Chem. Bull., 2013, 2(10), 752-757 DOI: 10.17628/ECB.2013.2.752
757
18Abdel-Aal E.A. and Amer, A. M., Minerals Eng., 1995, 8
1221-1230.
19El-Moussaouiti, M. Boistelle, R. Bouhaouss A. and Klein J. P.,
Chem. Eng. J., 1997, 68, 123-130.
20Fawzy, M. M. Purification of wet process phosphoric acid for
preparation of dicalcium phosphate, M.Sc. Thesis,
Chemistry Department, Faculty of Science, Benha University,
2006.