SYNERGISM OF V
2O
5AND ZnS IN THE PHOTO-OXIDATIVE
CONVERSION OF DIPHENYLAMINE ON CdO SURFACE
C. Karunakaran
[a]* and S. Karuthapandian
[a]Keywords: Semiconductor; photocatalysis; sunlight; band gap; interparticle charge transfer.
Diphenylamine (DPA) is photocatalytically oxidized to N-phenyl-p-benzoquinone imine (PBQ) on the surface of CdO in ethanol under UV light as well as natural sunlight. The variation of the rate of PBQ formation on CdO surface with (i) [DPA] and (ii) airflow rate conforms to the Langmuir-Hinshelwood kinetic law. The catalyzed PBQ formation increases with the catalyst loading and light intensity. UV-C light is more effective in catalyzed PBQ formation than UV-A light, and the catalyst is reusable. The reaction mechanism on the illuminated CdO surface is discussed, and the kinetic constants deduced. V2O5 and ZnS enhance the photocatalyzed formation of PBQ.
*Corresponding Author Tel: +919443481590
E-Mail: [email protected]
[a] Department of Chemistry, Annamalai University, Annamalainagar 608002, Tamilnadu, India.
Introduction
Selective chemical transformations brought out by semiconductor photocatalysis attract attention.1-3 TiO
2 based
materials are widely used as photocatalysts for chemical transformation. Alcohols are selectively oxidized to ketones with TiO2 as a photocatalyst, and functionalized nitroarenes
are selectively reduced using N-doped TiO2 photocatalyst.2
However, the TiO2-based photocatalysts require UV light
for the organic transformations. A search of a visible light photocatalyst for organic synthesis enables utilization of natural sunlight, and here we report oxidative transformation of diphenylamine (DPA) to N-phenyl-p-benzoquinone imine (PBQ) using CdO as a visible light photocatalyst. DPA is widely used in the post-harvest treatment of apple, and pear.4 Reports on photosensitized oxidation of DPA with
UV light are many and cyanoanthracenes5, and
benzophenone6 are some of the photosensitizers employed.
We have reported the photooxidation of DPA to
N-phenyl-p-benzoquinone imine (PBQ) in the absence of photosensitizer.7 CdO is a narrow band gap semiconductor,
and the aim of the present study is to speed up the oxidative transformation of DPA into PBQ by using CdO as a visible light photocatalyst. Another objective of the present investigation is to establish the kinetic model of the light-induced organic transformation by investigating the reaction with UV light as well as natural sunlight under different experimental conditions. It is also of interest to speed up further the photoinduced reaction on CdO surface through interparticle charge separation process by using particulate CdO-V2O5 or CdO-ZnS mixture.
Experimental
CdO, ZnS, and V2O5 (Johnson Matthey) were used as
supplied and their BET surface areas were determined as 14.45, 7.669 and 16.14 m2 g-1, respectively. The sizes of the
particles suspended in methanol were measured with an
Easy particle sizer M1.2 Malvern Instruments (focal length 100 mm, beam length 2.0 mm). Standard procedure was followed to prepare potassium tris(oxalato)ferrate(III), K3[Fe(C2O4)3].3H2O.8 DPA, AR (Merck) was used as
received. Commercially available ethanol was purified by distillation over calcium oxide.
UV-photocatalysis
The photocatalytic transformation in ethanol with UV-A light was carried out using a multilamp photoreactor with eight 8 W mercury UV lamps (Sankyo Denki, Japan) of wavelength 365 nm, shielded by a highly polished anodized aluminum reflector. Four cooling fans at the bottom of the reactor dissipate the heat produced. A borosilicate glass tube of 15-mm inner diameter was employed as the reaction vessel and was placed at the center of the photoreactor. Air was passed through the DPA solution (5 mM unless otherwise mentioned) which kept the catalyst power (1.0 g unless otherwise stated) under suspension and at constant motion. The airflow rate was measured by soap bubble method which was 7.8 mL s-1 unless otherwise given. The
photon flux (I) was determined by ferrioxalate actinometry which was 25.2 μeinstein L-1 s-1 unless otherwise stated.
The photocatalytic transformation was also carried out in a micro-photoreactor fixed with a 6 W 254 nm low-pressure mercury lamp and a 6 W 365 nm mercury lamp. Quartz and borosilicate glass tubes were employed for 254 and 365 nm lamps, respectively. The volume of the reaction solution was 25 mL in the multilamp photoreactor and 10 mL in the micro-photoreactor. The UV-visible spectra were obtained with a Hitachi U-2001 UV-visible spectrophotometer, after dilution of the solution to retain the absorbance within the Beer-Lambert law limit. The PBQ formed was estimated from its absorbance at 450 nm.
Solar-photocatalysis
The solar photocatalytic transformation was performed in summer (March-July) under the clear sky at 11.30 am - 12.30 pm. The solar irradiance (W m-2) was measured with a
The near UV light and visible light of wavelength less than 560 nm are responsible for band gap-excitation of CdO, and the intensity of sunlight (einstein L-1 s-1) was also
obtained by ferrioxalate actinometry, which covers a wavelength range of 250 – 577 nm; 440 W m-2 corresponds
to 22 μeinstein L-1 s-1. Fresh ethanolic solutions of DPA of
required concentration (5 mM unless otherwise stated) were taken in wide cylindrical glass vessels of uniform diameter and the entire bottom of the vessel (11.36 cm2 unless
otherwise mentioned) was covered by CdO powder. Air was bubbled (4.6 mL s-1 unless otherwise given) employing a
micro pump without disturbing the CdO bed (1.0 g unless otherwise stated). The volume of DPA solution was 25 mL, and the loss of ethanol due to evaporation was compensated periodically. PBQ formed was estimated as stated already.
Results and discussion
Photocatalytic transformation with UV light
The photocatalytic transformation of DPA on CdO surface, in the presence of air in ethanol, was studied using multilamp photoreactor. The UV-visible spectra of the DPA solution at different illumination time presented in Figure 1 display the formation of PBQ (λmax= 450 nm).
Figure 1. UV-vis spectra of reaction solution (5-times diluted, [DPA] = 20 mM) at 0, 30, 60, 90 and 120 min (↑); inset: linear variation of [PBQ] with illumination time.
The illuminated solution is EPR silent showing the absence of diphenylnitroxide. Besides, thin layer chromatographic analysis using silica gel G coated plate with benzene as eluent shows the formation of a single product; the irradiated DPA solution was evaporated after the recovery of CdO particles and the solid was dissolved in chloroform to develop the chromatogram. The PBQ formed was estimated from the measured absorbance at 450 nm using the reported molar extinction coefficient.9,10 The linear
increase of [PBQ] with irradiation time (Figure 1 inset) affords the initial rate of PBQ formation, and the rates are reproducible to ±6%. As the photoformation of PBQ in the absence of CdO is not negligible 7 the rate of PBQ formation
on CdO surface was obtained by measuring the rates of PBQ formation in the presence and absence of CdO. The rate of
PBQ formation on CdO increases with [DPA] displaying Langmuir-Hinshelwood kinetics with respect to [DPA]; Figure 2 displays the results.
Figure 2. Rate dependence on [DPA].
The increase of the amount of CdO suspended in the DPA solution results in increased PBQ formation on CdO surface, but the rate reaches a limit at high catalyst loading as shown in Figure 3.
Figure 3. Variation of PBQ-formation rate with catalyst loading.
Determination of the PBQ formation on CdO surface at different airflow rates shows enhancement of the reaction by oxygen and the variation of the reaction rate with the airflow rate conforms to the Langmuir-Hinshelwood kinetics; Figure 4 presents the results. PBQ formation on CdO was also determined without bubbling air, but the solution was not deoxygenated. The dissolved oxygen itself brings in the surface catalyzed reaction, but the PBQ formation is slow. The PBQ formation on CdO was examined at different light intensities. The reaction was carried out with two, four and eight lamps; the angles sustained by the adjacent lamps are 180°, 90° and 45°, respectively. Figure 5 shows the variation of the reaction rate as a function of the photon flux. PBQ is not formed in the absence of irradiation. Study of PBQ formation on CdO surface with a 6 W 365 nm mercury lamp (I = 18.1 μeinstein L-1 s-1) and a 6 W 254 nm low-pressure
micro-photoreactor under identical conditions reveals that high energy radiation is more effective in bringing out the surface reaction.
Figure 4. Influence of airflow rate on photocatalytic PBQ-formation.
Figure 5. Effect of photon flux on reaction rate.
PBQ formation on CdO with illumination at 365 and 254 nm are 2.2 and 16.5 nM s-1, respectively. The CdO surface
does not lose its photocatalytic activity on usage. Reuse of the catalyst reveals sustainable photocatalytic efficiency. Azide ion (5 mM), a singlet oxygen quencher, does not suppress the formation of PBQ indicating the absence of involvement of singlet oxygen in the photocatalysis. This is on the expected line; Fox and Chen11 ruled out the
possibility of singlet oxygen in the TiO2-photocatalyzed
olefin-to-carbonyl oxidative cleavage.
Solar photocatalytic transformation
The photocatalytic transformation of DPA on CdO surface in the presence of air in ethanol under natural sunlight also provides PBQ (vide infra). Measurement of solar irradiance (W m-2), even under the clear sky, shows the significant
fluctuation of sunlight intensity during the experiment. Hence, the solar experiments at different reaction conditions were carried out in a set so that the quantity of sunlight
incident on unit area does not differ. This renders possible the comparison of solar results. A pair of solar experiments carried out simultaneously under identical conditions yield results within ±6%, and this is so on different days. The effect of operational parameters on the surface catalyzed reaction under natural sunlight was investigated by carrying out the given set of experiments simultaneously, and the data in each figure are under identical sunlight intensity. The product formation rates were obtained on illuminating the reaction solutions for 1 h. Figure 2 displays the reaction rate at different [DPA]. The PBQ formation increases with [DPA] and follows Langmuir-Hinshelwood kinetic law. Figure 4 shows the dependence of the rate of surface reaction on the airflow rate. The surface reaction is enhancement by oxygen, and the reaction exhibits Langmuir-Hinshelwood kinetics with respect to oxygen. The PBQ formation on the surface was studied without bubbling air, but the solution was not deoxygenated. The dissolved oxygen itself effects the catalysis. However, the reaction is slow. The PBQ formation on CdO increases linearly with the apparent area of the CdO bed as shown in Figure 6. PBQ is not formed in the absence of illumination. The CdO surface does not lose its catalytic activity on irradiation. Reuse of the CdO powder shows sustainable photocatalytic activity.
Figure 6. The linear dependence of photocatalytic rate on the apparent surface area.
Mechanism
The determined band gap energy of CdO is 2.2 eV and band gap-illumination results in the creation of electron-hole pairs; electron in the conduction band (CB) and the hole in the valence band (VB). The recombination of the charge carriers in the semiconductor is rapid (occurring in a picosecond time scale) and for an effective photocatalysis, the reactants are to be adsorbed on the surface of CdO.12 The
hole reacts with the adsorbed DPA molecule to form diphenylamine radical-cation (Ph2NH•+). The oxygen
molecule adsorbed on the surface of CdO removes the CB electron. The formed superoxide radical-anion is likely to react with diphenylamine radical-cation yielding PBQ (Scheme 1).
CdO + hν → h+
(VB) + e‒(CB)
O2(ads) + e‒(CB) → O2•‒
Ph2NH•+ + O2•‒ →
+ H2O
Scheme 1. Photocatalytic mechanism
Kinetic law
The kinetic equation corresponding to photoinduced surface reaction taking place in a continuously stirred tank reactor (CSTR)13 is:
(1)
where
is the rate of PBQ photoformation on CdO
K1 and K2 are the adsorption coefficients of DPA and
O2 on the illuminated CdO surface,
k is the specific rate of oxidation of DPA, γ is the airflow rate,
S is the specific surface area of CdO,
C is the amount of CdO suspended per litre, and
I is the intensity of illumination.
The data fit the Langmuir-Hinshelwood curve, drawn using a computer program,13 confirming the rate law. In
addition, linear double reciprocal plots of surface reaction rate versus (i) [DPA] and (ii) airflow rate are in agreement with the kinetic law. The fits provide the adsorption coefficients K1 and K2 as 390 L mol-1 and 0.031 mL-1 s,
respectively, and the specific oxidation rate k as 3.4 μmol L m-2 einstein-1. However, the rate of surface reaction fails to
vary linearly with the amount of CdO suspended. This is because of the high catalyst loading. At high CdO loading, the surface area of the catalyst exposed to illumination does not commensurate with the weight of the catalyst. The quantity of CdO employed is beyond the critical amount corresponding to the volume of the reaction solution and reaction vessel; the whole quantity of CdO is not exposed to the light. The photocatalysis lacks linear dependence on illumination intensity; less than first power dependence of surface-photocatalysis rate on light intensity at high photon flux is well known.14
Synergism by V2O5 and ZnS
Charge transfer across heterojunction in coupled semiconductors enhances the photocatalytic efficiency, and examples for coupled semiconductors are many.15 In
coupled semiconductors, both the semiconductors exist in the same particle, and charge separation occurs within the particle. But what we observe here is enhanced PBQ
formation on mixing V2O5 or ZnS powder with particulate
CdO under UV light. Figure 7 displays the enhanced surface reaction by the CdO-V2O5 mixture and CdO-ZnS mixture -
the two particulate semiconductors were in suspension and constant motion.
Figure 7. Enhanced PBQ formation on mixing CdO with V2O5 or ZnS.
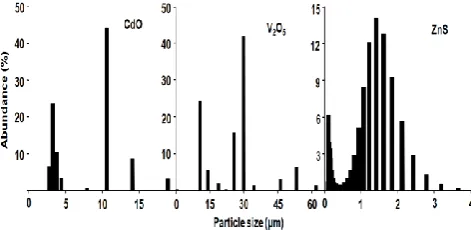
This enhanced photocatalytic transformation is due to interparticle charge transfer. Nanoparticles in suspension aggregate.16 Figure 8 displays the particle size distributions
of CdO, V2O5, and ZnS in suspension. They were
determined by light scattering technique. But the mean particle sizes (t) of CdO, V2O5, and ZnS, obtained by using
the relationship t = 6/ρS, where ρ is the material density and S is the specific surface area, are 51, 111, and 190 nm, respectively. Examination of Figure 8 in conjunction with the determined particle sizes shows aggregation of the particles.
Figure 8. Aggregation of nanoparticles.
As observed in individual semiconductor suspension, aggregation is likely in particulate semiconductor mixtures under suspension, and both the semiconductor particles are likely to be present in the aggregates. Charge transfer between CdO and V2O5 or ZnS particles is likely to occur
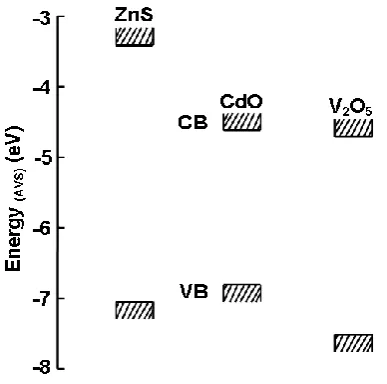
when both the semiconductors are under band gap-illumination and in contact with each other; electron from CB of a semiconductor may move to another if the latter is of low energy, and so is the hole from VB. The CB and VB edge positions of CdO, V2O5, and ZnS are presented in
Figure 9.17 The CB, and VB energy levels determine the
charge transfer between the particulate semiconductors. The CB electron of CdO is more cathodic than that of V2O5. This
enables transfer of the electron from the CB of CdO to the
N O
1
11 2
1
2
K K SIC DPA
k
K DPA
K
CB of V2O5. On the other hand, the CB of CdO is less
cathodic than that of ZnS. This favors transfer of CB electron of ZnS to CdO. The VB hole of CdO is less anodic than those of V2O5 and ZnS. This renders possible the
movement of VB hole of ZnS as well as that of V2O5 to
CdO. This interparticle charge transfer enhances the photocatalysis. The energy difference between the CB electrons of the two semiconductors is the driving force for the interparticle electron injection, and the free energy change is given by –ΔG = e(E(CBSC1) – E(CBSC2).18 In terms of
redox chemistry, the CB and VB refer to the reduced and oxidized states in the semiconductor.
Figure 9. The CB and VB edges.
In CdO, V2O5 and ZnS, the CB electrons refer to the
reduced forms of Cd2+ (i.e., Cd+), V5+ (i.e., V4+) and Zn2+
(i.e., Zn+), respectively. Similarly, the VB hole refers to the
oxidized forms of the corresponding O2- (i.e., O-) or S2- (i.e.,
S-). The interparticle charge-transfer, the transfer of the
electron from the CB of ZnS to that of CdO refers to the electron jump from Zn+ to Cd2+. In the case of CB electron
movement from CdO to V2O5, it is from Cd+ to V5+.
Similarly, the VB hole-transfer from V2O5 and ZnS to CdO
corresponds to the hole-jump from O- of V
2O5 and S- of ZnS
to O2- of CdO. The possibility of cross-electron–hole
combination, the transfer of the electron from the CB of one semiconductor (SC1) to the VB of the other (SC2) is very remote; the very low population of the excited states makes the electron transfer between two excited states highly improbable. A possible reason for not observing the maximum photocatalytic efficiency at 50% wt. composition for the semiconductor mixtures is the densities and particle sizes of the semiconductors and also the aggregation.
Conclusions
The oxidation of DPA to BPQ on CdO surface is driven by natural sunlight as well as artificial UV light. The BPQ formation enhances with [DPA] and airflow rate and conforms to Langmuir-Hinshelwood kinetic law. The
transformation of DPA into PBQ on CdO surface is more under UV-C light than with UV-A light. CdO mixed with either V2O5 or ZnS shows the larger formation of PBQ due
to interparticle charge separation.
References
1Lang, X., Chen, X., Zhao, J., Chem. Soc. Rev. 2014, 43, 473. https://doi.org/ 10.1039/C3CS60188A
2Palmisano, G., Garcia-Lopez, E., Marci, G., Loddo, V., Yurdakal, S., Augugliaro, V., Palmisano, L., Chem. Commun., 2010, 46, 7074. https://doi.org/10.1039/C0CC02087G
3Shiraishi, Y., Hirai, T., J. Photochem. Photobiol. C, 2008, 9, 157. https://doi.org/10.1016/j.jphotochemrev.2008.05.001
4Zanella, A., Postharvest Biol. Technol. 2003, 27, 69. https://doi.org/10.1016/S0925-5214(02)00187-4
5Chang, Y. C., Chang, P. W., Wang, C. M., J. Phys. Chem. B, 2003, 107, 1628. https://doi.org/10.1021/jp021852j
6Lin, T.S., Retsky, J., J. Phys. Chem. 1986, 90, 2687. https://doi.org/10.1021/j100403a026
7Karunakaran, C., Karuthapandian, S., Sol. Energy Mater. Sol.
Cells, 2006, 90, 1928.
https://doi.org/10.1016/j.solmat.2005.12.003
8Adams, D. M., Raynor, J. B., Advanced Practical Inorganic Chemistry, John Wiley: New York, 1965.
9Puri, S., Bansal, W. R., Sidhu, K. S., Indian J. Chem. 1973, 11, 828.
10Bansal, W. R., Ram, N., Sidhu, K. S., Indian J. Chem. B, 1976, 14, 123.
11Fox, M. A., Chen, C. C., J. Am. Chem. Soc. 1981, 103, 6757. https://doi.org/10.1021/ja00412a044
12Xu, H., Ouyang, S., Liu, L., Reunchan, P., Umezawa, N., Ye. J.,
J. Mater. Chem. A, 2014, 2, 12642.
https://doi.org/10.1039/C4TA00941J
13Karunakaran, C., Senthilvalen, S., Karuthapandian, S., Sol. Energy Mater. Sol. Cells, 2005, 89, 391. https://doi.org/10.1016/j.solmat.2005.01.008
14Vincze, L., Kemp, T. J., J. Photochem. Photobiol. A, 1995, 87, 257. https://doi.org/10.1016/1010-6030(94)03985-4
15Karunakaran, C., Sakthiraadha, S., Gomathisankar, P., Vinayagamoorthy, P., RSC Adv. 2013, 3, 16728. https://doi.org/10.1039/c3ra41872c
16Li, M., Noriega-Trevino, M. E., Nino-Martinez, N., Marambio-Jones, C., Wang, J., Damoiseause, R., Ruiz, F., Hock, E. M. V., Environ. Sci. Technol. 2011, 45, 8989. https://doi.org/10.1021/es201675m
17Xu, Y., Schoonen, M. A. A., Am. Mineral. 2000, 85, 543. 18Katoh, R., Furube, A., Yoshihara, T., Hara, K., Fujihashi, G.,
Takano, S., Murata, S., Arakawa, H., Tachiya, M., J. Phys. Chem. B, 2004, 108, 4818. https://doi.org/10.1021/jp031260g
![Figure 2. Rate dependence on [DPA].](https://thumb-us.123doks.com/thumbv2/123dok_us/7828676.2088763/2.595.314.509.111.264/figure-rate-dependence-on-dpa.webp)