Using multivariate quantile regression analysis
to explore cardiovascular risk differences in
subjects with chronic kidney disease by race
and ethnicity: Findings from the U.S. Chronic
Renal Insufficiency Cohort Study
Longjian Liu
1,21 Department of Epidemiology and Biostatistics, and Department of Environmental and Occupational Health, Drexel University School of Public Health, Philadelphia, PA, United States
2 Department of Medicine (Adjunct position), Drexel University College of Medicine, Philadelphia, PA, United States
Introduction
Adults with chronic kidney disease (CKD) carry an
extraordinarily high risk for cardiovascular disease (CVD). This excess risk disproportionately affects minority populations1-4.
Therefore, a logical starting point for CVD prevention is determining the extent to which CVD risk factors are responsible for the excess risk in patients with CKD. While the literature on race/ethnicity disparities of CVD risk in patients with CKD has being accumulated, most studies use conventional analysis approaches, such as linear regression and ordinal regression models to address an average differences in CVD risk profiles between non-Hispanic white (NHW) and minority populations5-7. Evidence using these analyses fails to
describe specific differences in certain sub-populations who are exposed to an even worse risk of disease. For example, the distributions of CVD risk factors and outcomes may vary by ages and race/ethnicity. Although several studies have observed that non-Hispanic black (NHB/African Americans) had a significantly higher CVD risk than NHW,8, 9 few studies have
been conducted to examine the distributions of risk factors in detail that are attributable to the excess CVD risk in NHB versus
NHW. The present study aimed to apply quantile regression (Qreg) analysis, a robust data analysis approach,5-7 to test two
hypotheses. First, CVD risk factors disproportionately affect NHB than NHW. Second, this difference in CVD risk significantly contributes to an excess risk of prevalent CVD in NHB versus NHW.
Methods
Study Population and Design
To test the study hypotheses, data from the Chronic Renal Insufficiency Cohort (CRIC) Study, a unique population based cohort study among subjects with CKD, was used 3,10. The
CRIC Study, supported and established by the National Institute of Diabetes and Digestive and Kidney Diseases (NIDDK) in 2001, was designed as a prospective cohort study of 4,073 participants enrolled through seven clinical centers (John Hopkins University, Case Western Reserve University, Kaiser Permanente of Northern California, Tulane University Health Science Center, University of Illinois at Chicago, University of Michigan at Ann Arbor, and University of Pennsylvania Medical Center) and who were eligible to take part in the study.
ISSN: 2410-2636 © Barcaray Publishing * Corresponding author. E-mail: [email protected]
Abstract
Background and Aims: Adults with chronic kidney disease (CKD) carry an extraordinarily high risk for cardiovascular disease (CVD). The present study aimed to test two hypotheses that: (1) CVD risk factors disproportionately affect non-Hispanic black (NHB) with CKD compared to non-Hispanic white (NHW). (2) This difference significantly contributes to an excess risk of CVD in NHB versus NHW.
Methods: A total of 3,939 aged 21-74 years old participating in the Chronic Renal Insufficiency Cohort Study was analyzed. A sum weighted CVDRisk score was constructed from well-established CVD risk factors. Differences in CVD Risk score by race/ ethnicity were tested using quantile regression (Qreg) analysis.
Results: The prevalence of CVD was 30.7% in NHW and 38.2% in NHB (p<0.001). The means (SD) of CVD Risk score were 12.6 (5.7) in NHW and 14.6 (6.4) in NHB (p<0.001). Qreg analysis indicated that NHB with estimate glomerular filtration rate (eGFR) 30-59.9 ml/min/1.73m2 had significantly higher (worse) CVD Risk scores across all quantiles (Qs) than NHW. This race differences in CVD Risk were also significantly higher in NHB with eGFR 60-70 ml/min/1.73m2 in Qs 1 and 2 as compared to their NHW counterparts. An estimated 35.8% of the excess prevalent CVD could be attributable to the difference in CVD Risk for NHB versus NHW.
Conclusion: NHB have a significantly higher CVD risk factor score in those with moderate and mild CKD than NHW.
The detailed design and methods have been described elsewhere3,10. Briefly, the CRIC Study included a racially and
ethnically diverse group of adult patients who were aged 21-74 years and had mild to moderate CKD using age based estimated glomerular filtration rate (eGFR). These age-based inclusion criteria were eGFR of 20 to 70, 20 to 60, and 20 to 50 ml/min/1.73 m2 for age range 21-44, 45-64 and 65-74 years respectively. The age-based eGFR entry criteria were established to limit the proportion of older individuals who were recruited with age-related diminution of eGFR but otherwise non-progressive CKD 3, 10. Informed consent was obtained
from all participants. The CRIC Study protocol was approved by institutional review boards (IRB) at participating institutes, and the research was conducted in accordance with the ethical principles of the Declaration of Helsinki 3, 10. The present study
used data from NIDDK Central Repository, and has been approved by the IRB of Drexel University, Philadelphia, PA. The final analytic sample included CRIC Study baseline participants of 1,824 NHW, 1,658 NHB, and 457 for all other race/ethnicity groups.
Study key variables
Data on sociodemographic characteristics, medical history, lifestyle behaviors, current medications, and anthropometric measures (i.e., weight, height, waist circumference and blood pressure) were obtained. Chronic conditions, including history of myocardial infarction (MI), congestive heart failure (CHF), peripheral vascular disease (PVD) and stroke and diabetes mellitus (DM) were collected from the medical history records. Blood pressure (BP) was measured using a validated protocol and calibrated sphygmomanometers. Hypertension was defined as systolic BP (SBP) ≥140 mmHg, or diastolic BP (DBP) ≥ 90 mmHg, or self-reported use of antihypertensive medication. DM was defined as a fasting glucose ≥126 mg/ dl, random glucose ≥200 mg/dl, or use of insulin or other anti-diabetic medication. Levels of intentional physical activity were measured based on survey questions regarding different types of physical activity and time. Minutes of activities were summed for each discrete activity type, converted to hours for case of presentation, and multiplied by metabolic equivalent (MET) level. A higher sum MET score (hours per week) represents a higher physical activity level. Four groups of the total intentional exercise were classified as MET=0, <21, 21-40, and ≥41 hours/week on the basis of 0, <50%, 50-74.9%,
and ≥75% distribution of MET score in the total study sample. Smoking status was categorized into three groups of never smoked, former smoker (for those who smoked more than 100 cigarettes in their lifetime, but had stopped in baseline survey) and current smokers. Serum creatinine was measured at the University of Pennsylvania laboratory and calibrated based on standard measurements made from the Cleveland Clinic Foundation laboratory in Cleveland, OH. eGFR was calculated using the Modification of Diet in Renal Disease (MDRD)
estimating equation 11. Serum total and high density lipoprotein cholesterol (TC and HDL-C), triglycerides (TG), glucose and high sensitive C-reactive protein (hs-CRP) were measured using standard methods in the CRIC Study’s central laboratory, and low density lipoprotein cholesterol (LDL-C) level was calculated using the Friedewald equation 3, 10.
Statistical analysis
A serial analysis was conducted. First, baseline characteristics of participants across three race/ethnicity groups (NHW, NHB and others) were tested using univariate analysis. Variables that were non-normally distributed were tested using Wilcoxon rank nonparametric test (MET, LDL, TG, glucose and hs-CRP).
In the second group analysis, although targeting individual CVD risk factors is important, preventive medicine and public health usually aims to reduce overall risks. For this reason, a sum weighted CVD Risk (CVDRisk) score derived from multiple CVD risk factors was developed. To create the sum weighted score, associations of five components of metabolic syndrome (MS),9, 12, 13 and other five CVD risk factors (elevated TC and LDL,
hs-CRP, smoking and physical inactivity) with CVD prevalence (including any MI, CHF, PVD and/or stroke) were examined using multivariate logistic regression model. The cut-off points of five MS components were defined using the criteria of the American Heart Association 9, 12, 13. It includes (1) larger waist
circumference (WC, male/female: ≥102/88 vs. <102/88 cm), (2) high BP (SBP/DBP≥130/85 vs. SBP/DBP<130/85 mm Hg), (3) decreased HDL-C (male/female: ≤45/50 vs. >45/50 mg/ dl), (4) elevated glucose (≥100 vs. <100 mg/dl), (5) elevated TG (≥150 vs. <150 mg/dl). The other five risk factors were (1) elevated TC (TC ≥200 vs. <200 mg/dl), (2) elevated LDL-C (≥130 vs. <130 mg/dl), (3) elevated hs-CRP (>3 vs. ≤3 mg/dl), (4) smoking status (Never, former, and current smokers), and (5) physical inactivity. After testing for collinearity, TC and LDL-C
0.0
5.0
10.0
15.0
20.0
25.0
30.0
N HB Ot her HNW No Yes No Yes No Yes No Yes No Yes No Yes
Cu rren t Fr oma l N ev
er No
M
id
dl
e
High
Race WC ↑ HTN HDL↓ Glucose ↑ TG ↑ hs_CRP ↑ Smoking MET
M ean CVDR isk sc or e
Variables used to create CVDRisk score
Fig ure 1. Mean of CVDRisk scores by race/ethnicity and individual CVD risk factors
(Note: WC: Waist circumference, HTN: High BP,
TG: Triglycerides, hs_CRP: high sensitivity C_reactive protein; MET: Intentional activity's metabolic equivalent level.)
** ** **** ** ** ** ** ** ** ** **: P<0.01
Figure 1: Mean of CVDRisk scores by race/ethnicity and individual CVD risk factors
were excluded and the remaining eight factors were included to develop a sum weighted CVD risk score using formula: CVD Risk score =Ʃ(βi*χi), where β is the regression coefficient of the association between a factor (χi) and CVD prevalence. This approach of developing a sum weighted score has been applied and validated by several studies including our own work 14-19.
In the third group analysis, multivariate quantile regression analysis was applied to examine the distributions of CVDRisk score in NHB versus NHW. The cut-off points of quantiles (Qs)
were 25%, 50%, 75% and 90%. Coefficients from quantile regression models are interpreted in a manner similar to linear and ordinal least squares (OLS) regression analyses, but focusing on differences in each quantile distribution of CVDRisk score5-7. In the study, CVDRisk score was log-transformed in
order to easily interpret as a constant percentage difference for NHB, and the other race group versus NHB5, 20. The percentage
differences by race/ethnicity were estimated using the formula, 100*(eβi -1), where β is the coefficient of race/ethnicity (NHB or Others vs. NHW) on CVDRisk score (log-transformed).5, 20 To Table 1: Baseline characteristics of participants by race/ethnicity, CRIC Study.
Variable (n=1824)NHW
M or % (SD)
NHW (n=1658) M or % (SD)
Other race groups (n=457)
M or % (SD) p-value
Continuous var., mean
Age (years) 58.57 (11.16) 58.11 (10.63) 56.68 (11.62) 0.0045
WC (cm) 105.02 (17.22) 108.00 (18.18) 101.20 (15.39) <0001
MET* 24.07 (35.00) 25.32 (51.08) 21.47 (43.19) <.001
SBP (mmHg) 69.25 (11.53) 73.62 (13.53) 72.95 (12.42) <.0001
DBP (mmHg) 69.25 (11.53) 73.62 (13.53) 72.95 (12.42) <.0001
TC (mg/dL) 180.88 (42.74) 185.47 (45.62) 188.54 (54.81) 0.001
LDL (mg/dl)* 99.82 (32.99) 105.99 (37.16) 102.41 (38.65) <.0001
HDL (mg/dl) 46.81 (14.94) 49.33 (16.11) 43.65 (14.34) <.0001
TG (mg/dL)* 164.49 (115.65) 140.16 (110.28) 189.16 (127.60) <.001
Glucose (mg/dL)* 99.82 (32.99) 105.99 (37.16) 102.41 (38.65) <.0001
hs_CRP (mg/L)* 46.81 (14.94) 49.33 (16.11) 43.65 (14.34) <.0001
GFR (ml/min/1.73 m2) 42.94 (13.15) 43.55 (13.86) 39.95 (13.47) <.0001
Continuous var., %
Male 59.21 48.85 59.30 <.0001
Education
<High School 10.14 26.60 44.30
High School 17.43 22.14 12.28
Associate degree 27.14 34.32 17.98
≥ College 45.29 16.95 25.44
Smoking
Former 46.16 38.48 35.23
Current 8.83 19.36 7.66
Chronic conditions
Hypertension 79.71 92.94 86.87 <.0001
DM 42.87 51.51 59.30 <.0001
MI 22.37 21.95 19.69 0.464
PVD 7.13 7.12 3.06 0.005
CHF 7.07 13.15 7.66 <.0001
Stroke 7.07 13.87 7.22 <.0001
CVD 30.65 38.18 27.13 <.0001
NHW: Non-Hispanic white; NHB: non-Hispanic black; Others: other race groups; M: mean, SD standard deviation; WC: Waist circumference; MET: Intentional activity’s metabolic equivalent (MET) level; SBP/DBP: systolic/diastolic blood pressure
TC: total cholesterol, LDL/HDL: low/high density lipoprotein cholesterol; TG: Triglycerides; CRP: C-reactive prtein. eGFR: Estimated glomerular filtration rate; DM: diabetes, MI: Myocardial infarction; CHF: congestive heart failure;
-50 -45 -40 -35 -30 -25 -20 -15 -10-5 0 5 10 15 20 25 30 35 40 45 50
%
d
iff
er
en
ce
vs
. N
HW
Quantiles of CVDRisk score
Fig 2. Percent difference in CVDRisk scores for NHB and other race groups as compared to NBW (assigned as the reference) in the total study sample and in subgroups by eGFR status
NHW (Ref =1) NHB Others
A: By CVDRisk score
in total sample B: In subjects witheGFR 20-29.9
D: Subjects with eGFR 60-70 C: Subjects with
eGFR 30-59.9
E: Ordinal least squares regression By eGFR for mean CVDRisk scores
Quantile regression
* *
* *
* *
* *
* *
* * *
* *
*:p<0.01,or <.005, see Table 2
Figure 2: Percent difference in CVDRisk scores for NHB and other race groups as compared to NBW (assigned as the reference) in the total study sample and in subgroups by eGFR status
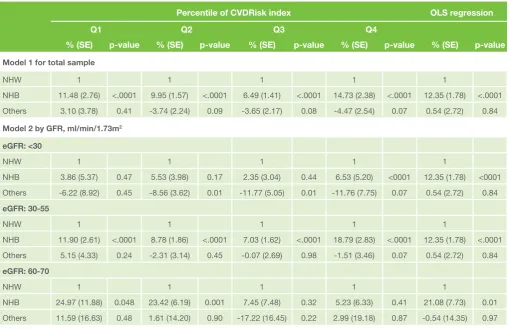
Table 2: Percentage difference in CVDRisk index across quantiles in NHB and other race groups compared to NHW, and eGFR <30 and eGFR 30-59.9 compared to eGFR 60-70 ml/min/1.73m2
Percentile of CVDRisk index OLS regression
Q1 Q2 Q3 Q4
% (SE) p-value % (SE) p-value % (SE) p-value % (SE) p-value % (SE) p-value
Model 1 for total sample
NHW 1 1 1 1 1
NHB 11.48 (2.76) <.0001 9.95 (1.57) <.0001 6.49 (1.41) <.0001 14.73 (2.38) <.0001 12.35 (1.78) <.0001
Others 3.10 (3.78) 0.41 -3.74 (2.24) 0.09 -3.65 (2.17) 0.08 -4.47 (2.54) 0.07 0.54 (2.72) 0.84
Model 2 by GFR, ml/min/1.73m2
eGFR: <30
NHW 1 1 1 1 1
NHB 3.86 (5.37) 0.47 5.53 (3.98) 0.17 2.35 (3.04) 0.44 6.53 (5.20) <0001 12.35 (1.78) <0001
Others -6.22 (8.92) 0.45 -8.56 (3.62) 0.01 -11.77 (5.05) 0.01 -11.76 (7.75) 0.07 0.54 (2.72) 0.84
eGFR: 30-55
NHW 1 1 1 1 1
NHB 11.90 (2.61) <.0001 8.78 (1.86) <.0001 7.03 (1.62) <.0001 18.79 (2.83) <.0001 12.35 (1.78) <.0001
Others 5.15 (4.33) 0.24 -2.31 (3.14) 0.45 -0.07 (2.69) 0.98 -1.51 (3.46) 0.07 0.54 (2.72) 0.84
eGFR: 60-70
NHW 1 1 1 1 1
NHB 24.97 (11.88) 0.048 23.42 (6.19) 0.001 7.45 (7.48) 0.32 5.23 (6.33) 0.41 21.08 (7.73) 0.01
Others 11.59 (16.63) 0.48 1.61 (14.20) 0.90 -17.22 (16.45) 0.22 2.99 (19.18) 0.87 -0.54 (14.35) 0.97
Note: Model 1 is adjusted for age, a quadratic term for age, sex, socioeconomic status (assessed by education: <High Sch, HS, Associate degree vs ≥college), and eGFR.
Model 2 is adjusted for age, a quadratic term for age, sex and SES and stratified by eGRF.
NHW: non-Hispanic white, NHB: non-Hispanic black, Others: all other race/ethnicity groups.; eGFR: estimated glomerular filtration rate. OLS: Ordinal least squares regression.
The reported percent (%) = 100*(exponentiated regression coefficient -1), which is interpreted as % change in CVDRisk score for the comparison versus reference group.
compare the results from quantile regression, we repeated the analysis with the same set of variables using OLS regression that only estimates an average level of the risk score for the risk of the study outcome5-7. In the analysis, age (years) and a
quadratic term for age were adjusted by taking account of a non-linear relationship between age and CVDRisk score5-7.
Stratification analyses for eGFR (20-29.9, 30-55.9, and 60-70) were conducted to test the differences in CVDRisk scores by race/ethnicity.
Finally, to estimate the impact of elevated CVDRisk score on CVD prevalence by race/ethnicity, odds ratios (ORs) of NHB versus NHW for prevalent CVD were estimated using logistic regression models with adjustment for age and sex (Model 1), and age, sex and CVDRisk score (Model 2). The % changes in ORs from Model 1 to Model 2 was used to evaluate this impact using formula (OR1-OR2)/(OR1-1)*100, where OR1 is the odd ratio for prevent CVD in NHB versus NHW in Model 1, and OR2 in Model 2, and OR1-1 is the excess odds for prevalent CVD in NHB compared with NHW 21-23 .
All data analyses were conducted using SAS software version 9.2 (SAS Institute, Cary, NC).24 A two-sided p value ≤0.05 was
considered as having statistical significance.
Results
Characteristics of participants
Of the total study sample (Table 1), NHW had the highest mean (±SD) age (58.6 ± 11.2), followed by NHB (58.1±10.6), and the other race/ethnicity group (56.7±11.6). Overall, NHB had a higher CVD risk profile than NHW and the other race/ethnicity group. The prevalence of subjects with CHF, stroke and the total CVD were significantly higher in NHB than NHW.
CVDRisk score by race/ethnicity and individual CVD
risk factors
Means (SD) of CVDRisk score were 12.6 (6.1) in NHW, 14.6(6.4) in NHB, and 13.0 (5.6) in all other race groups (mean difference
by race, p<0.01). Figure 1 shows that subjects with CVD risk factors had significantly higher mean CVDRisk scores than those without these risk factors.
Quantile Distribution of CVDRisk score by race/
ethnicity and age
Table 2 shows that in the total study sample (Model 1 and Fig 2, A), NHB had 14.73% higher (worse) CVDRisk score than NHW in Q4, followed by 11.48%, 9.95%, and 6.49% in Qs 1, 2 and 3 respectively (p<0.001).
In stratification analysis by eGFR (Model 2), NHB had different higher CVDRisk scores across all Qs (Fig 2, C) in those with moderate CKD (eGFR 30-55.9 ml/min/1.73m2) and in those with mild CKD (eGFR 60-70 ml/min/1.73m2) in Qs 1 and 2 (Fig 2, D) than NHW. Results of OLS regression models, however give only an average estimate of the differences in CVDRisk scores. It shows that NHB had 12.35% higher CVDRisk score than NHW in the total sample, and 21.08%, 11.75% and 7.4% higher in those with mild, moderate and severe CKD (eGFR 20-30 ml/ min/1.73m2) when compared against their NHW counterparts respectively (Table 2, OLS regression and Fig 2, E).
There were no statistically significant differences in CVDRisk scores for all other race groups versus NHW using OLS regression analysis. However, among them, subjects with severe CKD had significantly lower CVDRisk scores in Qs 2 and 3 than their NHW counterparts using quantile regression analysis by eGFR status (Table 2, and Fig 2, B).
In logistic regression analysis, the odd ratio (95%CI) of NHB versus NHW for prevalence of CVD was 1.53 (1.32-1.77, p<0.001) after adjustment for age and sex (Model 1), and was 1.34 (1.15-1.55, p<0.001) after adjustment for age, sex and CVDRisk score (Model 2), a 35.8% reduction [(1.53-1.34)/(1.53-1)]. In other words, an estimated 35.8% of excess prevalence of CVD in NHB versus NHW could be explained by the differences in CVDRisk score. No statistical differences were observed between NHW and the other race group (p>0.05).
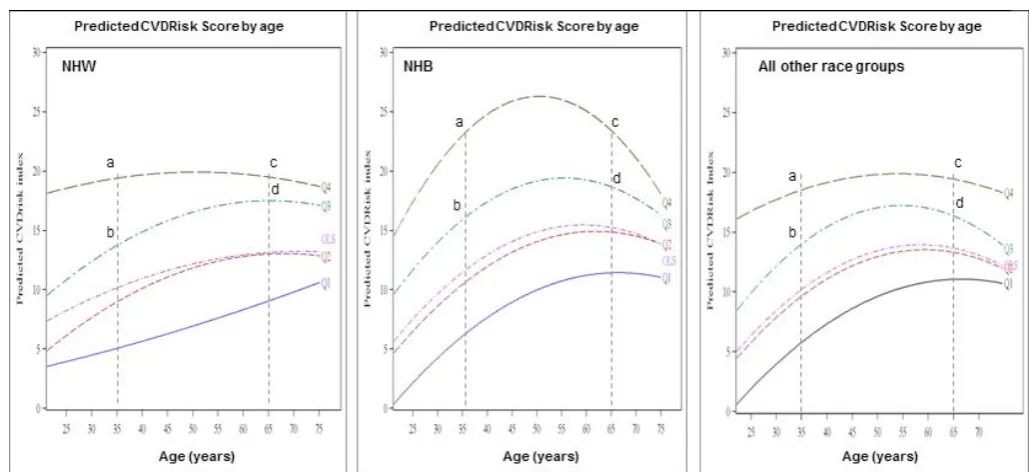
Figure 3 depicts the disproportionate distributions of participants by quantiles of CVDRisk scores and by race/ ethnicity across ages. While the curves across age for OLS are similar to Q2 (i.e., P 0.50), results from quantile regression show that the proportion of subjects who are in each quantile are huge differences by race and ethnicity across ages. For example, the CVDRisk scores ranged between 20 and 25 in Q4 for NHB, while it ranged between 15 and 20 in Q4 for NHW aged 35-65 (also as shown a larger proportion of subjects who are included in the region bounded by points a, b, c and d for NHB).
Discussion
The study extends previous studies by providing more details of the distributions of CVDRisk factors in subgroups of NHB versus NHW, and other race/ethnicity groups. The main findings are (1) NHB had significantly higher (worse) CVDRisk scores across all quantiles than NHW. (2) The differences in CVDRisk scores in NHB versus NHW were significantly higher in those at mild and moderate CKD stages. (3) An estimated 35.8% of the excess prevalence of CVD in NHB would be attributable to the elevated CVDRisk score in NHB versus NHW.
Several studies have observed an excess CVD prevalence and mortality in NHB versus NHW2, 9, 17, 25, 26. However, little
is known whether this excess CVD risk is disproportionately distributed in patients with CKD5-7. Findings from the present
study suggest that the excess risks for CVD in NHB versus NHW are different in patients with different stages of CKD by race/ethnicity. Using quantile regression analysis technique has been reported in Gebregziabher and colleagues’ study. They used data from a cohort of 11,272 veterans with type 2 diabetes (T2DM), and observed that NHB with T2DM had significantly lower medication adherence rate across all quantiles of the medication adherence score than NHW5, 6. In
Liu and colleagues’ study, using data from National Health and Nutrition Examination Survey (NHANES), and the Health and Retirement Survey, they observed that higher education attainment (a marker of socioeconomic status) was associated with lower coronary heart disease risk index across all quantiles of Framingham risk score (FRS).5 These previous studies contributed to the literature of the body on individual CVD risk factors. Our present study extends the previous studies by applying a sum weighted CVDRisk score and testing its distribution and relation to prevalence of CVD in patients with CKD. The sum weighted CVDRisk score provides meaningful evidence for disease control, because a prevention strategy and practice is most commonly done by preventing a group of CVD risk factors, instead of an individual one. In the study, we also tested the distributions of FRS and its association with CVD prevalence, and similar results to the present study were observed. In the report, we presented data using our created weighted CVDRisk score, because it included more well-established CVD factors in the sum score than FRC. The present study has several advantages. First, the study used data from CRIC Study, a well designed study coordinated by the National Institute of Diabetes and Digestive and Kidney Diseases3, 10. Second, in addition to the use of conventional
analysis approach (i.e., OLS regression analysis), the present study is the first to examine the distributions of multiple CVD
risk factors using a sum weighted CVDRisk score, which takes into consideration of the relative impacts of individual factors on the study outcome15-17. Third, the present study highlights
that NHB with mild and moderate CKD have higher CVDRisk factors than NHW. These findings address the importance that a stronger effort of CVD prevention CVD is needed in NHB versus NHW. The study did not observe significant differences in CVDRisk score in CKD patients with eGFR 20-29.9 ml/min/1.73m2 between NHB and NHW. Although further
studies are needed, this finding may suggest that CVD risks are the same in patients with serious CKD between NHB and NHW. Meanwhile, it should be noted that the present study has several limitations. First, the analysis used the baseline survey data of the CRIC Study. Therefore, it is not necessarily to interpret the findings of the CVDRisk score and CVD prevalence as a cause – effect association. Second, baseline measurements of CVD risk factors were conducted once only in the CRIC Study, bias due to time-varying may have occurred. Further longitudinal studies with dynamic measurements of predictor are needed to confirm the present findings.
In conclusion, despite the aforementioned limitations, using Qreg analysis models, we are able to identify higher risk groups of CVD in details as compared to the use of conventional analysis approaches. NHB who had mild or moderate CKD had significantly higher risk of CVD than their NHW counterparts. Given the limited healthcare resource and an increasing in CKD at population level, greater efforts for reducing CVD health disparity must be made for those who are at higher risk of CVD across the different spectrum of CKD.
Acknowledgements
The Chronic Renal Insufficiency Cohort (CRIC) Study was conducted by the CRIC Study investigators and supported by the National Institute of Diabetes and Digestive and Kidney Diseases (NIDDK). The data from the CRIC Study reported here were supplied by the NIDDK Central Repositories. This manuscript was not prepared in collaboration with Investigators of the CRIC Study and does not necessarily reflect the opinions or views of the CRIC Study, the NIDDK Central Repositories, or the NIDDK. Dr. Xiaoyan Yin, MD, from the Department of Endocrinology, the University Of Pennsylvania School Of Medicine, offered invaluable comments and suggestions for the manuscript.
Financial Disclosure: None.
Address for correspondence:
Longjian Liu, MD, PhD, MSc, FAHA
Department of Epidemiology and Biostatistics Drexel University School of Public Health Nesbitt Hall, 5th FL, Room 515
3215 Market Street, Philadelphia, Pennsylvania 19104 Tel: 267-359-6049 | Fax: 267-359-6201
References:
1. Herzog CA, Asinger RW, Berger AK, Charytan DM, Diez J, Hart RG, Eckardt KU, Kasiske BL, McCullough PA, Passman RS, DeLoach SS, Pun PH, Ritz E. Cardiovascular Disease in Chronic Kidney Disease. A Clinical Update from Kidney Disease: Improving Global Outcomes (KDIGO). Kidney Int 2011;80:572-586.
2. Kabadi SM, Lee BK, Liu L. Joint Effects of Obesity and Vitamin D Insufficiency on Insulin Resistance and Type 2 Diabetes: Results from the NHANES 2001-2006. Diabetes Care 2012;35:2048-2054.
3. Lash JP, Go AS, Appel LJ, He J, Ojo A, Rahman M, Townsend RR, Xie D, Cifelli D, Cohan J, Fink JC, Fischer MJ, Gadegbeku C, Hamm LL, Kusek JW, Landis JR, Narva A, Robinson N, Teal V, Feldman HI, Chronic Renal Insufficiency Cohort (CRIC) Study Group. Chronic Renal Insufficiency Cohort (CRIC) Study: Baseline Characteristics and Associations with Kidney Function. Clin J Am Soc Nephrol 2009;4:1302-1311.
4. Levey AS, Atkins R, Coresh J, Cohen EP, Collins AJ, Eckardt KU, Nahas ME, Jaber BL, Jadoul M, Levin A, Powe NR, Rossert J, Wheeler DC, Lameire N, Eknoyan G. Chronic Kidney Disease as a Global Public Health Problem: Approaches and Initiatives - a Position Statement from Kidney Disease Improving Global Outcomes. Kidney Int 2007;72:247-259.
5. Liu SY, Kawachi I, Glymour MM. Education and Inequalities in Risk Scores for Coronary Heart Disease and Body Mass Index: Evidence for a Population Strategy. Epidemiology 2012;23:657-664.
6. Gebregziabher M, Lynch CP, Mueller M, Gilbert GE, Echols C, Zhao Y, Egede LE. Using Quantile Regression to Investigate Racial Disparities in Medication Non-Adherence. BMC Med Res Methodol 2011;11:88.
7. Kim MO, Yang Y. Semiparametric Approach to a Random Effects Quantile Regression Model. J Am Stat Assoc 2011;106:1405-1417.
8. Liu L, Chen M, Hankins SR, Nunez AE, Watson RA, Weinstock PJ, Newschaffer CJ, Eisen HJ, Drexel Cardiovascular Health Collaborative Education, Research, and Evaluation Group. Serum 25-Hydroxyvitamin D Concentration and Mortality from Heart Failure and Cardiovascular Disease, and Premature Mortality from all-Cause in United States Adults. Am J Cardiol 2012;110:834-839.
9. Liu L, Liu Z, Ma M, Xue F and Sorel E. The Cardiometabolic Syndrome and Risk of Mortality from Cardiovascular Diseases and all Causes among African Americans and White Americans. JCMD 2012;3:1-9.
10. Feldman HI, Appel LJ, Chertow GM, Cifelli D, Cizman B, Daugirdas J, Fink JC, Franklin-Becker ED, Go AS, Hamm LL, He J, Hostetter T, Hsu CY, Jamerson K, Joffe M, Kusek JW, Landis JR, Lash JP, Miller ER, Mohler ER,3rd, Muntner P, Ojo AO, Rahman M, Townsend RR, Wright JT, Chronic Renal Insufficiency Cohort (CRIC) Study Investigators. The Chronic Renal Insufficiency Cohort (CRIC) Study: Design and Methods. J Am Soc Nephrol 2003;14:S148-53.
11. Stevens LA, Coresh J, Greene T, Levey AS. Assessing Kidney Function--Measured and Estimated Glomerular Filtration Rate. N Engl J Med 2006;354:2473-2483.
12. Grundy SM, Cleeman JI, Daniels SR, Donato KA, Eckel RH, Franklin BA, Gordon DJ, Krauss RM, Savage PJ, Smith SC,Jr, Spertus JA, Costa F, American Heart Association, National Heart, Lung, and Blood Institute. Diagnosis and Management of the Metabolic Syndrome: An American Heart Association/National Heart, Lung, and Blood Institute Scientific Statement. Circulation 2005;112:2735-2752.
13. Liu L, Nettleton JA, Bertoni AG, Bluemke DA, Lima JA, Szklo M. Dietary Pattern, the Metabolic Syndrome, and Left Ventricular Mass and Systolic Function: The Multi-Ethnic Study of Atherosclerosis. Am J Clin Nutr 2009;90:362-368.
14. Mujahid MS, Diez Roux AV, Morenoff JD, Raghunathan TE, Cooper RS, Ni H, Shea S. Neighborhood Characteristics and Hypertension. Epidemiology 2008;19:590-598.
15. Elkind MS, Ramakrishnan P, Moon YP, Boden-Albala B, Liu KM, Spitalnik SL, Rundek T, Sacco RL, Paik MC. Infectious Burden and Risk of Stroke: The Northern Manhattan Study. Arch Neurol 2009.
16. Anand SS, Razak F, Davis AD, Jacobs R, Vuksan V, Teo K, Yusuf S. Social Disadvantage and Cardiovascular Disease: Development of an Index and Analysis of Age, Sex, and Ethnicity Effects. Int J Epidemiol 2006;35:1239-1245.
17. Liu L. Social Connections, Diabetes Mellitus, and Risk of Mortality among White and African-American Adults Aged 70 and Older: An Eight-Year Follow-Up Study. Ann Epidemiol 2011;21:26-33.
18. Liu L, Newschaffer CJ. Impact of Social Connections on Risk of Heart Disease, Cancer, and all-Cause Mortality among Elderly Americans: Findings from the Second Longitudinal Study of Aging (LSOA II). Arch Gerontol Geriatr 2011;53:168-173.
19. Liu L, Nunez AE, Yu X, Yin X, Eisen HJ, for Urban Health Research Group. Multilevel and Spatial-Time Trend Analyses of the Prevalence of Hypertension in a Large Urban City in the USA. J Urban Health 2013;90:1053-1063.
20. Cornell University. StatNews #83: Interpreting coefficients in regression with log-transformed variables, http://www.cscu.cornell.edu/news/statnews/ stnews83.pdf. Accessed on July/7, 2013.
21. Liu L, Miura K, Fujiyoshi A, Kadota A, Miyagawa N, Nakamura Y, Ohkubo T,
Okayama A, Okamura T, Ueshima H. Impact of Metabolic Syndrome on the Risk of Cardiovascular Disease Mortality in the United States and in Japan. Am J Cardiol 2014;113:84-89.
22. Reis JP, Michos ED, von Muhlen D, Miller ER,3rd. Differences in Vitamin D Status as a Possible Contributor to the Racial Disparity in Peripheral Arterial Disease. Am J Clin Nutr 2008;88:1469-1477.
23. Liao Y, Greenlund KJ, Croft JB, Keenan NL, Giles WH. Factors Explaining Excess Stroke Prevalence in the US Stroke Belt. Stroke 2009;40:3336-3341. 24. SAS Institute Inc. SAS/STAT User’s Guide. SAS Institute Inc.: Cary, NC,
2008.
25. Long Y, Gracely EJ, Newschaffer CJ, Liu L. Analysis of the Prevalence of Cardiovascular Disease and Associated Risk Factors for European-American and African-American Populations in the State of Pennsylvania 2005-2009. Am J Cardiol 2013;111:68-72.