International Journal Advances in Social Science and Humanities
Available Online at: www.ijassh.com
RESEARCH ARTICLE
Madalena Maria Schlindwein et. al.| March 2017| Vol.5|Issue 3|11-26 11
Electricity Cogeneration from Sugarcane Bagasse in Mato Grosso
Do Sul, Brazil
Lizandra Duarte da Silva
1, Madalena Maria Schlindwein
2*, Paulo Sérgio
Vasconcelos
2Alexandre S. Corrêa
21Federal University of Sergipe - Academic Program of Postgraduation in Economics (NUPEC).
2Federal University of Grande Dourados - School of Business Administration, Accountability and Economics (FACE) Mato Grosso do Sul, Brazil.
*Corresponding Author: Madalena Maria Schlindwein
Abstract
This paper presents the result of a study on bioelectricity cogeneration, using as input bagasse from sugarcane produced by mills in the State of Mato Grosso do Sul (MS), Midwestern Brazil. It was analyzed the evolution of sugarcane agribusiness and bioelectricity cogeneration in the MS State between years 2005 and 2015. The planted areas and yields showed significant expansion. The main findings were the increased production of sugarcane at 440.48% and the planted areas at 387.35% during the observed period (2005 - 2015). As a result, the MS State currently represents 8.04% of the total sugarcane production in Brazil, accounting for 7.54% of the Brazilian planted area for sugarcane. The electricity cogeneration from sugarcane bagasse also presented a significant growth in the MS State. The cogeneration activity started from the 2009/2010 season and increased at 830.20% by the 2014/2015 harvest period. In 2014, the electricity cogenerated by the sugarcane industry supplied 35.15% of the total energy demand in the MS State.
Keywords: Bioelectricity, Cogeneration, Sugarcane.
Introduction
Today, fossil fuels account for 85.0% of the global energy consumption, but a fall to 75.0% is predicted by 2035. Before that, their use will keep growing, but at a lower rate [1]. In 2012, the composition of the global energy mix was 31.4% oil, 29.0% coal, 21.3% natural gas, 10.0% biofuels and waste, 4.8% nuclear, 2.4% hydro and 1.2% other [2].
The International Renewable Energy Agency (IRENA) conducted a study for mapping
renewable energy sources by 2030. The study has showed that renewables represented 18.0% of the Total Final Energy Consumption in 2010, in which 9% represented the traditional biomass and the other 9% represented the modern renewables [3].
The Itaipu hydroelectric power plant does not have water reservoir, is on the Paraná River located on the border between Brazil and Paraguay. During years, it was the largest hydroelectric power plant in the world, but recently it was surpassed by the Chinese Three Gorges hydroelectric power plant.
Itaipu uses a large water volume from the Paraná River, without flooding large extent of riverside land. This is because it uses the own riverbed to store water and direct it to the turbines. Itaipu generates 20.0% of all electricity distributed in Brazil and 95.0% of all electricity consumed in Paraguay. Despite the low cost of electricity production and low environmental impact of hydroelectric power plant, high cost investments in construction are necessary.
The Brazilian environmental legislation makes it difficult to obtain environmental authorization to build new hydroelectric power plants with reservoirs [5]. With lower construction costs, hydroelectric power plants without reservoirs depend on the continuity of water flow in rivers during the year. When the water volume is reduced, in dry periods, there is not generation of enough electricity to meet the demand. Thus, the National System Operator (ONS) have to dispatch larger amount of thermoelectric power plants, increasing the cost of electricity production and thus making the Brazilian electricity mix less clean.In 2014, Brazil was the seventh country among the top ten that have invested in sustainable energ Wind power was the one that received greater incentives, followed by biofuels, which received $ 574 million for research and development [6].
Brazil is the largest producer of sugarcane in the world, so the bioenergy generated by sugarcane is the most prominent in the country [7]. In the 2015/16 season, the country produced 655.159 million tons of sugarcane in an area of 8.955 million hectares, with a productivity of 73163 kg / ha [8]. As a result, Brazil represented the largest world production with 20% of total production and 40% of global exports.
Following the EUA, Brazil is the second largest producer of ethanol and accounts for 20% of production and 20% of world exports.The Brazil´s potential for bioenergy is a competitive advantage over other countries. Brazil has favorable climate and large territory both for the “energy agriculture” and the “food agriculture”. Moreover, the environmental impact is low in many non-irrigated crops. This potential qualifies Brazil to lead the “energy agriculture” and the global bioenergy market [7].
Sugarcane production is expanding since 2007 in the MS State. In 2015, the MS State became the largest producer in Brazil when overtook the production of the PR State. With 22 plants in operation, the MS State processed 43.55 million tons of sugarcane only in the 2015/16 season. This volume was 4.95% higher than the last season and positioned the MS State to the highest growth rate in the South-Central region [9].
Today, MS is one of the Brazilian States that most advance in the use of sugarcane biomass for electricity cogeneration. In 2014, the MS State delivered 1879 GWh to the SIN (National
Interconnected System), which represented about 10% of the total cogenerated electricity in
Brazil. The MS´s cogeneration also increased at 23% in the 2014/15 season in relation to the previous season. In the 2015/16 season, the electricity cogeneration should reach 2405 GWh to a 28% increase in comparison with the 2014/15 season [9].
increase the share of thermoelectric power plants generation in the Brazilian electricity mix and expand the capacity of the SIN. The construction of new hydroelectric power plants was part of the EPE’s planning (Energy Planning Company). In 2014, another period of rainfall shortage occurred in the Southeast/Midwest regions, decreasing the hydroelectric power generation and increasing the electricity generation by thermoelectric power plants, causing a raise in the electricity production costs. In 2014, the SIN’s transmission lines had already been extended and improved, favoring the electricity transmission [10]
Few academic studies have been developed along with the increased sugarcane production and bioelectricity cogeneration in the MS State. Therefore, information on this region is scarce. The lack of information in the sugar and energy sector may reduce the attention of the authorities to promote and develop the sector in the MS State. Articles published in recent years, on the production of sugarcane in Brazil, were mainly developed in the State of São Paulo [111213 -14].
Within this context, the aim of this study was to analyze the energy cogeneration from sugarcane bagasse in the MS State along with the evolution of the sugarcane agroindustry between the years 2005 and 2015 and along with the evolution of the bioenergy use for cogeneration, between the years 2009 and 2015.In sequence, we will discuss some topics related to energy and economic development, bioelectricity generated with sugarcane bagasse, and the sugarcane industry in the world, Brazil and MS State.
Energy and Economic Development
The concept of economic development is closely linked to the concept of economic growth, but their meanings are different. While economic growth is measured quantitatively, development is measured qualitatively [15-16]. Therefore, it is essential to show the relation between economic development and energy. Gadelha and Cerqueira [17] conducted a casual analysis on the consumption of electricity and economic growth between the years 1952 and 2010. The authors concluded that energy is determinant for the economic growth of modern economies and that such growth can directly influence the economic development. According to the National Energy Planning for the year 2030, launched in 2007, Brazil was a reference concerning the relation between economic development and electricity consumption. During the twentieth century, Brazil´s economy developed significantly. Such development caused an increased demand for energy, explained by industrialization processes, demographic expansion, and increased urbanization across the country. Such reports show the influence of the increased energy supply on the development of countries, and the need of an increased supply for a sustainable growth [18].
The world energy matrix is moving to a new scenario, where the energy sources from oil are losing share for the energy sources from renewables. Januzzi and Swisher [19] stated that energy sources should not be considered inexhaustible, but the authors still considered that renewables are the sources used by man that do not significantly lose potential, since their short-term recuperation can be virtually guaranteed [20]. Moreover, the authors state that renewable sources cause minimal impacts on the environment in comparison with the non-renewable sources.
Given the climate changes, nations are increasingly concerned about the need to preserve their environments as well as the importance of using alternative, sustainable and renewable sources of energy. In 1987 the sustainability concept became more popular. The Brundtland Commission’s Report defined sustainable development as “the development which meets the needs of current generations without compromising the ability of future generations to meet their own needs"[21].
to support economic development, make energy more available and secure, and avoid climate changes as well as environmental and health problems caused by air pollution.
In Brazil, many policies have been adopted to create renewable energy incentives, ensure the energy supply and consequently keep the country like “the largest producer of clean energy”. The regulatory framework in the country for incentives in renewable energy was given by the Law No. 10438 of 26 April 2002, which created the Alternative Energy Sources Incentive Program (PROINFA). The Program aimed to increase the electricity generations from wind power, small hydroelectric power plants and thermoelectric power plants with the biomass use. The first main goal was to work with a 3,300 MW capacity through electric energy sources encouraged by the program. The purpose was to diversify the Brazilian electricity mix to avoid lack of power energy supply, reduce carbon emissions and develop Brazilian regions, creating jobs and providing manpower training [22].
Electricity Generated with Biomass From Sugarcane
There are many alternative sources of electricity; Murphy Jr. [23] classified some types as possible substitutes for fossil fuels. They are: Photovoltaic Solar Energy, Solar Thermal, Hydropower, Biofuels; Algae, Geothermal; Electricity, Wind Power, Artificial Photosynthesis, Tidal Energy, Conventional Fission Reactor, Uranium Reactor, Thorium Reactor, Geothermal; Depletion, Geothermal; Heating.
Among various renewable electricity sources, the electricity generated by biomass has shown notable expansion. Hinricks; Kleinbach; Reis [20] describe the sources of bioenergy and the ways they can be used to produce electricity and heat.
Electricity obtained from sugarcane mills is generated from bagasse, which is the residue of sugar and alcohol production. It means, therefore, that electricity is cogenerated in a highly efficient way because uses a renewable residue as input [24]. The electricity production yield is directly related to the amount of available biomass. The greater the production of sugarcane, the greater the capacity of this sector to co-generate electricity [5].
The sale of bioelectricity through the country's electric distribution network is made by auctions. The first renewable energy auction in Brazil was made in 2005 in the city of Rio de Janeiro. In 2010, the cogenerated bioelectricity obtained from sugarcane represented more than 2% of the national consumption of electricity, enough to supply 5 million homes in one year. Although the surprising results, Brazil has a huge untapped potential, equivalent to the electricity generation of three plants with hydroelectric capacity similar to the Belo Monte plant [25].
The Sugarcane Agribusiness in Brazil and in the World
Sugarcane is one of the most important crops in the world and is cultivated in more than one hundred countries. However, only ten countries account for 80% of the world production. They are, respectively, in descending order of importance: Brazil, India, China, Mexico, Thailand, Pakistan, Colombia, Australia, Indonesia, and United States of America. Together, Brazil and India account for more than half of all world production [26].
India, with 1.2 billion people, is the largest global sugar consumer. In 2015, India had 290 mills in operation. In the 2014/15 harvest, between October and February, its sugar production increased by 14% compared to the 2013/14 harvest, reaching a total of 19 million tons of sugar [27-28].
The sugarcane agroindustry is increasingly expanding in the Midwestern Brazil. This region, even though originally occupied in the sixteen century, had been a demographic void until 1970. Changes occurred due to the policies for agriculture modernization and occupation of
Cerrado areas, biome that cover most of the Brazilian Midwest [30].
Originally, the Brazilian Midwest economy was based on mining activities, with the exploration of precious metals. Posteriorly, farming and livestock were introduced in the region, followed by the food agroindustry, with processing of meat and grains and manufacture of animal feeds and fertilizers [31].
According to Castro [32], such expansion in the economy began with the opening of new large areas for soybean planting, activity that most occupied the lands of the Brazilian Midwest territory. Then, other crops were cultivated, like corn and bean. Recently, sugarcane started advancing in the region.
According to Andrade [33], the programs adopted from public policies allowed the sugarcane industry expanding across the Brazilian regions that had underutilized lands. So, the Midwest region, originally with an inexpressive sugarcane production, became a large producer, as a result of the use of public incentives.
Within this context, the advance in the sugarcane production in the Midwest region is still recent when compared with the Brazil’s sugarcane advances as a whole. However, this situation did not diminish its importance to the country; the region holds two of the four principal sugarcane regions in Brazil - The Goiás State and the MS State [31].
Although the São Paulo State is the greatest Brazilian producer, in the Midwest, the growth rate calculated for the sugarcane sector between 2003 and 2012 significantly surpassed the growth rate of the São Paulo State, which showed an 83.6% growth in the planted area and an 8.3% annual average for the studied period. On the other hand, the MS State presented a 363.5% growth in the planted area with a 20.4% annual average, while the GO State showed a 336.2% growth in the sugarcane planted area. Respectively, both States are the most productive in the Midwest region [34].
According to Shikida [31], several factors can promote the sugarcane expansion in the Midwest region, such as, food and energy security, saturation of traditional areas, favorable climatic conditions for the sugarcane crop, large farming lands, fertile and arable lands used only for extensive livestock, etc.
Based on theories described by diverse authors about sugarcane industry in Brazil and in the world, it can be concluded that Brazil is the biggest sugarcane producer in the world. Besides, Brazil has available lands and a huge potential to expand its production even more. The Midwest region have expanded its agricultural lands and increased its participation on the Brazilian sugarcane production. The trend in the region is increasingly expanding such production.
The Sugarcane Agroindustry in the State of Mato Grosso do Sul (MS)
Studying the expansion of the sugarcane industry in the MS State, Castilho [36] demonstrated that the sugar-ethanol production facilities have expressively increased in number with the presence of the PROALCOOL in the State.
In the 1979/80 season only two sugarcane mills were operating in the MS State. In the 1983/84 season, the number of sugarcane mills in operation had increased to nine. From this period to the 2007/08 season, the number of sugarcane mills was maintained at ten. But from the 2008/09 season on, there was a breakthrough in the construction of new production units, reaching fourteen units in this season and twenty four units in the 2013/14 season. So, given the increased production of sugar and ethanol, the MS State became a supplier in both domestic and international market.
In 2000, the MS State accounted for 23.8% of the total sugarcane production in the Midwest. In 2012, its production share in the Midwest was 33.34%, representing a 39% increase. So, in this analyzed period, the share of the MS State in the total domestic production increased at 192.56%, growing from a rate of 1.79% in 2000 to 5% in 2012 [37].
Electricity Obtained from Biomass in the World, Brazil and MS State
The world electricity production by alternative sources (geothermal, wind, solar, tidal, wave, biomass and waste) presented positive variation within the period from 1980 to 2011. The alternative sources that increased in use were, respectively, the solar energy and the energy originated from biomass and waste. In 1980, their use accounted only for 0.2% of all energy sources and in 2011 accounted for 1.7%. The world energy matrix is becoming diverse. The Middle Eastern countries increased its electricity generation at 89.0% through alternative sources, followed by Asia and Oceania at 40.0%, Europe at 18.50%, North America at 16:50%, Eurasia at 14.60%, South and Central America at 6.90% and Africa at 6.80%. Europe has showed the greatest share in the world’s electricity production by alternative sources, accounting for 42.2%, followed by North America with 26.20% share, Asia and Oceania with 24.50%, South and Central America with 5.70%, Africa with 0.70%, Eurasia with 0.60%, and the Middle Eastern countries with only 0.1% share (although with the highest increase rate of the alternative sources) according to EPE [38].
The electricity produced from biomass has expressively increased. Sugarcane has been considered the most appropriate biomass for bioelectricity cogeneration, among other possibilities. Sugarcane is more feasible due to its high efficiency in converting light and water to green matter and in utilizing two thirds of the plant energy retained in the straw and bagasse, previously considered as waste [39]. The sugarcane bagasse represents 25-30% of the product’s weight and is processed at 50% humidity. In the beginning, it was used to produce thermal power for the plants’ production processes, instead of using firewood. Posteriorly, the bagasse was used to generate electricity, also consumed by the mills’ production processes [40]. In the South America, there is great potential to bioelectricity production from the sugarcane biomass due to the vast territory between tropics. The main crop producers in the Southern Cone are Brazil (the top sugarcane producer in the world), Argentina, Bolivia, Colombia, Ecuador and Peru. In Brazil, the sugarcane harvest begins in April at the Southeast / Midwest regions, which is the period of drought in most areas of South America. In this period, the electricity cogeneration complements the country demand needs [10]. Brazil is the only country that projects expanding the electricity cogeneration by the sugarcane industry, what would increase the security of the national electric system [41].
represents 50% of all investments in electricity directed to the MS State. In 2015, the MS was the eight Brazilian State in capacity of electricity cogeneration from bagasse, with 6.55% representation. Within the Midwest region, it is the leader with a 9.051 TW electricity capacity [45].
In the 2013/14 season, the MS State cogenerated 1,292 TWh to the national electric system, which represented a 17% increase in comparison with the previous season. The MS State was, in percentage terms, the leader in sugarcane processing for bioelectricity cogeneration in the country.
Such expansion in the use of sugarcane bagasse for electricity cogeneration has been cause for celebration, since bagasse was previously considered an environmental pollution issue to be solved by the State [46].
Aranha et al. [47] figured out that the electricity cogeneration from the sugarcane biomass is sustainable in the MS State in the contexts of economy, social development and environment. In the 2013/14 season, the MS State had an 89% mechanical harvesting rate, a value that was superior to the legal rate of 50%. So, only 11% of the harvested area was made by straw burning. Such mechanization level is socially sustainable as the labor in insalubrious work conditions is reduced. With the cogenerated bioelectricity, the increase in jobs and marginal revenue totaled R $ 288.9 million in the 2013/14 season.
Material and Methods: Research Techniques, Study Area and Data Source
In 2015, the MS State in the Brazilian Midwest region had an estimated population of 2,651,235 inhabitants and an average monthly income of R$ 1,053.00. The MS State is divided into 79 municipalities and the capital is Campo Grande. Its area corresponds to 357,145.534 km² and the population density is 6.86 inhabitants /km² ([48].According to the Secretary of State for Environment and Economic Development [49], the sugar-energy industry is the third biggest employer within the MS State, offering about 30,000 direct jobs and at least 90,000 indirect jobs.
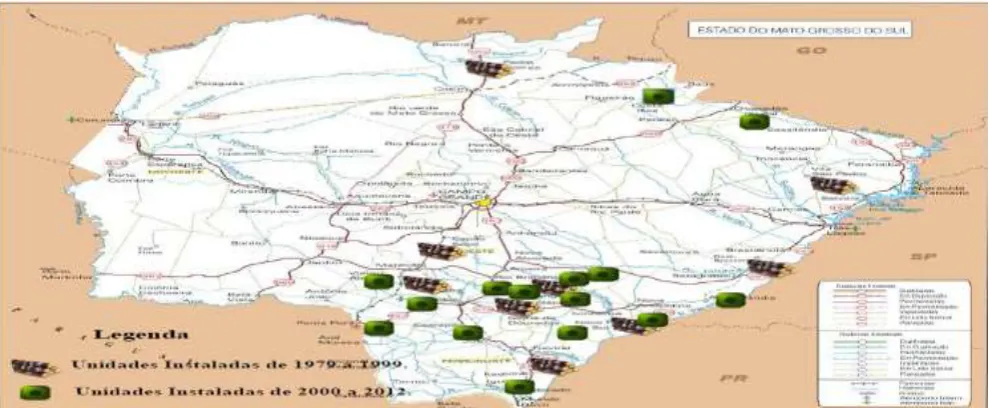
In the MS State, the main municipalities that generated jobs in the first half of 2015 were, in descending order: Angélica, Nova Andradina, Rio Brilhante, Maracaju, Costa Rica and Chapadão do Sul. All these six municipalities have sugarcane processing plants [50].
The Figure 01 presents a map that displays the sugarcane processing plants in the MS State installed between 2000 and 2013.
Figure 01: Map of the sugarcane processing plants in the MS State installed between 2000 and 2013.
It is possible to observe in the Figure 01 that the majority of the sugarcane plants are located at the South Central region of the MS State. Most of them were installed between years 2000 and 2013. In order to develop this work, we searched sources like the MS Producers Association (BIOSUL), Bioenergy Producers Union (UDOP), Program of Incentives for Alternative Electricity Sources (PROINFA), National Supply Company (CONAB), National Energy Balance (BEN), National Electric Energy Agency (ANEEL), Ministry of Agriculture Ministry of Agrarian Development (MDA), Sugarcane Industry Association (UNICA) and Scientific Journals.
The evolution of the sugarcane planted area and the bioelectricity production was made by internet data searching, books’ information and literary survey. In order to analyze the perspective of growth in the bioenergy sector in the MS State, it was conducted a sector analysis along with a descriptive analysis of rules and government policies to encourage the industry.
The analyzed variables were the production of sugarcane and bioenergy in the MS State between years 2005 and 2015. Data were displayed in tables and graphs with their respective analyzes.
Results and Discussion
Data are firstly discussed for sugarcane agroindustry evolution in the MS State. Then, the electricity cogeneration from sugarcane bagasse is characterized. Finally, the production cost of electricity cogeneration from sugarcane is shown and discussed.
Evolution of the Sugarcane Agroindustry in the MS State
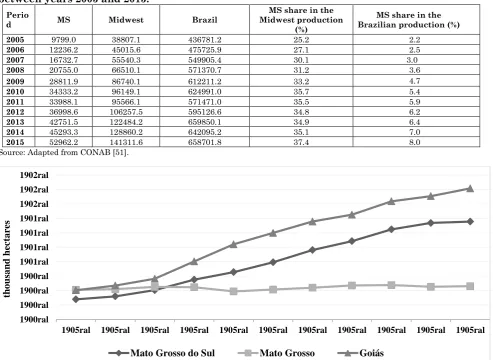
Figure 02 – Production in 1000 tons of sugarcane in the States of the Midwest region between years 2005 and 2015.
Source: Adapted from CONAB [51].
The sugarcane production in the Mato Grosso do Sul (MS) State showed an expressive growth in the period from 2005 to 2015 (Figure 02). From the public incentives, the MS’s production increased at 440.48% in the studied period, the highest growth found among all States of the Midwest region. The Goiás (GO) State increased its production at 358.75% and the Mato Grosso (MT) State presented a small growth compared to the other mentioned States, that was, 26.47%.
The main driver of such increased sugarcane production in the MS State, between years 2005 and 2015, was the set of public incentives, especially PROALCOOL. Although extinct in the analyzed period, it was the foundation for beginning the production expansion. Other factors are the favorable climatic conditions, soil aptitude, geographic location, etc.
The sugarcane production growth in the MS State, between 2005 and 2015, was superior to the production growth in the Midwest region and in Brazil for the same period. In the MS State,
1900ral 1927ral 1954ral 1982ral 2009ral 2036ral 2064ral 2091ral 2119ral
1905ral 1905ral 1905ral 1905ral 1905ral 1905ral 1905ral 1905ral 1905ral 1905ral 1905ral
tho
us
a
nd
t
o
ns
the production increased at 440.48%, from 9,799 to 52,962.2 tons. In the Midwest, the production increased at 264.14%, from 38,807.1 to 141,311.6 tons of sugarcane. Brazil totaled a 50.81% increase in sugarcane production within the analyzed period (Table 01).
The MS State’s share in the Brazil production and in the Midwest production increased expressively between years 2005 and 2015. In 2005, the MS production represented 25.25% of the total Midwest production. In 2015, the MS State accounted for 37.48% of the Midwest sugarcane, that is, a 48.43% increase. In 2005, the MS sugarcane represented 2.24% of the total Brazilian production. In 2015, the State represented 8.04% of all sugarcane produced in Brazil, that is, an effective 258.82% growth.
Table 1: Amount of produced sugarcane (1000 tons) in the MS State, Midwest and Brazil between years 2005 and 2015.
Perio
d MS Midwest Brazil
MS share in the Midwest production
(%)
MS share in the Brazilian production (%)
2005 9799.0 38807.1 436781.2 25.2 2.2
2006 12236.2 45015.6 475725.9 27.1 2.5
2007 16732.7 55540.3 549905.4 30.1 3.0
2008 20755.0 66510.1 571370.7 31.2 3.6
2009 28811.9 86740.1 612211.2 33.2 4.7
2010 34333.2 96149.1 624991.0 35.7 5.4
2011 33988.1 95566.1 571471.0 35.5 5.9
2012 36998.6 106257.5 595126.6 34.8 6.2
2013 42751.5 122484.2 659850.1 34.9 6.4
2014 45293.3 128860.2 642095.2 35.1 7.0
2015 52962.2 141311.6 658701.8 37.4 8.0
Source: Adapted from CONAB [51].
Figure 03: Sugarcane planted area (1000 tons) in the Midwest’s States between years 2005 and 2015.
Source: Adapted from CONAB [51].
As a result of public incentives, the sugarcane area significantly expanded between years 2005 and 2015. In 2005, the MS’s planted area was 139.1 thousand hectares while in 2015 it expanded to 677.9 thousand hectares, representing a 387.35% increase (Figure 03). In 2005, the MS State had the smallest share in planted area within the Midwest region but presented the largest growth in the analyzed period, followed by the GO State with a 348.40% increase in planted area, and then by the MT State. The MT State had the largest share in planted area by 2005 with 205.5 thousand hectares but presented only a 12.12% increase, totalizing 230.3 thousand hectares of sugarcane in 2015.
The expansion of the MS's sugarcane planted area between years 2005 and 2015 was also significant when compared to the total planted area in Brazil, which in the same period had a 53.06% increase (Table 02).
1900ral 1900ral 1900ral 1900ral 1901ral 1901ral 1901ral 1901ral 1902ral 1902ral 1902ral
1905ral 1905ral 1905ral 1905ral 1905ral 1905ral 1905ral 1905ral 1905ral 1905ral 1905ral
tho
us
a
nd
hect
a
re
s
Table 2: Sugarcane planted area (1000 hectares) in the MS State, Midwest and Brazil between years 2005 and 2015.
Period MS Midwest Brazil MS share in the Midwest planted area
(%) MS share in the Brazil planted area (%)
2005 139.1 546.9 5877.2 25.4 2.3
2006 160.0 604.5 6188.6 26.4 2.5
2007 202.8 710.1 6963.6 28.5 2.9
2008 275.8 900.8 7010.2 30.6 3.9
2009 328.2 1042.7 7531.0 31.4 4.3
2010 396.1 1202.5 8033.6 29.5 4.9
2011 480.8 1379.4 8368.4 34.8 5.7
2012 542.7 1504.1 8520.5 36.0 6.3
2013 624.1 1680.3 8810.7 30.5 7.0
2014 668.3 1748.5 9004.5 38.2 7.4
2015 677.9 1816.2 8995.5 37.3 7.5
Source: Adapted from CONAB [51].
The MS share in the Midwest planted area had a 46.75% increase during the period from 2005 to 2015. The MS share in the Brazil planted area increased significantly from 2.37% in 2005 to 7.54% in 2015. Although apparently insignificant, it represents an effective growth of 218.40%. Being at the same time cause and effect, the increased sugarcane production and planted area as well as the sugar-ethanol production units, more than doubled in the analyzed period (Figure 04).
Figure 04: Number of sugar-ethanol production units in the MS State between years 2005 and 2015. Source: Adapted from [36-50].
In 2005 the MS State had ten sugar-ethanol production units and in 2015 this number increased to twenty four. Castilho [36] explains that it is consequence basically of environmental guidelines as well as public and private initiatives, which drive the expansion of some economical activities in the MS State, as the sugarcane agroindustry.
Electricity Production from Sugarcane in the MS State
Some sugar-ethanol plants in the MS State began their energy cogeneration from sugarcane bagasse in the 2009/10 season, although they were already auto sufficient in electricity and heat. From the starting point of electricity commercialization, the amount (GWh) of their cogenerated energy increased at 830.20% by the 2014/15 season (Figure 05). The MS State rapidly expanded their energy cogeneration from the sugarcane bagasse. In 2014, it was the third largest co-generator of bioelectricity in the country, supplying the national electricity market with 13.4% of all electricity cogenerated from biomass in Brazil [53].
Figure 05: Energy cogeneration evolution (GWh) from the sugarcane bagasse burning in the MS State. Source: Adapted from BIOSUL [53].
1900ral 1900ral 1900ral 1900ral 1900ral 1900ral
1900ral 1900ral 1900ral 1900ral
1900ral
1900ral 1900ral
1900ral 1900ral 1900ral 1900ral
Num
ber
o
f
pro
du
ct
io
n
un
it
s
Year
1900ral
1901ral
1106 1292
1517
1879
1900ral 1901ral 1902ral 1904ral 1905ral
2009/2010 2010/2011 2011/2012 2012/2013 2013/2014 2014/2015
G
W
h
According to ANEEL [55], in 2016 there were 23 bioelectricity cogeneration units using sugarcane bagasse in the MS State. They were distributed into sixteen municipalities (Table 03).
Table 3: Electricity cogeneration units using sugarcane bagasse in the municipalities of the MS State Municipalities Number of plants in operation Number of inhabitants *
Sidrolândia - MS 01 51355
Naviraí - MS 01 51535
Maracaju - MS 03 43078
Rio Brilhante - MS 03 34776
Aparecida do Taboado -MS 01 24414
Iguatemi - MS 01 15637
Nova Andradina - MS 02 50893
Nova Alvorada do Sul - MS 01 19656
Angélica - MS 01 10149
Ponta Porã - MS 02 86717
Costa Rica - MS 01 19508
Caarapó - MS 01 28437
Ivinhema - MS 01 22928
Chapadão do Sul - MS 01 22620
Vicentina - MS 01 6027
Dourados - MS 02 212870
Source: Adapted from ANEEL [56-48]. * Population estimated in 2015 by IBGE [48].
The MS’ sixteen municipalities totaled 1,089.847 kW of all electricity granted for the State in 2016. Five of them generated the most of the electricity: Rio Brilhante, Nova Alvorada do Sul, Ivinhema, Dourados and Angélica. The Rio Brilhante municipality, with three production units, stands out with 27.96% of all electricity granted for the MS State.
Figure 06: Electricity granted for the MS State produced by municipality, with electricity cogeneration from sugarcane bagasse (2016).
Source: Adapted from ANEEL [55].
The importance of the electricity cogenerated in the MS State for the National Electric System is evidenced when an increased cogeneration is observed between years 2010 and 2014 and compared with consumption per sector (Table 04). In 2010, the second year in which electricity was cogenerated from sugarcane bagasse in the MS State, about 660,000 KWh were delivered to the SIN. This amount was sufficient for supplying the rural demand of 408,443 MWh or all public energy demand (lighting, services, other) of 558,083 MWh in the MS State, in the same year.
Table 4: Electricity demand by sector (KWh) and bioelectricity cogeneration from sugarcane bagasse between years 2010 and 2014, in the MS State
Sector 2010 2011 2012 2013 2014
Bioelectricity production 660.000 1106.000 1292.000 1517.000 1879.000
Residential use 1237.873 1326.000 1451.000 1571.000 1753.000
Industrial 997.740 1053.510 1.152.727 1346.070 1236.451
Commercial 815.170 902.923 1014.739 1077.474 1193.837
Rural 408.443 429.027 455.893 464.420 496.889
Public entities 202.291 222.175 233.802 239.943 256.821
Street lighting 192.712 201.582 216.216 220.972 225.716
Public service 155.485 158.973 161.929 170.458 175.531
Others 7593 7517 7460 7310 7224
Source: Adapted from [53-56]
5360 12000 97400
304819
4200 4000 3200 134640
96000
22400
79828 98000 76000 120000
30000 2000 1900ral
2036ral 2173ral 2310ral 2447ral 2584ral 2721ral 2858ral
Po
w
er
(K
W
h
)
In 2014, the electricity cogenerated in the MS State was of 1879,000 KWh (Table 04). Such increased amount was enough to supply a residential consumption of 1753,000 KWh, registered in this year for the MS State. The electricity cogenerated in 2014 could also supply the sectors of industry, commerce, rural, public entities, street lighting, public services and others. These sectors totalized a consumption of 1162,181 MWh in the year 2014, so that, an amount of 7168,190 kWh cogenerated electricity could be spared.
Analyzing the total consumption of electricity between years 2010 and 2014 and its relation with electricity cogeneration from sugarcane bagasse in the MS State, it is observed that the supply was significantly higher in percentage than the demand in this period (Table 05). The electricity demand increased at 33.05% while the cogeneration by the sugarcane industry increased at 184% in the analyzed period.
Table 5: Total electricity consumption (GWh*) and electricity cogeneration from sugarcane bagasse in the MS State between years 2010 and 2014.
Year Total Consumption (Gwh) Bioelectricity production (Gwh)
2010 4017.00 660.00
2011 4302.00 1106.00
2012 4693.00 1292.00
2013 5097.00 1517.00
2014 5345.00 1879.00
Source: Adapted from [53-56]
*Gwh: 01 Gigawatt-hora (Gwh) is equal to 1.000.000 Quilowatt-hora (Kwh)
Bioelectricity from sugarcane: advantages, challenges and incentives
Analyzing the costs for energy generation in Brazil and comparing those with the costs for electricity cogeneration from sugarcane bagasse (Table 06), it is evidenced that the cogenerated electricity is more advantageous than other ways of electricity production. Among the renewable sources here analyzed, the biomass (sugarcane) presents the lowest cost of installation when compared with small hydroelectric plants. Such small plants show the highest cost of installation per each generated KWh and no improvement is expected in the next ten to fifteen years.
The levelized cost of electricity is used to compare different methods of electricity generation by assessing the average total costs per kilowatt-hour(KWh), with an error margin of 10%. Such costs include the initial capital, discount rate, as well as the costs of continuous operation, fuel, maintenance, etc. (WWF, 2012). The hydroelectric plants present the lowest levelized cost to produce each KWh (Table 06). On the other hand, their costs tend to increase in the next ten to fifteen years due to the location where these plants are installed, usually farther from the consumer center. In addition, the cost of installation is high when compared to the cost of
electricity cogenerated from the sugarcane bagasse.
Table 6: Comparison of costs for electricity generation in Brazil
Source/ Cost of installation
Levelized cost of electricity (R$/kWh) (10% margin of error)
Cost trend in the next 10-15 years
Source Cost of installation (R$/kWh) Lower
Hydroelectric plants 3450.00 60.63 101.35 Increase
Small hydroelectric plants 5000.00 112.47 161.96 Stabilize
Wind 3350.00 89.00 118.00 Decrease
Biomass (sugarcane) 3000.00 91.00 131.00 Decrease
Nuclear 3000.00 155.00 192.68 Increase
Natural gas in combined-cycle plants 3000.00 173.58* Decrease
National pulverized coal 2750.00 133.55* Stabilize
Among the renewable sources, the electricity generated from the sugarcane bagasse presented the lowest cost of installation per KWh (Table 06), but its levelized cost was not the lowest. Its costs should decrease in the next ten to fifteen years due to the development of the sector and new technologies. The nuclear energy has the same cost of installation as the sugarcane bagasse, but it is not a clean source of energy and its levelized cost per KWh is the highest. Its costs should increase in the next ten to fifteen years due to restrictions imposed to the use of nuclear energy and reduced trade of nuclear systems [57].
The main advantage of the use of electricity cogenerated from sugarcane bagasse in the MS State and Brazil is the period of sugarcane harvest coinciding with the dry season in Southeast / Midwest region, so that the electricity cogeneration can complement the production of hydroelectric power plants. In addition, the electricity cogeneration by the sugarcane industry contributes to the reduction of greenhouse gases (GHG), when directly compared to thermoelectric plants. The Brazilian sugarcane industry holds experience in energy cogeneration, creates and maintains employment and income in rural areas, encourages goods and capital industry with the acquisition of modern and efficient equipment and save foreign currency, since the import coefficient it is almost zero, due to the sector's maturity [58].
Conclusions
The main objective of this work was analyzing the electricity cogeneration from the sugarcane bagasse in the MS State, Midwest region and Brazil, considering the sugarcane industry development between years 2005 and 2015 and the bioelectricity cogeneration evolution between years 2009 and 2015. The sugarcane agroindustry, currently named sugar-energy industry, was studied considering the sugarcane production and planted area. It was observed a large expansion in both aspects. The MS State has an increased production at 440.48% during the analyzed period, so that the MS State represented 8.04% of the Brazilian sugarcane production at the end of the period. The MS’s planted area increased at 387.35% between 2005 and 2015 and represented 7.54% of the Brazilian area planted with sugarcane in 2015.
The electricity cogeneration from sugarcane bagasse in the MS State along with the sugarcane agroindustry also presented a significant evolution. The activities of electricity cogeneration started only in the 2009/10 season. Although this analyzed period was shorter, the electricity cogeneration increased at 830.20% between years 2010 and 2015. In 2014, the electricity cogeneration in the MS State was sufficient to supply 35.15% of its total electricity demand.
The electricity cogeneration from sugarcane bagasse is increasingly growing in the MS State along with the sugarcane agroindustry, which has been encouraged for policies toward diversification of the Brazilian energy matrix. In the A-5 2016 auction by ANEEL, the MS State takes part in thirteen registered projects generating an additional supply of 706 MWh of cogenerated electricity.
It was concluded that the sugarcane bagasse used to cogenerate electricity in the MS State, although recent, has presented significant expansion with a growth trend in the medium term. These results also imply that the government should expand and consolidate public incentives to encourage the adoption of this electricity source in the MS State, as already done successfully with the sugarcane agribusiness, early demonstrated in this study.
References
[1] BP ENERGY (2016) BP Energy Outlook 2035 mostra crescimento da demanda de energia global em menor ritmo, apesar dos
aumentos impulsionados pelas economias emergentes. Disponível em:
<http://www.bp.com/pt_br/brazil/sala-de-imprensa/noticias/press-release--outlook-2035.html>. Acesso em: 20 jan. 2016.
[2] IEA (2014) INTERNATIONAL ENERGY AGENCY. Key World Energy STATISTICS.Cedex: Iea,.Disponível em: <https://www.iea.org/publications/freepublications/publication/KeyWorld2014.pdf>. Acessoem: 28 jun. 2015.
[3] IRENA (2014) INTERNATIONAL RENEWABLE ENERGY AGENCY. remap 2030: A Renewable Energy Roadmap. Abu Dhabi. Disponível em: <http://www.irena.org/remap/REmap_Report_June_2014.pdf>. Acesso em: 28 jun. 2015.
[5]CASTRO, N. J.; BRANDÃO, R.; DANTAS, G. A (2009) Importância e perspectivas da bioeletricidade sucroenergética na matriz elétrica brasileira. ÚNICA, 2009.
[6] UDOP (2015a). União dos Produtores de Bioenergia. Brasil é o sétimo maior investidor em energia renovável. Disponível em: <http://www.udop.com.br/index.php?item=noticias&cod=1123941>. Acesso em: 04 abr. 2015.
[7] MAPA (2006) PLANO NACIONAL DE AGROENERGIA:2006 - 2011. Brasilia. Disponível em: <http://www.agricultura.gov.br/arq_editor/file/Ministerio/planos e programas/PLANO NACIONAL DE AGROENERGIA.pdf>. Acesso em: 25 nov. 2015.
[8] CONAB (2015a) Acompanhamento da safra brasileira:Cana de Açúcar. Brasília: Conab. Disponível em: <http://www.conab.gov.br/OlalaCMS/uploads/arquivos/15_12_17_12_15_58_boletim_cana_portugues_-_2o_lev_-_15-16.pdf>. Acesso em: 31 dez. 2015a.
[9] BIOSUL (2015a) Mato Grosso do Sul passa a ser o 4º maior Estado produtor de cana no Brasil.Disponível em: <http://www.biosulms.com.br/noticias/industria/mato-grosso-do-sul-passa-a-ser-o-4o-maior-estado-produtor-de-cana-no-brasil-95.html>. Acesso em: 21 maio 2015.
[10] VASCONCELOS, P. S.; CARPIO, L. G. T (2014) Estimating the economic costs of electricity deficit using input-output analysis: the case of Brazil. AppliedEconomics, 47:0, 916-927, DOI: 10.1080/00036846.2014.982858.
[11] BONOMI, A.; DIAS, M. O. S.; JUNQUEIRA, T. I.; CARDOSO, T. F.; CAVALETT, O.; FRANCO, H. C. J. et al. (2012) The virtual sugarcane biorefinery – 2011 report, Campinas.
[12] CASTRO, N. J.; BRANDÃO, R.; DANTAS, G. A. (2009) Importância e perspectivas da bioeletricidade sucroenergética na matriz elétrica brasileira. ÚNICA, 2009.
[13] CAVALETT, O.; JUNQUEIRA, T.; DIAS, M. S.; JESUS, C. F.; et al. (2012) Environmental and Economic assessment of sugarcane first generation biorefineries in Brazil. Clean Technological Environmental Policy, 14 p. 399-410. Elsevier.
[14] CHRISTOFOLETTI, C. A.; ESCHER, J. P.; CORREIA, J. E.; MARINHO, J. F. U.; FONTANETTI, C. S. (2013) Sugarcane vinasse: Environmental implications of its use. Waste Management 33 (2013) pp 2752-2761. Elsevier.
[15] SOUZA, N. J. (2007) Desenvolvimento econômico. 5. ed. São Paulo: Atlas, 2007.
[16] FAPESP (2007) academiabrasileira de ciência - inter academy councilUm futuro com energia sustentável: iluminando o caminho. Rio de Janeiro.Tradução do reletório: Lighting the way: Toward a sustainable energy future. Disponível em: <http://www.fapesp.br/publicacoes/energia.pdf>. Acesso em: 17 out. 2015.
[17] GADELHA, S. R. B; CERQUEIRA, R. M.G. (2013) Tesouro Nacional. Consumo de Eletricidade e Crescimento Econômico no Brasil, 1952-2010: Uma Análise de Causalidade. Brasilia: Tesouro Nacional, 2013.Disponível em: <http://www.tesouro.fazenda.gov.br/documents/10180/210570/TD16_2013.pdf>. Acesso em: 17 out. 2015.
[18] MME (2007) MINISTÉRIO DE MINAS E ENERGIA. (Org.). Plano Nacional de Energia 2030.Brasilia: Mme - Ministério de
Minas e Energia, 2007. Disponível em:
<http://www.mme.gov.br/documents/10584/1139260/Plano+Nacional+de+Energia+2030+(PDF)/ba957ba9-2439-4b28-ade5-60cf94612092?version=1.1>. Acesso em: 17 out. 2015.
[19] JANNUZZI, G. e SWISHER, J. (1997) Planejamento Integrado de Recursos Energéticos: Meio Ambiente, Conservação de Energia e Fontes Renováveis. Campinas: Editora Autores Associados, 1997.
[20] HINRICHS, R. A.; KLEINBACH, M.; REIS, L. B. (2015) Energia e Meio Ambiente. 5. ed. São Paulo: Cengage Learning. Tradução da 5ª ed. norte americana por Lineu Belico dos Reis.
[21] UCZAI, P. R.; TAVARES, W. M.; QUEIROZ FILHO, A. P. (2012) Energias renováveis: riqueza sustentável ao alcance da sociedade. Câmara dos Deputados, 2012.
[22] PROINFA (2015) Energias Renováveis no Brasil Disponível em:
<http://www.mme.gov.br/programas/proinfa/menu/programa/Energias_Renovaveis.html>. Acesso em: 15 out. 2015.
[23] MURPHY JR, T.W. (2013) Além dos Combustíveis Fósseis: Avaliando Alternativas de Energia. In: ASSADOURIAN, Erik; PRUGH, Tom. A Sustentabilidade Ainda é Possível?Washington: Uma - Universidade Livre da Mata Atlântica, 2013. Cap. 9. p.
106-117. Tradução: Jorge LuisRitter von Kostrisch.. Disponível em:
<http://www.akatu.org.br/Content/Akatu/Arquivos/file/EstadodoMundo2013web.pdf>. Acesso em: 02 ago. 2015.
[24] SOUZA, E. L. L.; MACEDO, I.C.. 2010. Etanol e bioeletricidade:a cana de açúcar no futuro da matriz energética. São Paulo: Unica, 2010.
[25] ÚNICA (2015) Cana de açucar. Indústria Brasileira da Cana de açúcar: Uma trajetória de evolução.. Disponível em: <http://www.unica.com.br/linhadotempo/index.html>. Acesso em: 01 nov. 2014.
[26] NOVACANA (2015a) A produção de cana-de-açucar no Brasil (e no mundo). Disponível em: <http://www.novacana.com/cana/producao-cana-de-acucar-brasil-e-mundo/>. Acesso em: 05 jun. 2015.
[27] CANAONLINE (2014) Colheita de cana na Índia, segundo maior produtor de cana do mundo. Disponível em:
<http://www.canaonline.com.br/conteudo/colheita-de-cana-na-india-segundo-maior-produtor-de-cana-do-mundo.html#.VYtJbvlViko>. Acesso em: 24 jun. 2015.
[28] NOVACANA (2015b)Produção de açúcar na Índia cresce 14% na safra 2014/15.2015. Disponível em: <http://www.novacana.com/n/acucar/exportacao/producao-acucar-india-cresce-safra-030315/>. Acesso em: 24 jun. 2015.
[30] VIEIRA, A. P. et al. (2014) O Centro-Oeste brasileiro como fronteira agrícola. Tese de Doutorado. Universidade Estadual de Campinas. Disponível em: <http://www.sober.org.br/palestra/2/621.pdf >. Acesso em: 15 out. 2014.
[31] SHIKIDA, P. F. A. (2013) Expansão Canavieira no Centro-Oeste: Limites e Potencialidades. Política Agrícola, Brasília - DF, v. 2, n. 22, p.122-137, 2013. Trimestral.
[32] CASTRO, C. N. (2014) A agropecuária na Região Centro-Oeste: limitações ao desenvolvimento e desafios futuros. Rio de Janeiro: Ipea, 2014. 41 p. Disponível em: <http://repositorio.ipea.gov.br/bitstream/11058/2655/1/TD_1923.pdf>. Acesso em: 30 ago. 2014.
[33] ANDRADE, Manoel Correia de. Modernização e Pobreza: A expansão da agroindústria canavieira e seu impacto ecológico e social. São Paulo - SP: Unesp (1994). 257 p.
[34] WISSMANN, M. A. et al. (2014) Evolução do cultivo da cana de açúcar na Região Centro-Oeste do Brasil. Revista Brasileira de Desenvolvimento Regional, Blumenau, v. 1, n. 2, p.95-117, 10 jul. 2014. Disponível em: <file:///C:/Documents and Settings/Informatica/Meus documentos/Downloads/4165-14753-1-PB (1).pdf>. Acesso em: 21 nov. 2014.
[35] LEAL, S. T. et al. (2014) A expansão do setor sucroalcooleiro no estado do mato grosso do sul. In: SOBER - Sociedade Brasileira de Economia, Administração e Sociologia Rural, 52.Goiânia - Go. ARTIGO.Goiânia: Sober, 2014. p. 1 – 19.
[36] CASTILHO, F. R. (2013) A expansão da agroindústria canavieira no estado de Mato Grosso do Sul: características e crescimento. Dissertação (Mestrado) - Curso de Agronegócios, Universidade Federal da Grande Dourados, Dourados, 2013. Disponível em: <http://www.ufgd.edu.br/face/mestrado-agronegocios/downloads/dissertacao-fabio-roberto-castilho>. Acesso em: 24 jun. 2015.
[37] BALBINO, Valdir Antonio. (2014) Agroindústria canavieira e Desenvolvimento Local: uma análise para o município de Caarapó (MS). Dissertação (Mestrado) - Curso de Agronegócio, Universidade Federal da Grande Dourados, Dourados, 2014.
[38] Empresa de Pesquisa Energética (EPE) (2014). Anuário Estatístico de Energia Elétrica 2014. BrasÍlia, 2014. Disponível em: <http://www.epe.gov.br/AnuarioEstatisticodeEnergiaEletrica/Anuário Estatístico de Energia Elétrica 2014.pdf>. Acesso em: 10 jul. 2015
[39] JANK, M.S. (2009) O despertar da bioeletricidade Piracicaba. Disponível em:
<http://www.esalq.usp.br/acom/75anosdaUSP/artigos_depoimentos/O%20despertar%20da%20bioeletricidade.pdf>. Acesso em 17 mar. 2015.
[40] BITTENCOURT, Jeison (2008) Márcio. Perspectiva do uso do bagaço da cana-de-açúcar para geração de energia elétrica. TCC. Disponível em: <http://www.producao.joinville.udesc.br/tgeps/tgeps/2008-02/2008_2_tcc05.pdf>. Acesso em: 23 mar. 2015.
[41] CASTRO, N. J.; GOLDENBERG, P. (2008) Indicadores do Setor Elétrico na América do Sul:Evolução e Análise: Rio de Janeiro: Gesel, 2008.
[42] DOMINGUES, A. T. (2011) O setor agroindustrial canavieiro no Mato Grosso do Sul: desdobramentos e perspectivas.Tamoios, Brasil, n 2, p.21-36, jan. 2011.
[43] REIS, J. G. M. et al. (2013) Desenvolvimento do Setor Sucroenergético no Estado de Mato Grosso do Sul: Impactos e Benefícios da Geração de Energia a Partir da Produção de Cana-de- Açúcar. In: INTEGRATING CLEANER PRODUCTION INTO SUSTAINABILITY STRATEGIES, 4. São Paulo. ARTIGO. São Paulo: AcademicWork, 2013. p. 1 - 9.
[44] SANTOS, A. A. G. et al. (2014) Centrais termelétricas à biomassa no mato grosso do sul: uma “luz” para o problema da matriz energética. In: Sociedade Brasileira de Economia, Administração e Sociologia Rural, 52., 2014, Goiânia - GO. ARTIGO. Goiânia: SOBER, 2014. p. 1 - 16.
[45] UDOP. (2015b) Capacidade Instalada por Estado. Disponível em:
<http://www.udop.com.br/download/estatistica/biomassa/13ago15_capacidade_instalada_estados.pdf>. Acesso em: 15 jan. 2015b. [46] AGRON(2013)Bioeletricidade a partir da cana é alternativa. Entrevista com o presidente da BIOSUL. Disponível em: <http://www.agron.com.br/publicacoes/noticias/noticia/2013/03/07/032620/bioeletricidade-a-partir-da-cana-e-alternativa.html>. Acesso em: 02 ago. 2015.
[47] ARANHA, José Aparecido Moura et al. (2013) Cogeração com bagaço de cana de açúcar: aspectos da sustentabilidade no Mato Grosso do Sul. In: ECAECO, 6. Ponta Porã - Ms. Anais... . Ponta Porã: Ecaeco, 2013. p. 1 - 15. Disponível em: <http://periodicos.uems.br/novo/index.php/ecaeco/article/viewFile/4195/1717>. Acesso em: 01 ago. 2015.
[48] IBGE (2016) Cidades. Disponível em: <http://www.cidades.ibge.gov.br/xtras/home.php>. Acesso em: 10 jan. 2016.
[49] SEMADE (2015) Governo do Estado de Mato Grosso do Sul. Industrialização da cana de açúcar gera 30 mil empregos em Mato Grosso do Sul. Disponível em: <http://www.semade.ms.gov.br/industrializacao-da-cana-de-acucar-gera-30-mil-empregos-em-mato-grosso-do-sul/>. Acesso em: 17 out. 2015.
[50] BIOSUL (2015b) Setor sucroenergético de MS gerou o maior número de empregos no semestre. Disponível em: <http://www.biosulms.com.br/noticias/industria/setor-sucroenergetico-de-ms-gerou-o-maior-numero-de-empregos-no-semestre-134.html>. Acesso em: 22 out. 2015.
[51] CONAB (2015b) Levantamento de safra. Com base nesta página foram selecionados os dados de 2005 a 2015. Disponível em: <http://www.conab.gov.br/conteudos.php?a=1253&t=>. Acesso em: 15 jan. 2015.
[52] BIOSUL. (2015c). Mapa da bioenergia. Disponível em: <http://www.biosulms.com.br/bioenergia>. Acesso em: 13 maio 2015. [53] BIOSUL (2015d) Evolução da produção de bioeletricidade em MS (GWh).Disponível em: <http://www.biosulms.com.br/_arquivos/resultado/2089124500559145b53a9a89.90379797.pdf>. Acesso em: 23 nov. 2015.
[56] EPE (2015b) Anuário Estatístico de Energia Elétrica 2015. Brasília, 2015. Disponível em: <http://www.epe.gov.br/AnuarioEstatisticodeEnergiaEletrica/Anuário Estatístico de Energia Elétrica 2015.pdf>. Acesso em: 10 jul. 2015b.
[57] WWF (2012) Além de grandes hidrelétricas:Políticas para fontes renováveis de energia elétrica no Brasil. Brasilia: Wwf, 2012.
44 p. Disponível em:
<http://d3nehc6yl9qzo4.cloudfront.net/downloads/alem_de_grandes_hidreletricas_sumario_para_tomadores_de_decisao.pdf>. Acesso em: 05 jan. 2015.