AJPRHC
Research Article
DETERMINANTS OF HEALTHCARE EXPENDITURE ON HUMAN CAPITAL AND ECONOMIC GROWTH IN BANGLADESH: A LONGITUDINAL DATA ANALYSIS FROM 1995-2010
SHONGKOUR ROY
Center for Equity and health system (CEHS), International center for Diarrhoeal Diseases, Bangladesh (ICDDR, B) Mohakhali, Dhaka-1216
*Author for correspondence:[email protected]
This paper is available online at www.jprhc.in
ABSTRACT
The objective of this study was to examine the determinants of healthcare expenditure in Bangladesh between 1995 and 2010 by applying the World development indicator data. First, I developed an empirical model for longitudinal data analysis to determinant the healthcare expenditure under the human capital and economic growth. Next, I explored the dynamic relationships among healthcare expenditure, human capital and economic growth using OLS model. The expenditure in private healthcare was 2.3% and 1.2% GDP for the public health in 2010. A Wald statistic determined the joint significance of the data and R2= 99.42% for human capital and R2= 99.44% for economic growth indicates this model was the best fit. The empirical results concerned that healthcare expenditure GDP per capita plays an important role in economic growth and an income elasticity about 0.34 that implies healthcares are not luxury good in the Bangladesh.
KEYWORDS
Healthcare expenditure, Economic Growth, OLS Model, longitudinal data.
INTRODUCTION
To my knowledge, this is the first study to examine the determinants of healthcare expenditure in Bangladesh using World development data (WDI) and UN data (2010) sets. Healthcares expenditure was not increasing rapidly from 1995-2010 in our country. When compared with indicators of health care access and utilization, expenditure is an ideal measure because it
“captures the differences in intensity of care, as well as it allows for a more finely grained quantification of disparities among
those who are the most medically needy”10.In this study, I examine private healthcare expenditure was highly increasing in Bangladesh compare to public expenditure. To assess healthcare expenditure patterns, I run OLS model which shows positive effects of economic growth i.e. GDP per capita and human capital i.e. literacy rate and aging population 65 and above in the Asian country of Bangladesh. Section 2, describes the empirical model of public healthcare expenditure and data for analysis. In section 3, empirical results and discussions of the estimated parameters are given. Finally the conclusion of the paper appears in section 4.
MATERIALS AND METHODS
Data
The subject of this study is conducted in Bangladesh. The main sources of data are the World development indicator (WDI, 2010). I utilize two sources of data to create the determinants of healthcare expenditures in Bangladesh. The first task is the determinants of healthcare expenditure into Bangladesh and its effect on human capital and economic growth. The WDI provides this data by year. However, since much of this data not found, I also create a second task of the determinants of healthcare expenditures in Bangladesh using the UN data (2010). If a year is missing a value for healthcare expenditures in the WDI data, in that case I replace that value with our second task of healthcare expenditures from the UN data. I also collected the literacypercentage rate of people’s data from the UN. In order to determinants healthcare status in Bangladesh, I closely examine these factors of public healthcare expenditure. In this sense, it focuses on the estimation of longitudinal models in between 1995 to 2010. All these outcome by using Stata 12.0.
Table 1: Expenditure on Health (% of GDP) in 1995-2010
Years
Indicators 1995 2000 2005 2010
Government 1.276 1.098 1.120 1.170
Private 2.249 1.717 2.089 2.314
Total 3.524 2.815 3.208 3.484
An Empirical Approach to Determinates of healthcare Expenditure
To determinants of healthcare expenditure within a year in Bangladesh, I consider an empirical model to analysis of longitudinal data. To estimate parameters of longitudinal data, one can choice between fixed effects (FE) or random effects (RE) models. Here, I used ordinary least square regression model. Let us consider, two empirical models are specified as
follows-Healthcare expenditure per capita on human capital
(1) And healthcare expenditure per capita on economic growth
(2)
where HEPC is the dependent variable, and remaining variables are independent variable, trefers to time (t=1995,….2010),
and are corresponding unknown parameter to be estimated for both model and random error
.
Table 2: Growth of healthcare expenditure (%) in Bangladesh
Change (US$) Percentage Change ($)
Indicators 1995-2000 2000-2005 2005-2010 1995-2010 1995-2000 2000-2005 2005-2010 1995-2010
Government -1.279 -0.096 -0.096 -1.470 -0.145% -0.013% -0.013% -0.166%
Private 4.101 -4.024 -1.211 -1.134 0.150% -0.128% -0.044% -0.041%
Hitiris and posnett3 determinants healthcare expenditures per capita on several socio-economic, demographic and life style variables. A different study has done in different time on health expenditure. You may see Blomqvist and carter4, Hitiris5, Giannoni and Hitiris6,Cantarero2, and Di Matteo7. In the Alok Bhargava8et al. showed that effect of health expenditures on
economic growth by including human capital such as life expectancy. 1Rahman arguments on empirical model by including human capital and health expenditure, where health facilities were developed human capital which meant not a luxury good.
Table 3: Summary of statistics in selected variables
Variables Minimum Q1 Q2 Q3 Maximum Mean Stdv
LE (years) 62.123 63.978 65.889 67.489 68.635 65.691 2.085
LR (%) 47.486 47.486 52.133 56.780 56.780 52.133 6.572
NM (per 1000) 0.272 0.272 0.272 0.280 0.280 0.275 0.005
P (per 1000) 0.200 0.201 0.257 0.295 0.300 0.254 0.044
PSE (%) 84.120 86.523 90.324 92.890 94.874 89.811 3.894
GDP (US$) 322.927 353.797 371.960 455.046 674.932 421.940 104.097
HEPC 8.517 9.274 10.570 15.437 23.293 12.681 4.608
PHEGDP (%) 1.055 1.118 1.168 1.219 1.276 1.168 0.063
PRHEGDP (%) 1.589 1.754 2.001 2.259 2.314 1.994 0.266
THEGDP (%) 2.734 2.899 3.166 3.435 3.524 3.161 0.289
GHE (%) 6.152 7.509 8.142 8.541 8.996 8.025 0.722
THE (%) 31.659 34.643 37.067 39.770 42.303 37.155 3.084
HB (per 100) 0.300 0.300 0.300 0.320 0.340 0.310 0.020
PA065 (%) 3.819 3.952 4.149 4.386 4.586 4.173 0.252
RESULTS AND DISCUSSIONS
The summary of statistics for key variables used in our analysis is given Table 3. The statistics are explored about human capital and healthcare expenditure of Bangladesh in between 1995-2010.In 1995-2010, the average GDP per capita was US $421.94 and the healthcare expenditure per capita was US $12.68. The public healthcare expenditure GDP was about 1.17% in comparing with the private healthcare expenditure was about 1.99%. The average number of primary school enrolment was 90% and literacy rate was 52%. The population aging 65 year and above were 4% and the average life expectancy was 66 year. Econometric results from estimating equation (1) and (2) with the OLS are presented in Table 4 and Table 5. A Wald statistic is included to evaluate the joint significance of the variables for the both full models and R-square 99.42% in Model1 and 99.44% in Model2 implies that the OLS model was the best fit on the selected variables.
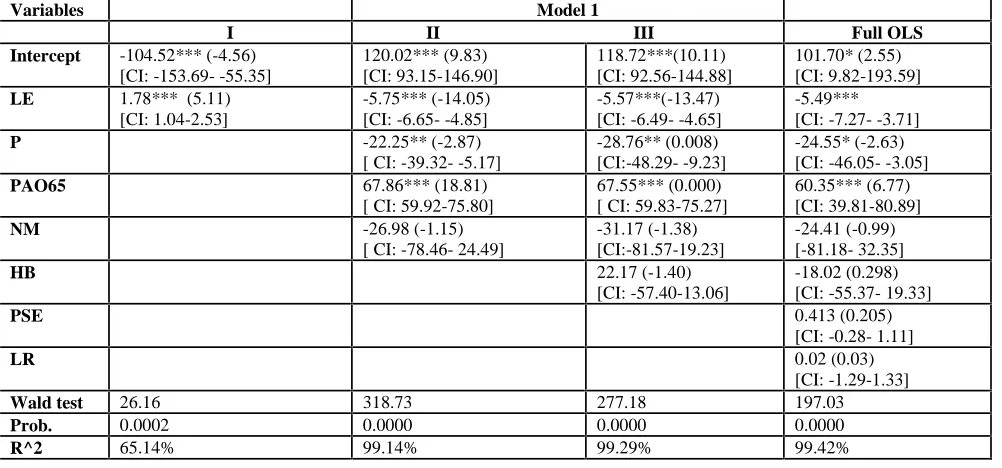
Table 4: Effect of the Healthcare expenditure per capita (HEPC) on human capital
Variables Model 1
I II III Full OLS Intercept -104.52*** (-4.56)
[CI: -153.69- -55.35]
120.02*** (9.83) [CI: 93.15-146.90]
118.72***(10.11) [CI: 92.56-144.88]
101.70* (2.55) [CI: 9.82-193.59]
LE 1.78*** (5.11)
[CI: 1.04-2.53]
-5.75*** (-14.05) [CI: -6.65- -4.85]
-5.57***(-13.47) [CI: -6.49- -4.65]
-5.49*** [CI: -7.27- -3.71]
P -22.25** (-2.87)
[ CI: -39.32- -5.17]
-28.76** (0.008) [CI:-48.29- -9.23]
-24.55* (-2.63) [CI: -46.05- -3.05]
PAO65 67.86*** (18.81)
[ CI: 59.92-75.80]
67.55*** (0.000) [ CI: 59.83-75.27]
60.35*** (6.77) [CI: 39.81-80.89]
NM -26.98 (-1.15)
[ CI: -78.46- 24.49]
-31.17 (-1.38) [CI:-81.57-19.23]
-24.41 (-0.99) [-81.18- 32.35]
HB 22.17 (-1.40)
[CI: -57.40-13.06]
-18.02 (0.298) [CI: -55.37- 19.33]
PSE 0.413 (0.205)
[CI: -0.28- 1.11]
LR 0.02 (0.03)
[CI: -1.29-1.33]
Wald test 26.16 318.73 277.18 197.03
Prob. 0.0002 0.0000 0.0000 0.0000
Notes: Values in First bracket corresponding t- values. Values third bracket corresponding 95% CI and * Significant at P<0.05 ** Significant at P<0.01 *** Significant at P<0.000
In Model 1 life expectancy (LE), Physician (P), and population aging 65 year and above (PA065) shows significant relationship with healthcare expenditure per capita.
Table 5: Effects of the Healthcare Expenditure per capita (HEPC) on Economic growth
Variables Model 2
I II Full OLS
Intercept -108.81*** (-13.41) [CI: -126.21- -91.41]
-112.95***(-13.46) [CI: -131.23- -94.67]
-210.78***(-6.80) [CI: -279.87- -141.71] LnGDP 20.18*** (14.98)
[CI: 17.29-23.07]
18.39***(15.98) [CI: 15.88-20.90]
16.87***(15.85) [CI:14.50-19.25]
PHEGDP 4.08 (1.05)
[CI: -4.38- 12.54]
-80.99**(-3.10) [CI: -139.11- -22.87]
THEGDP 3.22**(3.42)
[CI: 1.17- 5.26]
36.76**(3.49) [CI: 13.31- 60.21]
GHE -0.36 (-0.90)
[CI: -1.24-0.53]
THE 2.77**(3.16)
[CI: 0.82-4.73]
Wald test 224.54 326.34 353.86
Prob. 0.0000 0.0000 0.0000
R^2 94.13% 98.79% 99.44%
Notes: Values in First bracket corresponding t- values. Values in third bracket corresponding 95% CI and * Significant at P<0.05 ** Significant at P<0.01 *** Significant at P<0.000
The other selected variables nurse-midwives (NM), hospital bed (HB), primary school enrolment (PSE) and literacy rate (LR) show no statistically significant relationship with healthcare expenditure per capita. The population aging 65 and above (PAo65) 60.35 [95% CI (39.81-80.89); p-value= 0.000] were strongly significant positive effect on population aging 65 and above into Bangladesh. As found in previous studies, population aging 65 and above has a positive relationship with HEPC, which was inconsistent with findings in previous studies (Rahman, 2008).
A change in the HEPC has a significantly negative effect on our life expectancy rate (LR) and physician (P) i.e. -5.49 [95% CI (-7.27- -3.71); p-value= 0.050] and -24.55 [95% CI (-46.05- -3.05); p-value= 0.000] respectively.
In Model 2 GDP per capita (LnGDP), public healthcare expenditure percent of GDP (PHEGDP) and total healthcare expenditure (THE) shows significant relationship with healthcare expenditure per capita; and government health expenditure shows no statistically significant relationship with healthcare expenditure per capita. The GDP per capita was strongly significant positive effect on healthcare expenditure per capita i.e. 16.87 [95% CI (14.5019.25); pvalue= 0.000]; whilst PHEGDP 80.99 [95% CI (139.11 -22.87); p-value= 0.01] were negatively significant and total healthcare expenditure 2.77 [95% CI (0.82-4.73); p-value= 0.000] were also positively significant with healthcare expenditure per capita. In the field of health economics, the value of healthcare expenditure income elasticity is a determinant the effect of per capita income. If this income elasticity is greater than unity, healthcares are luxury good and their increase is a natural outcome of economic growth see, Robert9. To evaluate income elasticity in the country of Bangladesh in between 1995-2010, I estimated parameter of OLS model on LnHEPC with all other Model 2 response variables and value of the LnGDP=0.34, which was not statistically greater than unity. Henceforth, income elasticity indicates that healthcares are not a luxury good into Bangladesh.
CONCLUSIONS
Appendix A: Variables and its definitions.
Conflict of Interest: No
REFERENCES
1. T Rahman. Determinants of public health expenditure: some evidence from Indian states. Appl Econ Letters 2008; 15: 853-857.
2. Cantarero D. Decentralization and health care expenditure: the Spanish case. Appl Econ Letters 2005; 12:963–6. 3. Hitiris T, Posnett J. The determinants and effects of health expenditure in Developed countries. J of Health Econ 1992;11:173–81.
4. Blomqvist A G, Carter R A L. Is health care really a luxury?. J of Health Econ 1997; 16:207–29.
5. Hitiris T. Health care expenditure and integration in the countries of the European Union. Appl Economics 1997; 29:1–6.
6. Giannoni M, Hitiris T. The regional impact of health care expenditure: the Case of Italy. Discussion Papers in Economics No. 1999/20, The University of York, 1999.
7. Di Matteo L, Di Matteo R. Historical evidence on the determinants of Canadian provincial government expenditure: 1965–1991. J of Health Econ 1998; 17:211–28.
8. Alok Bhargava, Dean T Jamison. Modeling the effects of health on economic growth. J of Health Econ 2001; 20: 423-440. 9. Robert F Bordley, James B McDonald. Estimating Aggregate Automotive Income Elasticities from the Population Income-Share Elasticity. J of Business & Econ Stat 1993;11(2):209-214.
10. Cook BL , Manning W G . Measuring racial/ethnic disparities across the distribution of health care expenditures. Health Services Res 2009; 44:1603-1621.
Variable(s) Definitions
LE Life expectancy at birth total (years)
LR Literacy rate, adult total ( % of people)
PSE Primary School enrolment ( % gross)
GDP Gross Domestic Product per capita ( Current)
PHEGDP Public Health care expenditure ( % of GDP)
THEGDP Total health expenditure ( % of GDP)
GHE Government health expenditure (%)
THE Total health expenditure (%)
PA065 Population aging 65 and above ( % of total)
HB Hospital per bed (per 100 people)
NM Nurses and Midwives (per 1000 people)