1Ph.D candidate at Kulliyyah of Architecture and Environmental Design. Email: [email protected] 17 PLANNING MALAYSIA:
Journal of the Malaysian Institute of Planners
SPECIAL ISSUE IV (2016), Page 17 - 30
MANAGING URBANISATION AND URBAN SPRAWL IN MALAYSIA BY USING REMOTE SENSING AND GIS APPLICATIONS
Nur Aulia Rosni1, Norzailawati Mohd Noor2 & Alias Abdullah3
1,2,3
Kulliyyah of Architecture & Environmental Design INTERNATIONAL ISLAMIC UNIVERSITY MALAYSIA
Abstract
In the global era, more than half of the world population live in urban area. With rapid urbanisation growth where the highest percentage concentrates in Asia, a relevant approach is needed to eliminate the possible threat that occurs after urbanisation took place; the urban sprawl. Urban sprawl is a popular term in academic discourse and has a long history but until these days, the concrete definition of this term is not yet configured. Many studies of sprawl have rooted back in non-Asian countries making the solution for sprawl is not suitable to be implemented in term of theories and practice. This research attempts to study the measurement of sprawl by using these geospatial indexes with Remote Sensing and GIS approach. The SPOT-5 images with 2.5 meters resolution were used to analyse the growth of sprawl in Kuala Lumpur metropolitan due to its high urbanisation rate. The findings show that Kuala Lumpur is a sprawling city. It is anticipated that this research will provide a new direction in urban sprawl studies and represent a robust analytic approach for characterizing urban development on the city scale at once as well as promoting a city via Remote Sensing and GIS technology.
Keyword: Urban Sprawl Measurement; Geospatial Indices; Urbanisation; Remote
Sensing; GIS; Asian Cities
INTRODUCTION
Urbanisation can be defined as the physical growth of urban areas as a result of global change when people move into the city from the rural area. Urbanisation is closely linked with modernisation, industrialisation, and the sociological process of rationalisation. According to Bhatta et al. (2010), urbanisation is a process of population concentration; the shift from a rural to an urban society, and involve an increase in the number of people in urban areas during a particular year. Economic and social development cause urban concentration and expansion of large cities using changes in land use pattern as well as the transformation of organisation and governance from rural to metropolitan.
of population within a particular economy and society while Urbanisation is a spatial and social process that refers to the changes of behaviour and social relationships that occur in social dimensions as a result of people living in towns and cities.
Jaafar (2004) has stated that urbanisation or growth of urban areas are phenomena that increase the concern of policy makers and town planners since the trend of urbanisation have wide-ranging implications for socio-economic development. Traditionally, urbanisation has a strong connection with industrialisation process. The development of industrial activities usually focused in the urban area due to the availability of infrastructure and facilities; this scenario created more job opportunities that cause many people chose to migrate to the urban area. The high number of the population requires more source of energy to be provided in order to enhance human productivity that leads increasing demand for both industry and agriculture. This situation will cause the rapid and massive growth of migration to large cities. Urbanisation can result in positive and negative consequences. In most urbanised countries, some of the issues are employment, sanitation, housing, sewage, water, fire, social welfare, the role of government, and political machines.
Due to urbanisation, the housing and infrastructure cost also increase due to the scarcity of resources such as land area, water and building materials. Moreover, the major environmental impact of large cities often includes traffic congestions and noise pollution. Urbanisation process causes the city to decay which the local authority cannot provide service that meet the need of the residents. Air pollution resulted from over-dependence on motorised transport, and water pollution resulted from poor sewage facilities. Based on the different views and opinion on the Urban development, Urban Growth and Urbanisation, it can be concluded that these process will affect three main aspects which are (1) Physical, (2) Demographic and (3) Social factors in an area which all of this aspect closely linked to urban sprawl.
Urban sprawl is a stage that takes place after urbanisation. Cities grow vertically and achieve certain density tend to continue to grow horizontally, spilling out from its border and infecting the outside area around the original town. It is one of the low-density developments which mean it occupies the lot of space that functioned as natural habitat, vacant land or even farmland. Urban sprawl and its impacts have attracted increasing attention from planners and policy makers resulting in heated discussions on its definition, measurement, causes and negative consequences. A selection of urban sprawl definitions has been derived to describe sprawl and as a particular form of urban development with low density, disperse, auto-dependent, environmentally and socially-impacting characteristic (Burchell and Shad 1998; Ewing 2002; Galster et al 2001; Majid et al 2010). Urban sprawl is a process that is characterized by an unforeseen and jagged pattern of growth, driven by a multitude of processes and leading to inefficient resource utilisation (Bhatta et al. 2010).Uncontrolled, unplanned and uncoordinated growth of urban areas causes the urban sprawl to occur. Urban sprawl which is both inefficient and unsustainable is due to the inability of town planners, policy makers and the authority to visualize such growth during planning, policies and decision-making process.
Absolute measurements are capable of creating a black and white distinction between a sprawled city and compact city. GIS and remote sensing can be combined or used separately in studying urban sprawl, both applications can supply physical, social and economic data for simulation Mohd Noor et al. (2009). There are some researchers on how to use remote sensing and GIS to monitor and measure urban sprawl (Sudhira & Ramachandra, 2007; Weng, 2001; Yeh & Li, 1999). Remote sensing has the capability to provide spatially consistent datasets that cover vast areas with both high spatial detail and high temporal frequency. It has been in use since 1960; remote sensing can also provide consistent historical time series data. Remote sensing is a “unique view” of the spatial and temporal dynamics of the processes of urban growth and land use change (Herold, Menz, & Clarke, 2001). Satellite remote sensing techniques have, therefore, been widely used in detecting and monitoring land cover change at various scales with a useful result (Wilson et al. 2003). Recently, remote sensing has been used in combination with Geographical Information System (GIS) and Global Positioning System (GPS) to assess land cover change more effectively than remote sensing data alone (Weng, 2001). The combination of GIS and remote sensing are useful in mapping urban areas, and as data source for the analysis and modelling urban growth, and land use/land cover change (Herold, Goldstein, & Clarke, 2003; Wilson et al., 2003).
OBJECTIVE
The research was conducted to measure urban sprawl development in Kuala Lumpur city by applying the geospatial indicators developed in the western countries in the local geographical development background. It is to investigate as well the relationship and influence of urbanisation process and urban sprawl. The process involved literature review on the urban growth, urbanisation and urban sprawl, the issues and problems as well as the impact. This research is the pioneer to further develop a geospatial measure that suite the local background and at the same time contribute to the knowledge and defining sprawl.
STUDY AREA
In 2010, the Asia-Pacific region’s urban population were 754 million people which is more than the population of the United States of America combined with the European Union. The urbanisation rate in South East Asia has been increased over the years and expected to achieve 50million people in 2020 as compared to only 30 million people in 1990. However, urbanisation growth in Asia is regarded as environmentally unsustainable with the growth of slums in overpopulated urban areas, a high level of social and economic inequality (ESCAP 2010). Urbanisation in Malaysia can be classified into three major period starting with the founding of urban areas during colonisation period in the 1800s, followed by urban growth, development and increasing urbanisation in the early years of independence (1950s). The urbanisation rate in Malaysia is increasing year by year from about 25% in 1960 to 65% in 2005. Malaysia target to achieve 70% urbanisation rate in the year 2020 which means 70% of its total population are living in the urban area.
Figure 1: Location of study area – Kuala Lumpur District, Malaysia
SOFTWARE AND MATERIALS
Extensive availability of remote sensing images, spatial data and geospatial tools has seen some surge in the intensity of urban sprawl studies. A typical urban sprawl study involves an attempt at quantifying the amount of paved surface and built up area in a given region using remotely sensed data or other geospatial data. The coverage of these paved and built up areas will then be used to identify the pattern and extent of urban sprawl. In other words, urban sprawl mapping can help in picturing how and where the growth of a city is occurring. These situations allow the responsible authority to recognize types of development that can be executed or need to be avoided in the particular area. Moreover, threatened natural and environmental resources can be identified and preserve which likely support future development that is not only sustainable but also help to reduce urban sprawl. By analysing the urban sprawl growth pattern in an area over a period, its nature and characteristic can be indulged and managed by the responsible authority primarily the local planning authority.
These applications are now also providing new tools for advanced ecosystem management. The collection of remotely sensed data facilitates the synoptic analysis of earth’s system function patterning and change at local, regional and global scales.
According to Agarwal (2007), the real world cannot solely be represented in two dimensions as is commonly accepted. Most modelling in GIS has been two dimensional especially in the context of urban planning. The development in the field of "fuzzy logic" and "artificial neural networks" is providing the option of incorporating indeterminate and ambiguous information from the real world into GIS. This will be especially helpful while considering the cognitive models and individual perception of people and incorporating them by reference into GIS. For this study, the primary research mainly depended on the data obtained from MACRES, Department of Survey and Mapping Malaysia (JUPEM), and the local authority (Kuala Lumpur City Council). The satellite data were the primary sources while the ancillary data were the secondary data (Table 1). The satellite data included SPOT-5 images from 2012. On the other hand, the ancillary data consisted of topographic maps, land use maps, road map, contour line, and urban map. The software used to calculate and analyse the raw data and to generate the results included ERDAS, ArcGIS, MapInfo, E - cognition and SPSS.
Table 1: Data sources for study
Type of Data Year of Acquisition/Publication
Spot-5 images (2.5 meter) 2012
Topographic Maps 2010
Land Use Maps 2010
Road Map 2010
Contour Line 2010
Urban Map 2010
Vector Data 2010
spectral resolution of the satellite-borne sensors. Later, the result of GIS and remote sensing usage in urban sprawl studies will be explained further in the next sections.
METHODS
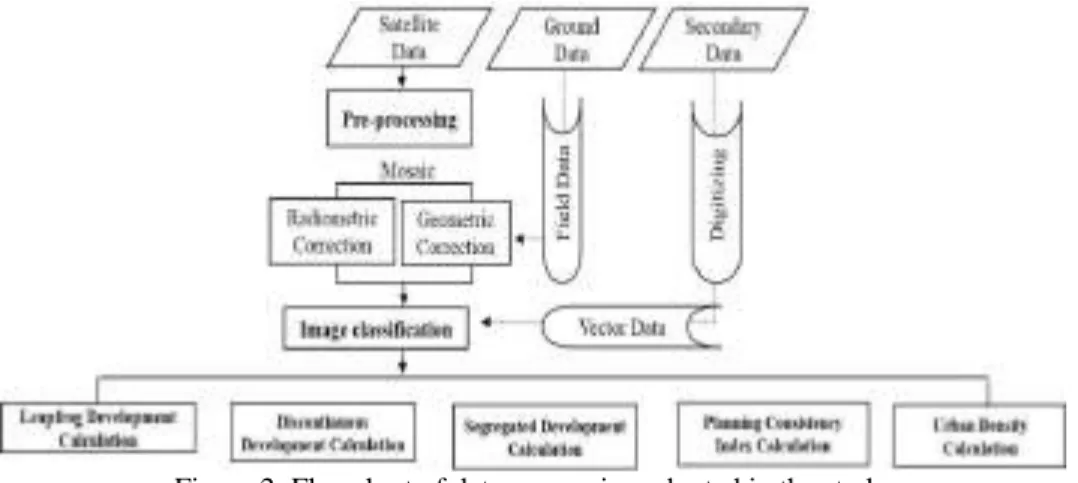
The image pre-processing and data preparation were carried out; these included image rectification and mosaicking. The image-to-map procedures were applied to the Spot 5 images using set of ground control point’s area that appeared in the same place, both in the imagery and known locations in corresponding map and urban plan used as ancillary information in the rectification process. The rectified datasets were then mosaicked thus producing the entire study area from Vector Data images as supported data (Figure 2). Image classification was then applied to the pre-processed image and the land use classes map of the entire study area was produced. Supervised classifications techniques were chosen for this study, which was performed using the object-based classifier in E-Cognition software system. The system enabled all fine details of the land cover to be classified and later merged accordingly to form the classes in accordance with urban land use classes used in urban planning practice. In this study, the object-based classifier was employed to build optimal training areas and to build up knowledge for each category of interest prior to the classification of the entire image. Initially, the algorithm trained the spectral classes by supervising the training process after collecting the parametric and non-parametric signatures (training samples). After completion of the training process, the entire knowledge of the class’s occurrence within the SPOT-5 image was generated. The knowledge was then used to identify all the pixels in the picture into the trained classes with multi-resolution segmentation approach. The classes identified were then re-categorized into two main classes namely unbuilt and built up, apart from identifying them further into detailed of the type of 11 land uses.
Figure 2: Flowchart of data processing adopted in the study
distributed in the study area. Fill this imagery is also subject to image enhancement. The image classification was carried out in two steps process to produce first level classes of built and unbuilt areas and further detailed land use classes within the built-up areas. Final classified image classes are as tabulated in Table 2.
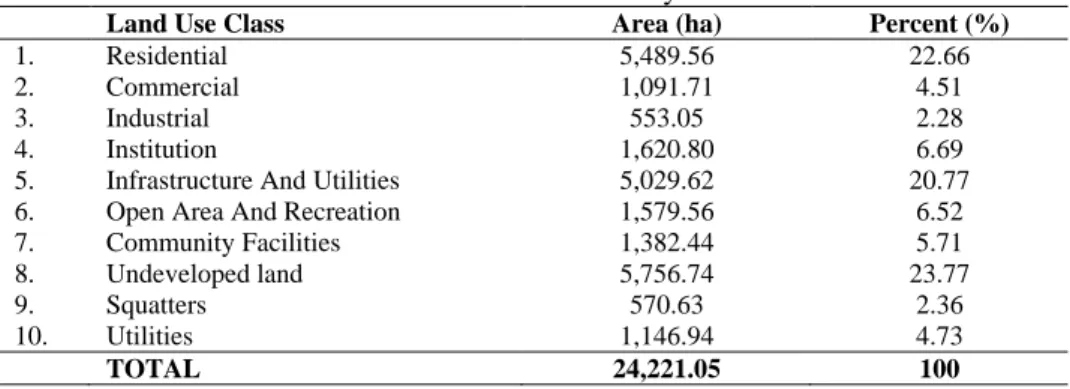
Table 2: Land use classified for year 2010
Land Use Class Area (ha) Percent (%)
1. Residential 5,489.56 22.66
2. Commercial 1,091.71 4.51
3. Industrial 553.05 2.28
4. Institution 1,620.80 6.69
5. Infrastructure And Utilities 5,029.62 20.77
6. Open Area And Recreation 1,579.56 6.52
7. Community Facilities 1,382.44 5.71
8. Undeveloped land 5,756.74 23.77
9. Squatters 570.63 2.36
10. Utilities 1,146.94 4.73
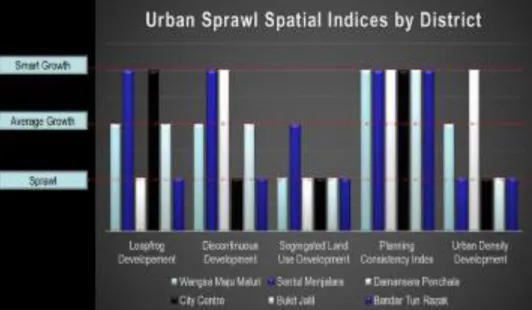
Based on the geospatial indices of urban sprawl measurement that have been conducted, the results show that all areas in Kuala Lumpur are facing different types of sprawl problems (Figure 3). The city centre has the most types of sprawl which are segregated land use, urban density sprawl, planning consistency, and discontinuous development. The next city with a high number of urban sprawl types is Damansara-Penchala district which have three types of urban sprawl namely planning consistency, leapfrog development and segregated land use. However, only one type of geospatial indices urban sprawl that are occurring in Sentul Menjalara district. The remaining three district (Wangsa Maju- Maluri, Bdr. Tun Razak - Sg. Besi and Bukit Jalil- Seputeh) has two types of urban sprawl for each district. The majority of the areas in Kuala Lumpur have less than three types of land uses. This situation indicates that Kuala Lumpur is facing urban sprawl but not in the critical level. However, without proper measures to overcome the current problem, the future development of Kuala Lumpur might lead to bigger sprawl growth. The urbanisation process in Kuala Lumpur started at the City Centre due to mining activities in the 1850s. The mining town was developed organically which means that no proper city planning have been implemented along with its urbanisation process. Then the urbanisation process has spread to the neighbouring area from the city centre to Damansara – Penchala and Wangsa Maju- Maluri. People tend to move from high-density area to suburban area due to spacious residential land and low cost of residential building as compared to the city centre. Many of the workers from middle-income group choose to commute from their residential area in suburban to work in the city to save cost on housing.
However, previous studies in urban sprawl demonstrate the true costs of sprawl, and attempt to show that if new development was built at higher densities and with proper public transit, lots of money could be saved as compared to developing new land area near the urban area. The new development outside the urban area has its hidden costs, identifying innovations note that there is demand for sprawl, for the suburban home and that, even though, the infrastructure and operating costs are considerably higher, the price is often cheaper. But with new development, facilities like road network need to be built to cater the need of suburban settlers. Roads are free to use but aren’t cheap to build or maintain. The cost of building roads come from the taxpayers. Plus, the provision of too many roads for private vehicles has caused traffic congestion and pollution in Kuala Lumpur.
highly takes place. The urban sprawl that took place in Kuala Lumpur is different in each district and based on the different characteristic.
Figure 4: Urban Sprawl spatial indices by District
CONCLUSION AND RECOMMENDATIONS
ACKNOWLEDGEMENT
The authors wishing to greatly acknowledge assistance from the Malaysian Remote Sensing Agency, Kuala Lumpur City Council, JUPEM, MACRES, and Town and Urban Planning Department for providing invaluable respective data used in this study. The Academy of Science Malaysia (ASM) and International Institute for Applied System Analysis (IIASA) for sponsored training and technical support. Authors sincerely thank all referees for their suggestions to improve the manuscript.
REFERENCES
Abdullah, J. (2012). City Competitiveness and Urban Sprawl: Their Implications to Socio-Economic and Cultural Life in Malaysian Cities. Procedia - Social and Behavioral Sciences, 50(July), 20–29. doi:10.1016/j.sbspro.2012.08.012
Agarwal, S., Satyavada, S., Kaushik, S. & Kumar, R. (2007). Urbanization, Urban Poverty And Health Of The Urban Poor: Status, Challenges And The Way Forward. Demography India, 36, 1, p.p 121.
Bhatta, B., Saraswati, S., & Bandyopadhyay, D. (2010). Quantifying the Degree-Of-Freedom, Degree-Of-Sprawl, and Degree-Of-Goodness of Urban Growth from Remote Sensing Data. Applied Geography, 30(1), 96–111. doi:10.1016/j.apgeog.2009.08.001
Burchell, R. W., Shad, N. A., Listokin, D., & Phillips, H. (1998). The Cost of Sprawl - Revisited. Washington, D.C.
Ewing, R., Meakins, G., Hamidi, S., & Nelson, A. C. (2014). Relationship Between Urban Sprawl and Physical Activity, Obesity, and Morbidity - Update and Refinement. Health and Place, 26, 118–126. doi:10.1016/j.healthplace.2013.12.008
Ewing, R., Pendall, R., & Chen, D. (2002). Measuring Sprawl and Its Impact. Smart
Growth America. Retrieved from
http://www.smartgrowthamerica.org/sprawlindex/sprawlindex.html
Galster, G., Hanson, R., Ratcliffe, M. R., Wolman, H., Coleman, S., & Freihage, J. (2001). Wrestling Sprawl to The Ground: Defining and Measuring an Elusive Concept. Housing Policy Debate, 12(4), 681–717. doi:10.1080/10511482.2001.9521426 Herold, M., Goldstein, N. C., & Clarke, K. C. (2003). The Spatiotemporal Form of Urban
Growth: Measurement, Analysis and Modeling. Remote Sensing of Environment, 86(3), 286–302. doi:10.1016/S0034-4257(03)00075-0
Herold, M., Menz, G., & Clarke, K. C. (2001). Remote Sensing and Urban Growth Models – Demands and Perspectives. Regensburger Geographische Schriften, 35, 78 – 88. Retrieved from http://www.eo.uni-jena.de/~c5hema/pub/herold_menz_clarke.pdf
Jaafar, J. (2004). Emerging trends of urbanisation in Malaysia. Journal of the Department of Statistics, Malaysia 1(1), 43-54.
Majid, M. R., & Yahya, H. (2010). Sprawling of a Malaysian City : What Type and What Solutions ? *. The First International Conference on Sustainable Urbanization (ICSU 2010), (December), 15–17.
Sudhira, H. S., & Ramachandra, T. V. (2007). Characterising Urban Sprawl from Remote Sensing Data and Using Landscape Metrics. In 10th International Conference on Computers in Urban Planning and Urban Management. Brazil.
Weng, Q. (2001). A Remote Sensing – GIS Evaluation of Urban Expansion and its Impact on Surface Temperature in The Zhujiang Delta, China. International Journal Remote Sensing, 22(10), 1999–2014.
Wilson, E. H., Hurd, J. D., Civco, D. L., Prisloe, M. P., & Arnold, C. (2003). Development of a Geospatial Model to Quantify, Describe and Map Urban Growth. Remote Sensing of Environment, 86(3), 275–285. doi:10.1016/S0034-4257(03)00074-9 Yeh, A. G.-O., & Li, X. (1999). An Entropy Method to Analyze Urban Sprawl in a Rapid