This till is no.,...inde ed in Scopos
---SCOPl.. .PLANNING MALAYSIA
Geospatial Analysis in Urban Planning Volumell(2013),Page 101 - 118
POTENTIAL URBAN DEVELOPMENT PARAMETERS THAT REDUCE ENERGY CONSUMPTION IN RESIDENTIAL AREA
Ariva Sugandi Permana1, Norsiah Abd. Aziz2 & Abd. Razak Jaffar3
Abstract 1
•2&3Centrefor Innovative Planning and Development (CiPD) Faculty of Built Environment
UNIVERSITJ TEKNOLOGI MALAYSIA
Cities are relatively the larger energy consumers in comparison to its rural counterparts. Reducing energy consumption in cities through various controlling strategies has significant impact on the conservation of natural resources and environment. Residential density and floor area to land ratio has been used as key parameters in development control tools towards creating harmonious urban development. However no attempt has been made to employ them to lower residential energy consumption. This study attempts to demonstrate the possibility of using residential density and floor area to land ratio as passive parameters to reduce non-transportation energy consumption at household level. The analysis was based on questionnaire survey of non-transportation energy consumption viz. energy for lighting, thermal comfort and cooking purposes at household level in Bandung City, Indonesia. The result shows that non-transportation energy consumption perceptibly associates with the two parameters of development control with a u-shape pattern i.e. the correlation has one lowest point with higher trends at both ends. This finding is important for urban planners in formulating strategies towards lower consumption of non-transportation energy in tropical cities and consequently contributing to better-off urban environment.
Keywords: urban parameters, energy consumption, residential density, floor area to land ratio, development control
1
Senior Lecturer at Department of Urban and Regional Planning, Faculty of Built Environment, Universiti Teknologi Malaysia. Email: [email protected] (Corresponding Author)
Ariva S11gandi Permana, Norsiah Abd. Aziz & Abd. Razak Ja/far
Pote111ial Urban Development Parameters that Reduce Energy Consumption in Residential Area
INTRODUCTION
Energy is becoming a vital commodity due to the continuous increases of its
price.· While energy demand relentlessly increases, non-renewable energy reserve invariably decreases. The era of low hanging fruit for energy is now over and therefore low-cost energy is no longer available. Energy is one of the most influential commodities in the world because of the ever-increasing consumers. Cities are undeniably important energy consumers because of their large energy consumption. The level of energy consumption of cities will
continuously increase as they grow and develop. The changing life style of the
urban population will also lead to increased energy consumption and this has
become a challenge to the urban development.
It has been reported that nearly half of world's population is living in
cities and towns at the turn of the new millennium (Leitmann 1999). United
Nations (2006) noted that the population in urban areas is growing annually with the rate of 2.60 percent, compared to 1.12 percent in rural areas. The increase of urban population along with the changing life style brings to a
constant increase of energy consumption, and this clearly confronts sustainable
development i.e. "development that meets the needs of present without
compromising the ability of future generation to meet their own needs" (WCED 1987). This condition is suppo11ed by Wackernagel and Rees ( 1996), as they
argue that the world has been exploited by most of humankind, while the ability of future generation to meet their own needs must also be fulfilled. From this point, conflicts between utilization and consumption, vis-a-vis conservation of
natural resources are commenced, and it has also been enhanced with the fact that cities or any urban areas are the great consumers of any resources including
energy.
The largest quantity of energy used by various transportation modes in
many developing countries are non-renewable energy sources such as oil and natural gas. These types off uels are still abundant and easily acquired, and this leads to their continued wider use. As a result, consumption of oil and natmal
gas are increasing over time. Likewise, the production also takes the same fashion. Similarly, energy consumption of residential buildings, in aggregate,
increases over time as the number of residential buildings increases.
Energy consumption of residential buildings is governed by various
factors which are essentially centred at the residential building's occupants.
Inability to perfectly adapt to local condition is one of the causes of en
ergy-inefficient building as illustrated by Tantasavasdi et al. (2001) and West (2001). Ventilation which affects thermal performance of buildings and effective
PLANNING MALA YS/A Geosparial Analysis in Urban Planning
utilization of daylighting are two other factors which also influence the consumption of energy in residential buildings. In naturally ventilated buildings, ventilation technique is one of the important elements in a building to achieve thermal comfort. Geros et al. (2005) acknowledge that thermal impact of night ventilation affect energy use to achieve thermal comfort. Tantasavasdi et al. (2001) explored the potential of using natural ventilation as passive cooling
system for new houses design in Thailand. Although mostly applies for buildings in sub-tropical countries, Assimakopoulos et al. (2005) show that building orientation may affect residential energy consumption through heating and cooling loads. At city level, Ghiaus et al. (2006) confirms that urban
environment influences natural ventilation. Flor and Dominguez (2004) also show that there is a clear interaction between urban context and thermal performance of buildings. Similar argument, Niachou et al. (2008) show that urban street canyon effect, created by roads and buildings, governs airflow pattern which affects urban temperature, and eventually, thermal comfort. Urban texture, which is essentially a spatial structure of an urban area formed by urban elements e.g. buildings, roads and green areas, affects energy consumption in building (Ratti et al. 2005). These arguments show that orientation and geometry of the buildings affect energy consumption in buildings. It also substantiates that development control may be employed as strategies to reduce energy consumption in residential buildings, because orientation and geometry of buildings can be regulated by development control
tools.
RESIDENTIAL BUILDINGS AS ENERGY USERS IN THE STUDY
AREA
Residential buildings are the largest energy users in terms of quantity of the consumption. One reason is that residential buildings are the only building that is used round-the-clock in comparison to other buildings. This feature makes residential buildings an important energy consumer where significant amount of energy can be saved through various efforts, including design and development control. Bandung City, Indonesia was selected as the study area to corroborate the viability of development control in reducing residential energy consumption. Bandung is the capital city of West Java Province of Indonesia. It is located at 107° East and 6°55' South and covers an area of 16, 767 hectares. There are five urban development forms identified in the study area, namely controlled residential-cum-commercial areas, naturally grown urban kampungs, unplanned urban sprawl, leap-frog development, and planned satellite towns. The residential buildings located in these different urban features exhibit different
Ariva Sugandi Pennana, Norsialr Abd. Aziz & Abd. Razak Ja/far
Potential Urban Develop111ent Para111eters tlrat l?ed11ce Energy Consu111ptio11 in Residential Area
socio-economic and environmental characteristics which may influence the
energy consumptions.
Energy consumption in residential buildings depends greatly on the
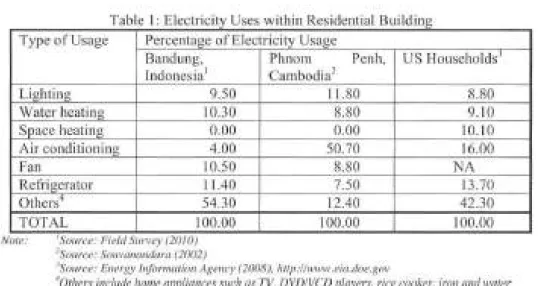
environment where the buildings are located. Table 1 shows the use of electricity in cities at different geographical locations.
Table 1: Electricity Uses within Residential Building Type of Usage Percentage of Electricity Usage
Bandung, lndonesia1
Lighting 9.50
Water heating 10.30 Space heating 0.00
Air conditioning 4.00
Fan 10.50
Refrigerator 11.40
Others4 54.30
TOTAL 100.00
Note: 'Source: Field S11rvey (2010) 2Source: So11va11a11dara (2002)
Phnom Penh, Cambodia2
11.80
8.80
0.00 50.70 8.80 7.50 12.40 100.00
3Source: E11ergy lnfor111a1ion Agency (2008), lrt1p:/hv1viv.eia.doe.gov
US HouseholdsJ
8.80
9.10 10. 10 16.00
NA
13.70 42.30 100.00
4
0tlrers incl11de ho111e appliances suclr as TV, DVD/VCD players. rice cooker, iron and water p11111p
Table 1 shows that the equipment for thermal comfort e.g. air conditioner or electrical ran is much lower in Bandung ( 14.5%) in comparison
to Phnom Penh (59.5%). The average temperature in Bandung is 26
°c
compared to Phnom Penh, which is 32°c.
The temperature in Bandung isrelatively low (20
°q
during night time, which is lower than thermal comfort(27
°q.
With this situation, the use of electricity for water heating is higher than that of Phnom Penh. This comparison shows how urban environment influences the energy use within residential buildings. One of the possiblecauses is the presence of urban heat from the concrete jungle.
Cities notoriously create urban heat island effects due to some possible
causes such as land surface and discharge of hot water from the use of air conditioner, and this causes unpleasant local climatic conditions and even imperils human health, especially for cities in climates with a distinctively hot
season (Alexandri and Jones 2008). Higher urban air temperature, due to urban heat island effect, influences cooling load of buildings (Santamouris et al. 2007). It is also found that urban canyons affect wind speed, wind flow and thermal comfort (Alexandri and Jones 2008; Santamouris et al. 2007). If the
PLANNING MALAYSIA Geospatial Analysis in Urban Planning
phenomenon is downscaled into individual residential buildings, the distance
between buildings disallow undisturbed wind flow and thereby lessen cooling
loads. Therefore, residential density and plot ratio become important factors of
the energy consumption, particularly for cooling purposesat household level.
This study defines the residential density as the numbers of residential buildings
contained within one hectare of land plot. The study also defines plot ratio as
the total floor area of residential buildings within one hectare of land plot.
Studies above verify the presence of passive interaction among
residential buildings, which is reflected by, among others, distance between the buildings and residential density. It also substantiates that the mixture of
buildings in urban texture may create higher cooling load and ultimately higher
urban energy demand. Urban texture features many forms of built and natural
environment. Some studies attempt to model urban areas with respect to urban vegetation and microclimates as offered by Sashua-Bar et al. (2006), Simpson
(2002), Sashua-Bar and Hoffman (2000) and Takakura et al. (2000). The above
aspects influence residential energy consumption, thus to reduce the energy
consumptiona passive strategy can be undertaken through development control.
The study attempts to revive the latent parameters of development control,
which has been in place for quite a long time towards harmonious urban
development, and expands the role of passive development control to another
dimension of residential energy consumption. The development control can be
applied through residential density and plot ratio. The objective of this control is
to passively influence the use of energy within residential buildings. The study
was carried out by using questionnaire survey.
METHODOLOGY
A household-based residential energy uses were investigated to accomplish a
comprehensive information on current energy consumptions in a residential
building for a given urban residential density and floor area to land ratio.
Research findings will provide the correlation between energy
consumption and urban parameters, particularly residential density and plot
ratio. Analysis on the correlation between residential density and energy
consumption at household level is expected to discover minimum energy
consumption for a particular residential density and plot ratio. If these two
correlations were substantiated, the residential density and plot ratios are
therefore viable tool for development control towards more efficient residential
energy consumptions in urban areas.
Ariva S11ga11di Per111a11a. Norsialr Abd. Aziz & Abd. Ra:ak Jajjar
Po1e111ial Urban Develop111e111 Para111e1ers f/r(lf Reduce Energy Cons11111ptio11 in Reside/Ilia/ Area
6,000.00
~
c
~
5,000.00:I:
•
•
~
c 4,000.00
0 ~
E
::J
VI 3,000.00
-c
•••
8
»
O>
~ 2,000.00 Ji
O> c :i2
1,000.00
0 0 y c 0 z
0.00
0 100 200 300
y = 0.017x2 -14 09x + 3593 3 R2 = 0 6019
400 500
Population Density (person/ha)
600 700
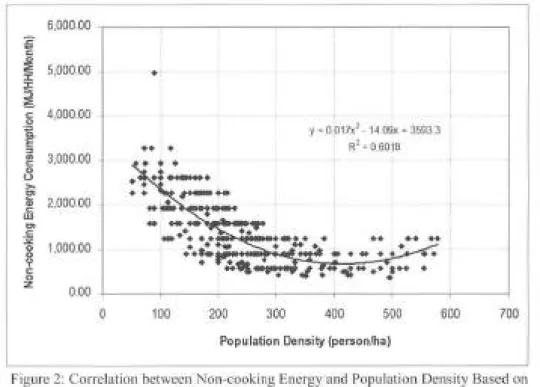
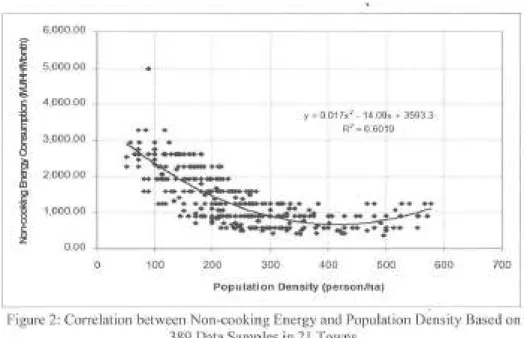
Figure 2: Correlation between Non-cooking Energy and Population Density Based on 389 Data Samples in 21 Towns
A structured questionnaire was randomly distributed to 750 respondents to gather the residential energy consumptions at household level (Figure I). The respondents of this study were proportionally and randomly distributed over 21 out of 26 towns within Bandung City. Five (5) towns were excluded due to similar physical and social performances of the towns, for example, the similarity in number of population, size and main activities. From 750 respondents, 389 responses were received during the survey.
ENERGY CONSUMPTION AT HOUSEHOLD LEVEL IN STUDY AREA
The total energy consumption in Table 2 gives an indication of household energy consumption in residential building in 21 towns in Bandung. Energy consumption figures shown in this table could be considered as primary energy use since the information was mainly from electricity bill (in Indonesian Rupiah, IDR, and then converted to energy unit). The use of gasoline or diesel in unit of volume (litre) was computed as transport energy use for the respondents who have private vehicles. For respondents who used public transports, the transport energy use was computed from their origin-destination distance and energy consumption of their public transport modes. Cooking
PLANNING MALAYSIA
Geospatial Analysis in Urban Planning
energy was computed from the use of LPG in the unit of weight (kg) as well as the use of electric cooking equipment.
Town
Table 2: Energy Consumption in 21 Townships of Bandung City Weighted Average Energy Consumption (MJ/HH/Month) Transport Non- Cooking Total Energy No
n-Energy cooking Energy Used cooking
Energy per Energy
Capita per m2 of building
:1r.!r!J
!..
_____
...
___
5-&92.
... ...
1..1.?..LS. .... _ __ 551 ... ..7-.1.?..?..~ ... 1..&?. ..8..
.... .
...
.
...
.
...
?..::!..?. ... ._l::f!.!'!..8~---_ 6, 718 1,9 5 8 _____ ,_7._?J,, ___ ...
..Y
,4Q_!_ ...?..J.Q.?_ __!!
_
8.2
.... .
Sukasari 6,595 1,356 671 8,622 1,826 9.32
Cicendo 4,659 1,583 653 6,895 1,400 12.61
_ BbkCiparay 6,056 1,545 §72 _ 8,273 1,546 11.37
Sumu r 8q!1_~~~'!.S.. _ _ ___Zz2 84 _h5...Q?. ______ ..§.?._?. ____ ...
J,
4 5_Q ___ _?._~?.2_______ ,_
j,:2?.
. __
.... '::!Jt..1.'.YJ ... 1!.~.'...~'.'!8 .... .. .
'.31?.9
..
?
...
~?..9:!~·-· _ .... 5.5-Q ... ...5-.?.}
.9?
...
.
..
.
...
1.2.?..?..~ .............?
.3 7 .. ~q'!~<!.§~!!..L .................... iz.~2..
?.
.
.
..
...
..
...
.
..
.
..
.
..
.
?..~.2 ... 5-.?.85-.&?.2.
..
..
..
..
}.? .. ?..~.1 ... ... 6.84 _ Ki O_!Econdf!.!±!L ... ----~,2 94 ... ?.~_?. ____ ... ?.5-.. 8. ... :!.~??.~--__ ...J~!..
8.?. ... -... 8. .. :~L__
Res.of ______ _l?..744 _I,_~ __ 6~_!_- 5, 77Q __
_h!..9?.
_
-·--....!1J....~Bandung We tan. 6, 102 2,0 I 2 726 8,840 1, 782 14.62
Coblong 5,722 1,368 692 7,783 1,559 10.32
Bandung_ Ku lo~---_ 2_&:?...!__ .--!..z..431 _ _ 2Ql.._~005 _ ~..!.i_-·
8.4L
.. !!..Pi.<!'!8..£C!E!f..l!!~L __ -·----~1~_5-J_ ,_I_,,,51-L_ ____ ?_?_8 ... __ .8.~?7-..
8. ... ____ -1._!,,~~L.... .. ... -2~§?.... ..
.. !!..<!i.<!'!S(<JJ:!:l!:J.4..1:!.L ... ... 5-.?.?.J.?... . ... .!.?..?..?..~ 660 ?.1:!.~..Q ....
J
.
1.
?.J..Q
1..Q:?.7-....
<;,,.~~r!:.~1.'.1:Y...!.'!8 .. ~!.~~.'!.L....
.
?.?.:!...92 ......L?.
..
7-
..
?. ...
..
...
...
.
...
?
..
?..'.! ...... ..?.?.?.1...Q ...... 1,589 ... ........?.:
..
?..?. .
.
.
_Q~qff:.q_s _____ ...
i
z
L?.L
___ _ I
1J
__
I I __ ---~_§..!.._ .. __ ..-2
&?.l
...
___
}...t.105___ ... _ . .J..Q.: ..U
... .
J!.atu!}-unggal 5,686 1,298 602 7,586 1,687 8.80
J!E.ndung Kidul 4,867 1,136 556 6,559 1,355 10.97
.!!f.!1!.E.acinta 5,390 1,218 582 7, I 90 1,577 I 0.68
Astanaanyar 7,090 1,352 635 9,077 1,798 6.86
Mean 5,195 1,302 620 7,169 1,519 9.59
Standard Dev l, 128 298 63 1,3 73 299 2.23
Source: Questionnaire Survey, January 2010
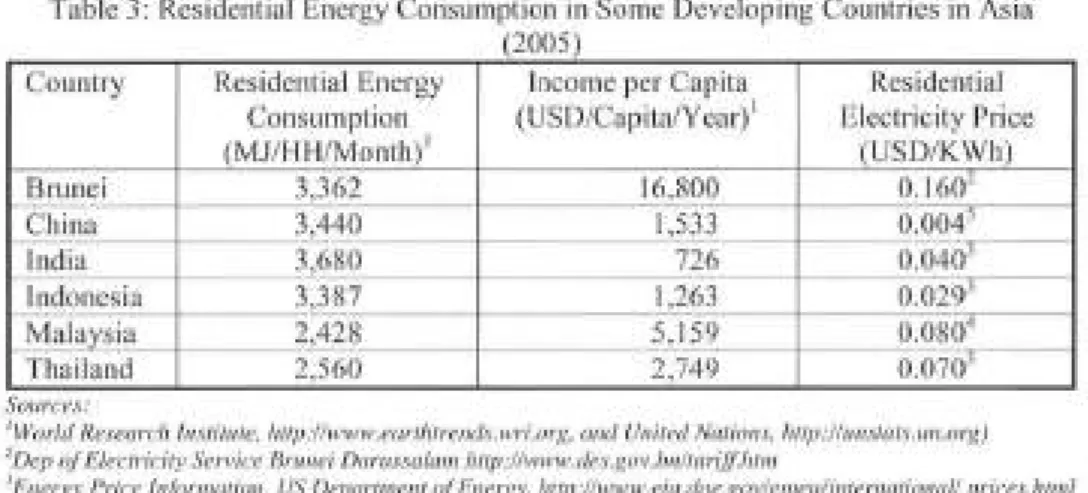
Table 3 shows comparison of residential energy consumption in selected developing countries in Asia. It shows that Ind.ia recorded the highest quantity of residential energy consumption in comparison to other countries even though its income per capita is relatively low. On the other hand, Malaysia and Thailand, who have higher income per capita than India, recorded lower residential energy consumption. Brunei and China recorded almost the same level of energy use although their incomes per capita differ widely. This international comparison is in contrary with the common belief that higher
Ariva S11gandi Pennana, Norsiall Abel. Azi: & Abel. Razak Jajfar
Potential Urban Development Parameters tllat Reduce Energy Consumption in Residential Area
income will lead to higher energy consumption, since it depends on the lifestyles of respective nations, as shown by examples of some Asian countries. At national or local level where almost similar lifestyle and behaviour exist, the correlation might perhaps valid.
Table 3: Residential Energy Consumption in Some Developing Countries in Asia (2005)
Country Residential Energy Income per Capita Residential
Consumption (USD/Capita/Y ear) 1 Electricity Price
(MJ/1-1I-I/Month)1 (USO/KWh)
Brunei 3,362 16&Q9 ______ 0.160L
·-·-·-·---·-·-·-·--··---· ·--·-·--·-·---- ·- 0.064
5 ____ ····-·-··-.. ··
China
---
- - -
31440 ---~- 115~}_ -·--
0.0401 ______
India 3,680 726
Indonesia--- 3,387 1.~.2~} __
-
-
0.029 ~--- --- --- --- ---
---
-
--
0. 080.r--·---Mala~~i.~--·-- 2,428
5-
,
1 ..~2--·-- - - 0. 0 7
0
3----·---Thailand 2,560 2,749
Source.I':
1World Researcll Institute, /11tp:!!w111w.eanlltre11d.uvri.org, and United Nations, ll11p://u11stats.1111.org)
2
Dep of Electricity Service Bmnei Darnssalam llttp://w1v111.des.gov.b11/tarijf.lltm
J Energy Price lnformatio11, US Department of Energy, /11tp://w1v1v.eia.doe.gov!eme11/i11tematio11al! prices.lltml
4
ASEAN Centre for Energy, llttp://111ww.aseanenergy.org!p11blicatio11s_statistics!elec1ricity_database/ malaysia02.111111
5Clli11a Daily ll11p:l!www.c/1i11adaily.co111.cn/englisllldoc/2005-02/ I 8/co111e111_ 4 I 7238.111m
There are numerous factors that influence the energy consumption in residential buildings. However, the purpose of this study is to correlate energy consumption with urban parameters as it intends to provide valuable inputs for urban planners. The urban parameters are population density, residential density and plot ratio, by keeping other parameters ceteris paribus.
From 389 respondents, there were 26 (6.7%) respondents with monthly
income less than 150 USO, and 190 (48.9%) respondents with monthly income
from 150 to 300 USO. While 132 (33.9%) respondents with monthly income
between 300 and 450 USO, 37 (9.5%) respondents with monthly income
between 450 and 600 USO, and 4 ( 1.0%) respondents with monthly income
greater than 600 USO. The income group interval of 150 USO was determined to closely represent and to obtain uniform distribution of the citizen's income in their respective income groups.
PLANNING MALAYSIA Geospatia/ Analysis in Urban Planning
CORRELATION BETWEEN ENERGY CONSUMPTION AND URBAN
PARAMETERS
To reinforce the argument, the study also analyses the correlation between transport energy, cooking energy and non-cooking energy at household level,
and the urban parameters. Of these, it seems that only non-cooking energy
consumption is strongly correlated with the urban parameters. Transport energy
particularly concerns only with geographical location between origin and destination, although other variables may also govern. Cooking energy is
apparently independent from these urban parameters, since cooking energy
depends mainly on lifestyle. The rationale behind non-cooking energy correlation with urban parameters can be simply explained by contrasting two comparable houses. Take two houses A and B with similar floor area but different household size. The house with larger household size will usually have higher non-cooking energy consumption than that with smaller household size. Therefore, energy consumption per floor area at house A is greater than at house
B.
Based on the above rationale, an attempt to validate the correlation between non-cooking energy consumption and urban parameters is carried out.
These parameters most likely contribute to energy consumption for lighting and
thermal comfort using air conditioning. Population and residential densities as well as plot ratio have no apparent contribution to cooking energies. However, to a certain extent, population density does affect transport energy consumption
(see for example Barter 1999; Newman and Kenworthy 1999). Transport
energy, as described earlier, is particularly affected by origin and destination as
Jun and Hur (2001) established in the study of a new town near Seoul where leap-frog development is predominant. User's awareness on the efficient use of energy is necessary to be included in the analysis, because of its paramount
importance in contributing to energy use. The difference in energy consumption
will be significant in household with and without adequate awareness on energy savmg.
Energy consumption in residential buildings is affected by a set of contributing factors such as income, floor area, thermal and visual comfort, building envelopes, and surrounding environment. Survey undertaken in the study area on energy consumption was actual use of energy at household level
rather than resulting from energy auditing. It was therefore independent from the contributing factors. Considering this state, it is then valid to associate energy consumption with the parameters such as population density, residential
density and plot ratio. This is the fundamental basis of the correlation between
energy consumption and urban parameters.
Ariva Suga11di Per111a11a, Norsiah Abd. Aziz & Abd. Razak Jaffar
Potential Urban Development Parameters that Reduce Energy Co11s1.1111ptio11 in Residential Area
Three hundreds and eighty nine (389) respondents of 21 Townships were included for the purpose of analysis. From the analysis, as depicted in
Figure 2, it is found that polynomial correlation with a quadratic function between non-cooking energy consumption and population density is the best fit to describe such correlation with coefficient of determination R 2=0.60 I 9. The figure depicts u-shape pattern of the correlation. Despite inadequate data for population density larger than 600 people/ha, it appears that at a certain population density, non-cooking energy consumption reaches a lowest level. It can be calculated by taking first derivative of the equation, which is y=0.017x2
-74.09x+3593.3, and dy!dx=0.034x-14.09=0, it gives y=414 people/hectare. At two ends of this point along the equation, higher energy consumption is shown. One logical explanation on this phenomenon is that the area with denser population allows energy sharing among the citizens. Sharing on light and entertainment, for example, are the most probable causes in denser population area. ln a place with sufficient lighting (luminance) for reading for one person, there is not necessary to add more luminance as the number of person increases. On the contrary, in lower density residential area, share lighting and entertainment will not be possible due to physical distance. One certainty in the study area is that most of the higher income households live in a relatively low population density area. Jn line with that, it is valid that the energy consumption for high income household .is also high. That is why the households living in
lower residential density areas consume more energy than their counterparts in
higher residential density areas.
6,000.00
I
5,000.00f
4,000.00
3,000.00
E
2,000.002'
1
1,000.00 0.00~---~---
-
---.
.
•••
0 100 200 300
y = 0.017x2
• 14.09x + 3593.3 R2 = 0.6019
400 500
Population Density (person/ha)
600 700
Figure 2: Correlation between Non-cooking Energy and Population Density Based on 389 Data Samples in 21 Towns
PLANNING MALAYSIA Geospatia/ Analysis in Urban P/a1111i11g
A scientific explanation of this phenomenon can be examined from two
sides; thermal comfort and lighting. With respect to thermal comfort, production
of heat is mathematically expressed by Q=AU(t1-t0) (Watson and Chapman,
2002), whereAis surface area, U is thermal transmittance, t, is room temperature and 10 is outside temperature. Consider a closed room with occupants. This
fo1mula implies that more occupants will require more energy to achieve
thermal comfort because A increases therefore
Q
also increases. At the sametime, the needs of lighting is generally constant as number of occupants increases. The need of energy for thermal comfort increases with the existence
of overcrowding, as revealed by a study unde1iaken by Johansson (2006), because of the impedance of air flow to achieve perfect ventilation. The impacts
of urban canyon and urban texture to this particular phenomenon may also be possible as demonstrated by Ratti et al. (2005) and Niachou et al. (2008).
Figure 2 was derived from the survey of the study area. Population densities were measured at city blocks where the respondents stay. City block was selected as a basis of population density calculation. The reason was that if
the calculation of population density was based on administrative unit or township, the result would not be accurate, because the residential areas are not proportionally distributed over the administrative unit or township in the study
area. The township was also too large for a basis of population density
calculation.
The above finding shows the importance of population density as a factor for consideration to accomplish energy efficient city. Urban planners may
ce11ainly need to consider including this variable in their city planning. However, a particular city must have an adequate data record to establish its
own correlations as discussed above. With sufficient information and knowledge on this particular factor, urban planners and managers are
well-informed on the precondition of city towards the achievement of energy efficient city.
Ariva S11ga11di Per111ana, Norsiah Abel. Aziz & Abd. Ra~ak Jajjar
Potential Urban Develop111ent Parameters that Reduce Energy Cons11111ptio11 in Residential Area
6,000.00
I
5,000.00 4,000.00i
~3,000.00
~
!
2,000.00~
j
1,000.00OOO
0 20
.
.
40 60 80
y = 0.3363x7 - 62.79x + 3588.8 R7 = 0.6103
100 120
Residential Density (building/ha)
•
•
•
140
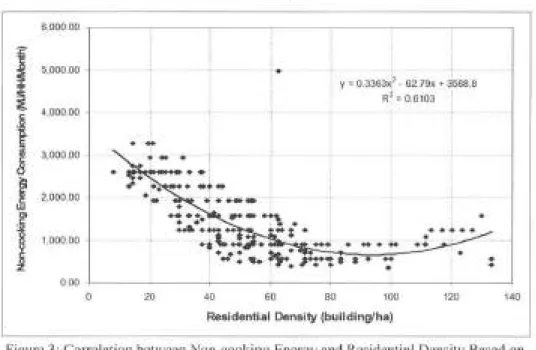
Figure 3: Correlation between Non-cooking Energy and Residential Densily Based on
389 Dala Samples of Energy Consumption in 21 Towns
Although population density may correlate to household size, but to
consider household size in establishing a correlation between population density and energy consumption may cause a bias, if the size of household varies greatly. To avoid this bias, an attempt to correlate residential density with energy consumption is carried out, because residential density is another essential factor which may influence the urban energy use. This variable is
somehow different with population density, because for the same population density, the residential density can be different. It depends also on household
size. Attempt is made to correlate this variable with energy consumption. The
correlation between residential density and energy consumption is shown in Figure 3.
Almost similar situation with population density exists. The best fit
correlation is a quadratic equation which carries a coefficient of determination of R2=0.6 I 03. The exact value of residential density, where the energy consumption is the lowest, can be derived with similar process as described
earlier. The equation of correlation is found to be y
=
0.3363.
x2
-
67.29 x +3588.8. Its derivative is equal to dyldx
=
0.6726x - 67.29=
0. This equationleads to x
=
93. With residential density about 93 buildings per hectare, ittheoretically returns the lowest energy consumption.
PLANNING MALAYSIA
Geospatial Analysis in Urban Planning
A scientific explanation can be employed to describe this phenomenon. Flor and Dominguez (2004) found that there is a correlation between the
surrounding environments of the urban area with the building. Again, it is
possibly due to urban canyon effect, urban texture and urban heat island phenomena. This phenomenon has an impact particularly on building's thermal
performance. Similar finding is also verified by Ghiaus et al. (2006). Even though the correlation is corroborated, but the use of derived value should be applied with caution.
The values should be used with careful attention to its validity. The
values are derived from a study on tropical city with certain urban
characteristics, and the values will only be valid with the following major
conditions;
• Concentric land use in nature, with high density mixed use in the centre and low residential density in the peripheral areas
• Leap-frog development with relaxed policy on residential development
• Having potential likelihood to achieve thennal comfort by passive
cooling
• Motorized travel dependent, with rudimentary services of public transport
• Having moderate level of awareness of the citizens on energy uses.
The correlation between energy consumption and residential density
will perhaps be misleading if the floor area of residential buildings greatly
varies. In case of samples of the buildings in the study area, there is
insignificant variation of floor area of the residential buildings. To confirm the above findings, the correlation between energy consumption and plot ratio is also established as shown in Figure 4.
Plot ratio shows the ratio between total floor areas of residential
building and total land areas at a given residential unit or block. From the figure, similar pattern with two previous correlations is found. Again, it shows that in a crowded area, where total area of the building's floor exceeds land area,
non-cooking energy consumption increases. The equation which gives a point
where energy consumption is the lowest is expressed by y=6933.7x2
-12178x+6060.6, taking its first derivative dyldx= 13867.4x-12178=0, it gives
x=0.88. With the value of floor area to land ratio of 0.88 and residential density
of 93 buildings per hectare, it theoretically gives the ideal residential building size for this city about 94 square meter. This size disregards the urban development forms where the residential buildings are located, since the samples were taken irrespective of residential development typology. Different
Aril'a S11ga11di Pen11a11a, Norsiah Abd. Aziz & Abd. Ra:ak Ja!far
Potemia/ Urban Develop111e11t Parameters that Reduce Energy Co11s11111ption in Residenrial Area
urban characteristics will lead to different results. Additional information will then be required if major characteristics of urban area is slightly different. The values cannot be used if major disparities exist. Major urban characteristics of
the study area restrain potential elements toward further minimizing urban
energy use.
6,000.00 ~---~---~---~---~---~---~
~ 5,000.00
~
~ ~ 4,000.00
8
'g_
5 ~ 3,000.00
~
~ 2,000.00
~
C:~ 1,000.00
0.00
0.00
·
--
-0.20 0.40 0.60
Plot Ratio
y 69l37x2 12178x 60606
I<' 06039
080 1 00 1.20
Figure 4: Correlation between Non-cooking Energy Consumption and Plot Ratio Based on 389 Data Samples in 21 Towns
The above three urban parameters namely population density,
residential density and plot ratio are substantiated to have correlation with
residential energy use e.g. non-cooking energy. By controlling these parameters, non-cooking energy consumption can be reduced, and therefore total urban
energy consumption can be reduced as well. Urban parameters arc essentially controllable and modifiable through existing urban planning instruments. The
policy to control the three urban parameters can be implemented by planning
tools. Population density, residential density and floor area to land ratio are potential urban development parameters those are so far dormant or neglected to be included in the strategies to control the constant increase of residential energy uses towards energy efficient city. This is basically reinventing
development control which gives another insight towards different dimension
other than conventional role of the development control. This ought to be
reflected in the present policies on energy efficient for urban development.
PLANNING MALA YSJA
Geospatial Analysis i11 Urban Pla1111i11g
POLICY IMPLICATIONS IN THE STUDY AREA
Land use and building control are two instruments which are conventionally
employed by most of cities in either developed or developing countries. City
authority in the study area also employs such instruments to manage urban
growth. However, ineffective implementation of these planning instruments has caused the urban management of Bandung City fruitless. Urban sprawling
which creates higher transport energy continues to expand. The inability of
buildings particularly residential buildings to adjust to local bioclimatic condition causes higher energy consumption of residential building. These are
examples of the inadequate policy and ineffective implementation of land use
and building control.
The finding of this study suggests that minimum energy consumption of residential building is achieved if urban population density is around 414 people/ha, residential density is around 93 buildings/ha, and plot ratio is around 0.88. By taking these findings as the rationale of the proposed strategies, it is
suggested that housing plot is orderly arranged with some amounts of free
space. Twelve percent of free space is required as optimum plot ratio is 88 per
cent. This finding also suggests a relatively uniform residential building size of
about 94 m2. These requirements can be integrated into existing policies or new
policies on land use and building control. Control on residential density and plot ratio is more pragmatic in comparison to controlling population density through building control strategies. Controlling population density seems impossible because of infringement of personal matter, for example limiting the household size.
The discussion shows that controlling residential density and plot ratio
are two potential and promising strategies towards lower residential energy
consumption. This is promising in a sense that it works at the root level of the
issues. It works indirectly in comparison to other direct strategies such as the
use of energy saver appliances, given that development control is carried 'out
appropriately. This strategy- can be synergistically carried out with other
strategies towards the achievement of energy efficient city and ultimately
sustainable city.
Ariva S11ga11di Per111a11a, Norsialr Abd. Aziz & Abd. Razak Ja.ffar
Po1e111ial Urban Development Para111e1er.1· rlrar Reduce Energy Co11.rn111p1io11 i11 Residenrial Area
REFERENCES
Alexandri, Eleftheria and Phil Jones. (2008). Temperature Decreases in an Urban Canyon due to Green Walls and Green Roofs in Diverse Climates.
Building and Environment, 43, 480-493.
Assimakopoulos, M.N, A. Tsangrassoulis, M. Santamouris, G. Guarracino. (2005). Optimum Geometry and Orientation of a Building Opening with
an Electrochromic Glazing. Proceeding of International Conference "Passive and Low Energy Cooling for the Built Environment'', Santorini,
Greece, pp. 885-890.
Barter, Paul. ( 1999). An International Comparative Perspective on Urban
Transport and Urban Form in Pacific Asia: the Challenge of Rapid
Motorization in Dense Cities. The Institute for Sustainability and
Technology Policy, Murdoch University, Australia.
Flor, FS de la and SA Dominguez. (2004). Modeling Microclimate in Urban
Environments and Assessing its Influence on the Performance of
Surrounding Buildings. Energy and Building 36, 403-413.
Gems, V., M. Santamouris, S. Karatasou, A. Tsangrassoulis and N. Papanikolaou. (2005). On the Cooling Potential of Night Ventilation Techniques in the Urban Environment.Energy and Building, 37, 243-257.
Ghiaus C, F Allard, M Santamouris, C Georgakis, F Nicol. (2006). Urban
Environment Influence on Natural Ventilation Potential, Building and
Environment, 41 :395-406.
Johansson, Erik. (2006). Influence of Urban Geometry on Outdoor Thermal
Comfort in a Hot Dry Climate: A study in Fez, Morocco. Building and
Environment, 41(10), 1326-1338.
Jun, Myung-Jin and Jae-wan Hur. (2001). Commuting Costs of "Leap-frog" New Town Development in Seoul. Cities 18(3), 151-158.
Leitmann, Josef. ( 1999). Sustaining Cities: Environmental Planning and
Management in Urban Design. McGraw-Hill, New York.
Newman, Peter and Jeffrey Kenworthy. ( 1996). Reducing Automobile
Dependence. Environment and Urbanization, 8( I), 67-92.
Niachou, K., I. Livada, M. Santamouris. (2008). Experimental Study of Temperature and Airflow Distribution Inside an Urban Street Canyon
During Hot Summer Weather Conditions- Part I: Air and Surface
Temperatures. Building and Environment, 43, 1383-1392.
Ratti, C., N. Baker and K. Steemers. (2005). Energy Consumption and Urban
Texture. Energy and Buildings 37, 762-776.
Santamouris, M, C. Gerogakis and A. Niachou. (2007). On the Estimation of Wind Speed in Urban Canyons for Ventilation Purposes. Part two: Using
of Data Driven Techniques to Calculate More Probable Wind Speed in
PLANNING MALAYSIA
Geospatial Analysis in Urban Pla1111i11g
Urban Canyons for Low Ambient Wind Speeds. Building and Environment, 43(8), 1411-1418.
Sashua-Bar, L., and M.E. Hoffman (2000). Vegetation as a Climatic Component in the Design of an Urban Street: An Empirical Model for Predicting the
Cooling Effect of Urban Green. Energy and Buildings, 31, 221-235.
Sashua-Bar, Limor, Milo E. Hoffman, Yiga!Tzamir. (2006). Integrated Themlal
Effects of Generic Built Forms and Vegetation on the UCL
Microclimates. Building and Environment, 41, 343-354.
Simpson, James R. (2002). Improved Estimates of Tree-shade Effects on
Residential Energy Use. Energy and Buildings, 34, 1067-1076.
Souvananda, Nou. (2002). Household use analysis and forecasting: The case of
Phnom Penh Cambodia. Unpublished Master Thesis.Joint Graduate School of Energy and Environment, King Mongkut Institute of
Technology, Thonburi, Thailand.
Takakura, T., S. Kitade and E. Goto. (2000). Cooling Effect of Greenery Cover over a Building. Energy and Buildings, 31, l-6.
Tantasavasdi, Chalermwat, Jelena Srebric, Qingyan Chen. (2001). Natural
Ventilation Design for Houses in Thailand. Energy and Buildings, 33, 815-824.
United Nations. (2006). World Urbanization Prospects.2005 revision. UN Population Division, New York. Working Paper No.ESNP/WP/200. Wackernagel, M. and Rees, W.E. (1996). Our Ecological Footprint: Reducing
Human Impact on the Earth. New Society Publishers, Gabriola Island,
British Columbia, Canada.
Watson, Richard D. and Kirby S. Chapman. (2002). Radiant Heating & Cooling
Handbook.McGraw-Hill Handbooks, New York.
West, Shane. (2001). Improving the Sustainable Development of Building Stock
by the Implementation of Energy Efficient. Climate Control Technologies. World Commission on Environment and Development. (1987). Our Common
Future. Oxford University Press, Oxford.
INTERNET SOURCES:
World Research Institute, http://www.earthtrends.wri.org, and United Nations.Available online at http://unstats.un.org). Retrieved on 8 August
2010
Department of Electricity Service Brunei Darussalam, available online at
http://www.des.gov.bn/tariff.htm. Retrieved on 8 August 2010
Energy Price Information, US Department of Energy.Available online at
http://www.eia.doe.gov/emeu/international/ prices.html. Retrieved on 8 August 2010
Aril'a Sugandi Per111a11a, Norsiali Abd. A~i: & Abd. Ra:ak Jaffar
Potelllial Urban Develop111e111 Parameters that Reduce Energy Cons11111ptio11 in Residential Area
ASEAN Center for Energy.Available on line at
http://www.aseanenergy.org/publ ications _statistics/electricity_ database/
malaysia02.htm. Retrieved on 8 August 2010
China Daily.Available on line at
http://www.eh inadai I y.com.cn/engl ish/doc/
2005-02/18/content_ 417238.htm.Retrieved on 8 August 20 I 0.