VOLUME XIV (2016), Page 81 - 94
NEIGHBOURHOOD SATISFACTION AND QOUL IN MIDDLE- INCOME HOUSING IN KUALA LUMPUR CITY, MALAYSIA
Mohammad Abdul Mohit1 & Mohamed Sajid Ali2
1Kulliyyah of Architecture and Environmental Design INTERNATIONAL ISLAMIC UNIVERSITY MALAYSIA
2CRN RAO (PVT) LTD, CHENNAI, INDIA
Abstract
This paper is based on the subjective perception of the residents about the neighbourhood environment and their quality of urban life. The neighbourhood satisfaction provides a generalized view into the well-being of the residents, and it has been viewed as a significant aspect of the quality of urbanlife (QOUL). As a contributor to life satisfaction, neighbourhood satisfaction is influenced by individual and household socio-economic variables, along with the neighbourhood characteristics. However, there is limited understanding of how neighbourhood environments influence neighbourhood satisfaction and the quality of urban life. This paper intends to examine the relationship between residents’ neighbourhood satisfaction and their quality of urban life in a middle-income housing area in Kuala Lumpur City, Malaysia, by using 100 sample respondents that fulfilled a confidence level of 90% of the population. The findings of the study indicate that the residents are satisfied with their existing QOUL, but if no actions are taken it will deteriorate. Therefore, several recommendations are made for improving the residents’ QOUL.
Keyword: Neighbourhood satisfaction, Quality of Urban Life (QOUL);
INTRODUCTION
Malaysian economy has grown steadily in the past three decades transforming the country into a middle-income nation from an agriculture and commodity-based economy. The per capita GDP has increased significantly, and the urban population in the country has increased from 25% in 1960 to 72% in 2010. It is projected that 86% of the population will be urbanised by 2050 (United Nations, 2012). The rapid urban growth has led to a significant pressure on local and state governments on providing urban infrastructures that are intended to improve the quality of urban life. The Malaysian Quality of Life Index (MQLI) has been developed in 1999 by the Economic Planning Unit (EPU) with eleven components. Although the overall MQLI has increased by 7.0 points during 1990 to 2000 and further to another 11.9 points from 2000 to 2010, there exists a regional variation among different states with the Federal Territory of Kuala Lumpur having the highest quality of life index (Mohit, 2013b). This achievement of Kuala Lumpur can be attributed to it being the national capital and the vision of the City plan 2020 to be “a world class city” in which good quality of life is emphasised. Most studies of quality of life (QOL) in Malaysia present subjective analysis and there is a lack of literature that could explain the relationship between the neighbourhood satisfaction and quality of urban life (QOUL) in different housing areas of Kuala Lumpur City. Therefore, this paper intends to examine the relationship between neighbourhood satisfaction and QOUL in terrace housing through a case study in Kuala Lumpur City, Malaysia.
OBJECTIVES
The aim of the study is to determine the relationship between neighbourhood satisfaction and quality of urban life through the following objectives:
a. To investigate the level of satisfaction of the residents about the neighbourhood and quality of urban life.
b. To explore the relationship between neighbourhood satisfaction and quality of urban life.
c. To identify the key determinants of neighbourhood satisfaction and quality of urban life.
d. To suggest measures towards improving the neighbourhood satisfaction level and hence, the quality of urban life.
LITERATURE REVIEW
Quality of Life (QOL) and Quality of Urban Life (QOUL)
1997). Different people in different parts of the world have defined QOL differently based on their cultures, social environment and level of economic development (Mohit, 2013a).
In spite of this, World Health Organization (WHO) has prepared a cross-culturally comparable quality of life assessment instrument called WHOQOL-BREF, and defines QOL as-
“An individual’s perception of his/her position in the context of culture and value systems in which they live in and in relation to their goals, expectations, standards and concerns. It is a broad ranging concept incorporating in a complex way, the person’s physical health, psychological state, level of independence, social relationships, personal beliefs and relationships to salient features of the environment” (WHOQOLGroup, 1998).
As the world is becoming rapidly urbanised, it is estimated that more and more people will be living in urban areas. As the urban population grows, maintaining the quality of life in the urban areas becomes more difficult, and it becomes a matter of concern. Therefore, studies on quality of life in urban areas become a necessity as QOL can –
a) Provide the necessity for public action (Dahmann, 1985), (Lu, 1999); b) Affect the liveability of urban areas and provide a set of indicators that
help policy makers and planners to assess the effectiveness of their policies (Marans, 2012);
c) Impact the choice for residential location in the city (Golledge & Stimson, 1987); and
d) On a broader scale affect the patterns of regional migration, economic growth, and environmental sustainability (Kemp et al., 1997).
that where people live, will influence their lives and, therefore, their overall QOL (Marans & Stimson, 2011).
Neighbourhood Satisfaction and Quality of Life
The concept of neighbourhood satisfaction is very much linked with the quality of life studies (Sirgy & Cornwell, 2002). Researchers often use these two terms interchangeably. The neighbourhood satisfaction and quality of life ultimately measure different aspects, both of which are important to urban planners and policy makers. Morris and Winter (1978) pointed out that a family evaluates a neighbourhood based on the following normative criteria: (a) the area should be predominately residential; (b) it should be accessible to quality schools; (c) the area should have quality of streets and roads; and (d) it should have homogeneity regarding social class, race, and ethnic group. Thus, Lu (1999) contends that neighbourhood satisfaction has been shown to be an important predictor of housing satisfaction. Residential satisfaction does not only rely on the dwelling units itself; neighbourhood plays an important role in residential satisfaction (Nurizan & Hisham, 2001; Salleh, 2012).
Studies have found that neighbourhood dissatisfaction, however, occurs about distances travelled to school by children, to employment and medical centres and the geographical location of housing estates. Also accessibility to the public transportation, community and shopping facilities and physical environment variables were identified as predictors of neighbourhood satisfaction. Another author has thus observed that location characteristics are important considerations for understanding the formation of residential satisfaction among public housing tenants. While housing is likely to be a source of satisfaction, neighbourhood conditions such as level of crime (Mulligan et al., 2004) or lack of amenity or industrial development or workplace location, are likely to be the sources of neighbourhood dissatisfaction. Alison, et al. (2002) contend that although socio-demographic factors were much less important than residents’ perceptions in helping to predict neighbourhood dissatisfaction, the type of neighbourhood remained a significant independent predictor of dissatisfaction even when the residents’ views were taken into account.
Yancy (1971), in a study of Pruitt-Igo, St. Louis, remarked that the main reason for the failure of Pruitt-Igo, was the lack of neighbourhood cohesion and social order associated with the dissatisfaction of the neighbours. Djebarni and Al-Abed (2000), in their study of public low-income housing in Sana’a, Yemen, found that the residents attach great importance to the level of satisfaction with their neighbourhood, particularly with the privacy that reflects the cultural background of Yemeni society.
well-being, rather than actual conditions of the neighbourhood itself. The neighbourhood quality of life can be conceptualized as aspects of the residents’ living situation that enable them to feel better, maintain independence, and physically, mentally, and socially improved (Fisher & Fuzhong, 2004). Assessing quality of life from neighbourhood satisfaction has been studied by Oktay and Ahmet (2011) in the walled city of Famagusta. There are different methods by which the relationship between neighbourhood satisfaction and quality of life can be established. For example, Sirgy & Cornwell (2002) tested three hypotheses while trying to find a relationship between the two.
Studies on the relationship between neighbourhood satisfaction and life satisfaction presents mixed findings. Oktay et al (2009) found no relationship between neighbourhood satisfaction and the QOUL in the walled city of Famagusta, North Cyprus. On the contrary, Sirgy and Cornwell (2002) analysed three models to examine the relationship between neighbourhood satisfaction and life satisfaction, and found that the relationship is positive through some mediating variables. In Dhaka, Bangladesh, it was found that the overall socio-physical features of the neighbourhood and community influence life satisfaction more than the physical features of the individual dwelling (Mridha & Moore, 2011). Sedaghatniaet.al (2013) studied the QOL and neighbourhood satisfaction in a mixed use high density neighbourhood in Kuala Lumpur city centre, and found that 68% of the residents were satisfied with the overall QOL while 32% were not.
The foregoing review of empirical studies about the relationship between neighbourhood satisfaction and QOL indicates that there are mixed findings. Therefore, there are opportunities for further research towards investigating the relationship between neighbourhood satisfaction and QOL that can be pursued by housing types, tenures, countries and cultures and that further research are required to determine QOUL on case-specific context to guide the directions of housing and urban public policies (Mohit, 2014).
METHODOLOGY
Methodology is a systematic approach adopted to explain about the research design, sampling frame, techniques of data collection and analysis.
Research Design and Sampling Frame
environment and the quality of life. For measuring the satisfaction levels, a five-point Likert-scale with ‘1=very unsatisfied…5=very satisfied’, was used. Based on the literature review, three types of variables -dependent, independent, and control, were used in the research design. The dependent variables are overall satisfaction levels. The independent variables are the physical, social and the economic conditions of the neighbourhood. The control variables are the demographic and socio-economic characteristics of the respondents.
By using a confidence level of 90%, the sample (n) required for a population of 4725 (N= Study area population) was 99, but we used 100 respondents/ residents for survey. Due to time and budget constraints, it was not possible to increase the sample size. This is one of the limitations of the study. Many researchers have argued that, the quality of any entity has a subjective dimension that is perceptual as well as having an objective reality. Therefore, both objective and subjective components of QOL are necessary to provide an understanding of it (Marans, 2012). Hence, in this study, assessment of residents’ quality of life was done through their subjective well-being as it is closely related to the ways residents perceive or evaluate their neighbourhood condition to achieve life satisfaction.
Data Collection
Two types of data - primary and secondary were collected for this study. The primary data was obtained through observation, interview and questionnaire survey. A questionnaire was developed with five sections. Section-1 contained the demographic and socio-economic characteristics of the respondents. Section-2 was about the satisfaction with the physical features/ conditions of the neighbourhood. Section-3 was about the satisfaction with the social conditions of the neighbourhood. Section-4 was about the satisfaction with the economic conditions of the neighbourhood. Section-5 contained three questions, viz., their house, neighbourhood and QOUL. A total of 110 questionnaires were used for the survey, but ten questionnaires were rejected as they contained defective responses. The survey was carried out during weekends for two months i.e. December 2012 and January 2013.
Data Analysis
Study Area and Limitations of the Study
The housing area selected for study is Setiawangsa - an eastern suburb of Kuala Lumpur City that is located less than 4 kilometres from the city centre. The study was carried out in one type of housing, i.e., the middle-income terrace housing. Because of time and resource constraints, the study was limited to 100 samples from a population of 4725 middle-income families. However, the study cannot be used to generalise the phenomenon. For generalization, further studies in different parts of the city and covering other types of houses are required.
FINDINGS AND ANALYSIS
Socio-Economic and Demographic Characteristics
The majority of the respondents (84%) were male and a majority of them (56%) were between 21 to 50 years of age followed by 26% who were in the age group of 51-60 years. Only 5% of the respondents were more than 60 years. Whereas 60% of the respondents were married, 37% of the respondents were single/unmarried with 3% who were widowed/divorced. 84% of the respondents were Malays followed by 8% Indian, 3% Chinese, and 5% of other races. Whereas 62% of the respondents were Graduates/Diploma holders, 18% completed SPM (O’ level) followed by 13% who had postgraduate degrees. 3% of the respondents completed STPM (A’ level) while another 3% completed Ph.D. degree, and only 1% had other educational qualifications.
The majority (34%) of the respondents were in others job category, followed by 32% professional/technical job holders and 15% occupied managerial/administrative positions while 12% were involved in business. The mean household size was 5.4. The mean earning members in the household is 2.5. While 73% of the respondents had more than RM5000 as monthly household income, 11% reported having monthly household income of RM3001 - RM4000. The rest 26% had income below RM3000. The majority of the respondents (84%) were house owners and 16% were renters. Also, 91% of the respondents owned at least one car while only 9% did not own a car. The mean age of respondents’ houses is 16.8 years. The mean residency is 12.8 years.
Satisfaction with the Physical Conditions of the Neighbourhood
Finally, the satisfaction level for crowding in the neighbourhood is also at moderate level with a mean of 3.5. The correlation coefficients (r) show that except the variable of noise level, all seven variables representing physical conditions of the neighbourhood, have significant positive correlations with satisfactions with overall neighbourhood physical conditions.
Satisfaction with the Social Conditions of the Neighbourhood
Residents’ satisfaction with the social features and conditions of the neighbourhood shows that the MSS with the overall social condition is 3.7 - slightly over a moderate level. Respondents rated a high score of satisfaction on privacy at home (MSS=4.00), followed by the neighbourhood cohesion and race relations in the community, in which the MSSs are 3.8 each. Social interaction with neighbours and ties with people in the community, both have the same MSS of 3.7, while the MSS for outdoor play spaces/open spaces of the neighbourhood is 3.6. Respondents revealed relatively lower satisfaction levels with crime (MSS=3.3) and safety (MSS=3.5) in the neighbourhood. The variables of the component have significant positive correlations (r) with satisfaction with neighbourhood social condition. However, safety, race relations, people living, and open spaces, have higher (r) values than the other variables in the component.
Satisfaction with the Economic Conditions of the Neighbourhood
Residents’ satisfaction with economic conditions of the neighbourhood shows that the MSS for the overall economic conditions is 3.7 - slightly above the moderate level. MSS with the value of the house has a mean of 4.00 which indicates a high level of satisfaction. Respondents’ MSS to all other economic indicators of the neighbourhood like socio-economic status, neighbourhood improvement/ development and the cost of living, are at moderate level with MSS ranging from 3.5 to 3.7. The correlation coefficients (r) show that all the variables have significant positive correlations with the component. However, improvement, management, socio-economic status and value of the house, have higher correlations with the component compared with cost of living.
Residents’ Satisfaction with the Home, Neighbourhood and the QOUL
Table 1. Distribution of residents’ satisfaction with QOUL Satisfaction with Ve ry u n sa ti sfie d (% ) Un sa ti sfie d (% ) S li g h tl y sa ti sfie d (% ) S ati sfie d (% ) Ve ry S ati sfie d (% ) M ea n
S.D Pea
rso
n
(
r
)
The home - 1 12 50 37 4.2 0.7 .42**
Neighbour-hood
1 - 21 55 23 4.0 0.7 .40**
QOUL - 5 22 61 12 3.8 0.7 1.00
Source: Field Survey, 2012-13. Note: **Significant at 0.01 level (2-tail).
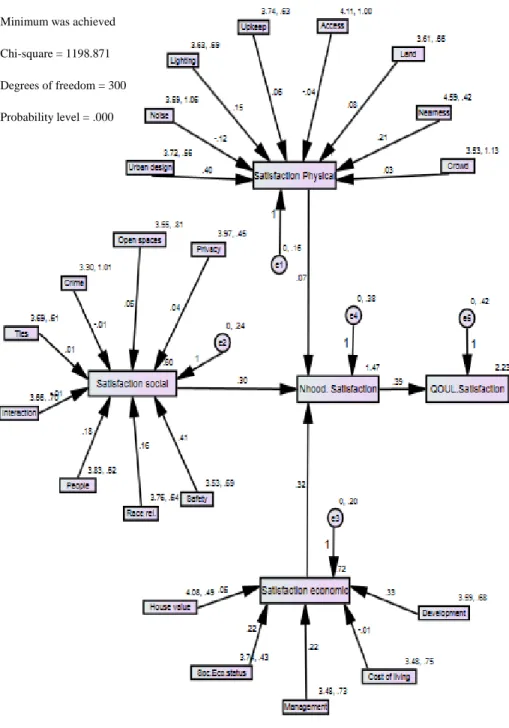
STRUCTURAL EQUATION MODELING (SEM)
Structural equation modelling uses confirmatory factor analysis. It is hypothesised that QOUL depends on the satisfaction with neighbourhood which in turn is dependent on the satisfactions of various physical, social and economic conditions of the neighbourhood. The model is “Fit” since the minimum is achieved. The variables were classified into two types based on the hypothesis as observed endogenous variables and observed exogenous variables. Observed endogenous variables are the dependent variables, and these are - satisfaction with physical neighbourhood features, satisfaction with neighbourhood social conditions, satisfaction with neighbourhood economic conditions, satisfaction with neighbourhood and satisfaction with QOUL.
The regression weights obtained from the path analysis in the model (Table 2) shows that the satisfaction score of the neighbourhood physical features is highly dependent upon the urban design/aesthetics of the neighbourhood with a value of 0.40, followed by the variable of nearness to facilities having a value of 0.21. Lower regression weights ranging from .03 to 0.15 were obtained with street lighting, landscape/greenery, Upkeep of the housing area, and crowding in the neighbourhood. The remaining two factors - access to public transport and noise level in the neighbourhood have the negative effect upon physical features of the neighbourhood.
Satisfaction with economic conditions of the neighbourhood is most affected by neighbourhood developments/improvements with a regression weight of 0.33. Socio-economic status and management/maintenance of the neighbourhood has a regression weight of 0.22. The value of the house in the neighbourhood has a regression weight of 0.05. The only factor which has a negative value (-0.01) is the cost of living in the neighbourhood.
Figure 1 Structural Equation Model
Source: Data analysis Minimum was achieved
Chi-square = 1198.871
Degrees of freedom = 300
Table 2: Regression weights obtained from path analysis of SEM
Estim
ate S.E. C.R.
p
SOC.CONDITIONS <--- PRIVACY .04 .07 .54 .59
SOC.CONDITIONS <--- INTERACTION -.01 .06 -.21 .84
SOC.CONDITIONS <--- TIES .01 .06 .09 .93
SOC.CONDITIONS <--- OPENSPACES .06 .05 1.14 .25
SOC.CONDITIONS <--- SAFETY .41 .06 6.96 ***
SOC.CONDITIONS <--- CRIMELEVEL -.01 .05 -.12 .90 SOC.CONDITIONS <--- COM.COHESION .18 .06 2.94 .00 SOC.CONDITIONS <--- RACERELATIONS .16 .06 2.65 .01 ECO.CONDITIONS <--- MANAGEMENT .22 .05 4.22 *** ECO.CONDITIONS <--- HOUSEVALUE .05 .06 .75 .45
PHY.FEATURES <--- CROWDING .03 .04 .83 .40
PHY.FEATURES <--- NEARNESS .21 .06 3.40 ***
PHY.FEATURES <--- UPKEEP .06 .05 1.15 .25
PHY.FEATURES <--- PUB.TRANS -.04 .04 -.92 .36 PHY.FEATURES <--- URBANDESIGN .40 .05 7.30 ***
PHY.FEATURES <--- NOISE -.12 .04 -2.94 .00
PHY.FEATURES <--- LANDSCAPE .08 .05 1.66 .10
PHY.FEATURES <--- LIGHTING .15 .05 3.12 .00
ECO.CONDITIONS <--- DEVELOPMENT .33 .05 6.21 *** ECO.CONDITIONS <--- COSTOFLIVING -.01 .05 -.17 .87 ECO.CONDITIONS <--- SOC.ECO.STATUS .22 .07 3.19 .00 NHOOD.SATISFACTION <--- SOC.CONDITIONS .30 .10 2.97 .00 NHOOD.SATISFACTION <--- PHY.FEATURES .07 .11 .62 .53 NHOOD.SATISFACTION <--- ECO.CONDITIONS .32 .11 2.92 .00 QOUL.SATISFACTION <--- NHOOD.SATISFACT
ION
.39 .10 4.06 ***
S.E = Standard Error, C.R= Critical Ratio, p = Probability
Source: Field Survey, 2012-13.
CONCLUSION AND RECOMMENDATION
As a contributor to life satisfaction, neighbourhood satisfaction is influenced by individual and household socio-economic variables, along with neighbourhood characteristics. The study found that among the three neighbourhood factors - satisfactions with physical, social and economic conditions, satisfaction with the economic conditions are highly correlated, followed by the physical conditions with the neighbourhood satisfaction. The least effect is by satisfaction with the social conditions of the neighbourhood. But all three factors have positive effects on the satisfaction with the neighbourhood. Satisfaction with the overall quality of urban life is influenced positively by the overall satisfaction with the neighbourhood.
Although, for most of the factors, the respondents are very satisfied, there
a. Density of people in new residential developments should reduce crowding with which the residents are found just satisfied.
b. More surveillance measures should be undertaken to reduce crime and enhance neighbourhood safety to enhance residents’ satisfaction with them. c. The management/ maintenance of the neighbourhood should be improved to
enhance neighbourhood satisfaction and QOUL.
d. Finally, public participation and consultation must be undertaken by the authorities for future planning and development.
Overall, the residents were moderately satisfied with the existing QOUL. But if no further actions are taken, it may deteriorate. So the following recommendations are made for improving the QOUL.
a. Since the relationship between QOUL and neighbourhood is established from the findings, steps to improve the neighbourhood satisfaction must be undertaken by the local authorities.
b. Assessments of QOUL should be made from time to time by the local authorities as the needs of people might change with time.
c. Since economic factors are vital to affect QOUL compared to other factors, the government should take necessary measures to improve the economic conditions of residents so the overall quality of life of the people in general can improve.
REFERENCES
Alison, P., Kearns, A. & Atkinson, R. (2002). What makes people dissatisfied with their neighbourhoods? Urban Studies, 39(13), 2413–2438.
Cummins, R. A. (1997). Comprehensive Quality of Life Scale: Manual. Melbourne: Deakin University.
Dahmann, D. C. (1985). Assessments of neighborhood quality in metropolitan America.
Urban Affairs Quarterly, 20(4), 511–535.
Djebarni, R. & Al-Abed, A. (2000). Satisfaction level with neighbourhood in low-income public housing in Yemen. Property Management, 18(4), 230–242.
EPU (2012). The Malaysian quality of life index 2011. Putrajaya: EPU, Prime Minister's Department.
Fisher, K. & Fuzhong, L. (2004). A Community-based walking trail to improve neighborhood quality of life in older adults: a multilevel analysis. Annals of Behavioral Medicine, 28 (3), 186-94.
Galster, G. C. & Hesser, G. (1981). Residential satisfaction: compositional and contextual correlates. Environment and Behavior, 13(6), 735-758.
Golledge, R. G. & Stimson, R. J. (1987). Analytical Behavioural Geography. London: Croom Helm.
Kemp, D., Manicaros, M., Mullins, P., Simpson, R., Stimson, R. & Western, J. (1997).
Sustainability of South East Queensland. Brisbane: The Australian Housing and Urban Research Institute.
Lu, M. (1999). Determinants of residential satisfaction: Ordered logit vs. regression models. Growth and Change, 30(Spring), 264–287.
Marans, R. (2012). Quality of urban life studies: an overview and implications for environment-behavior research. Procedia-Social and Behavioural Sciences, 35, 9-22.
Marans, R. & Stimson, R. (2011). Investigating Quality of Urban Life: Theory, Methods, and Empirical Research (Social Indicators Research Series 45 ed.). London: New York: Springer Science+Business Media.
Mohit, M.A. (2014). Present trends and future directions of quality of life. Procedia - Social and Behavioral Sciences, 153, 655-665.
Mohit, M.A. (2013a). Quality of life in natural and built environment – an introductory Analysis.Procedia - Social and Behavioral Sciences, 101, 33-43.
Mohit, M.A. (2013b). Objective analysis of variation in the regional quality of life in malaysia and its policy implications. Procedia - Social and Behavioral Sciences,
101, 454-464.
Morris, E.W. & Winter, M. (1978). Housing, Family and Society. New York: Wiley. Mridha & Moore (2011). The QOL in Dhaka, Bangladesh: Neighbourhood qualty as a
major component in residential satisfaction. In R. Marans & R. Stimson (Eds.),
Investigating Quality of Urban Life: Theory, Methods, and Empirical Research. Social Indicators Research Series 45, (251-272). Springer Science+Business Media.
Mulligan, G., Carruthers, J. & Cahill, M. (2004). Urban quality of life and public policy: A survey. In R. Capello & P. Nijkamp (Eds.), Advances in urban economics
(729–802). Amsterdam: Elsevier Science B.
Oktay, D. & Ahmet, R. (2011). The quality of urban life and neighborhood satisfaction in Famagusta, Northern Cyprus. In R. Marans, & R. Stimson (Eds.),
Investigating Quality of Urban Life: Theory, Methods, and Empirical Research. Social Indicators Research Series 45, (233-249). Springer Science+Business Media
Salleh, A. (2012). Sustainable urban neighborhoods: the need to consider residents‟ satisfaction. OIDA International Journal of Sustainable Development , 3(10), 103-108.
Sedaghatnia, S., Lamit, H., Ghahramanpouri, A. & Mohamad, S. (2013). An Evaluation of residents' quality of life through neighbourhood satisfaction in Malaysia.
Environmental Management and Sustainable Development, 2(1), 114-125. Sirgy, M. & Cornwell, T. (2002). How neighborhood features affect quality of life. Social
Indicators Research, 59, 79-114.
United Nations (2012). World Urbanization Prospects, the 2011 Revision. New York: United Nations.
WHOQOLGroup (1998). The world health organization quality of life assessment(WHOQOL): development and general psychometric properties.
Social Science and Medicine, 46(12), 1569-85.