Hungarian Association of Agricultural Informatics European Federation for Information Technology in Agriculture, Food and the Environment
Journal of Agricultural Informatics. Vol. 6, No. 4 journal.magisz.org
Formal network analysis of a food supply chain system: a case study for the
Italian agro-food chains
Flavia Clemente1, Piero A. Nasuelli1, Rodolfo Baggio2
I N F O Received Accepted Available on-line Responsible Editor:
Keywords:
food supply chain, milk and dairy products, beef and pork meat, network analysis
A B S T R A C T
This paper approaches the analysis of supply chains of products of animal origin from various productive species by using network analytic methods.In the studied analysis the supply chains are embedded in a single model which highlights all the interconnections that have little evidence in traditional models. The complex network is studied analyzing the matrix that constitutes the network with algorithms and methods extensively tested and validated. This analytical approach has already been applied with positive results in many research areas such as social networks, transport networks, the stylistic of writers and musicians, proteomics, pharmacology, medicine, biology and many others. We apply this methodology to supply chains of products of animal origin and show a series of preliminary results. This method of study of food supply chains could be useful for an observatory,bringing to light slightly evident relations and becoming a strong support for policy-makers. It can also provide useful advices to individual actors on how to optimize their own supply chains. Finally, through an effective enumeration and evaluation of the relationships, a network model could be helpful in design of tracking and traceability systems.
1.
Introduction
In literature, there are various approaches to the study of supply chains. Among the best known are the anglophone Global Commodity Chain (GCC) and the francophone filière tradition. The first was developed by Gary Gereffi and others within a political economy of development (and underdevelopment) perspective, derived from Wallerstein’s (1974) World Systems Theory. Hopkins and Wallerstein (1986, 1994) define the notion of a commodity chain as a network of labour and production processes whose end result is a finished commodity, while Gereffi and most of his collaborators are concerned specifically with industrial commodity chains. (Raikes, P. et al. 2000, “Global commodity chain analysis and the French filière approach: comparison and critique”, p. 3 – 5). The second, the francophone filière tradition, was developed by researchers at the Institute National de la Recherche Agronomique (INRA) and the Centre de Coopération Internationale en Recherche Agronomique pour le Développement (CIRAD). “Filière analysts have borrowed from different theories and methodologies, including systems analysis, industrial organisation, institutional economics (old and new), management science and Marxist economics, as well as various accounting techniques with their roots in neo classical welfare analysis (Kydd, Pearce and Stockbridge 1996, p. 23). Therefore, while the GCC approach is centred on contributions from a distinct school of thought, the French Filière approach is a loosely-knit set of studies with the common characteristic that they use the filière (or chain) of activities and exchanges as a tool and to delimit the scope of their analysis. The approach is thus a ‘meso-level’ field of analysis rather than a theory. It is also one seen by most of its practitioners as a neutral, practical tool of analysis for use in ‘down-to-earth’ applied research.” (Raikes et al. 2000, “Global commodity chain analysis and the French filière approach: comparison and critique”, p. 22).
________________________
1 Flavia Clemente, 1 Piero A. Nasuelli
DISTAL - School of Agriculture and Veterinary Medicine, University of Bologna, Italy;
[email protected] ; [email protected] 2 Rodolfo Baggio
Dondena Centre for Research on Social Dynamics, Bocconi University, Milan, Italy;
These two and other different approaches to the observation of supply chains, each with its strengths and weaknesses, have led to the development of various models different from each other depending on the purpose of analysis for which they were designed. Among the main we can mention: the Process Classification Framework (PCF), the model of the Global Supply Chain Forum, the most recent Supply Chain Roadmap, the Supply-Chain Operations Reference (SCOR). (Criscione 2015, "The internationalization of the supply chain", p. 25).
Using the word "model" we clarify what we mean by this term with a citation: "What is a model? Although a model is easily recognizable as such, it is something that virtually defies a formal definition. As the philosopher Max Black pointed out in his classic (1962) study of modeling in science, the term model has as many definitions as it has uses." (Sebeok et al. 2000, “The forms of meaning: Modeling systems theory and semiotic analysis”, Vol. 1, Walter de Gruyter, p. 2). The Business Dictionary provides a definition of “model” that suits our case: “Graphical, mathematical (symbolic), physical, or verbal representation or simplified version of a concept, phenomenon, relationship, structure, system, or an aspect of the real world. The objectives of a model include (1) to facilitate understanding by eliminating unnecessary components, (2) to aid in decision making by simulating 'what if' scenarios, (3) to explain, control, and predict events on the basis of past observations. Since most objects and phenomenon are very complicated (have numerous parts) and much too complex (parts have dense interconnections) to be comprehended in their entirety, a model contains only those features that are of primary importance to the model maker's purpose”
(http://www.businessdictionary.com/definition/model.html).
For our purposes our model is a mapping model, a graphical representation of the structure of system of food supply chains that depicts relationships among its different components, and traces flows of raw materials, processed food, information and money.
Current models for supply chains of food products are not fully able to describe production and marketing dynamics because they usually do not take into account all the links, vertical and horizontal, in the network of relationships existing between production, processing, distribution, and even the disposal of food. This makes them not exactly the most useful tools for a good governance of the players in the food sector. Besides that, making predictions has become increasingly difficult due to the dynamics of the food market, more and more similar to that of a complex financial market. Even agro-food production processes have become very complex systems, involving many actors performing activities of different types and linked by relationships of different nature. Moreover, these relationships are no longer limited to those between the elements most closely linked along the chain but can include stakeholders anywhere in the chain (Yu & Nagurney 2013).
From the foregoing and from the consequent considerations, the idea of designing new models for evaluating the network of relationships between the actors of the food supply chains, both to assess the robustness of the organizational structure and to have more accurate measures of the role and the importance of each actor in the system. This can also allow to identify which of the actors occupy strategic positions in the network and which of them have only a redundant function.
The model we designed that will be described hereinafter, could be an interesting and new analytical tool for an observatory on products of animal origin thus becoming a strong support to decisions for policy-makers. Moreover, it can also provide the useful advices to individual actors on how to optimize their own supply chains and improve efficiency. Finally, through a full and effective enumeration and evaluation of the relationships between all the actors, a network model can be highly helpful in developing policies and tracking and traceability systems.
2. A Network Analytic Approach
2.1. Key features of a complex network
A complex network is an abstract depiction of a real system in which nodes (or vertices) represent the elements (individuals, companies, objects etc.) and arcs (or links) joining nodes depict some form of relationship (business, friendship etc.) existing between them. Links can be mono or bidirectional and can be associated with a weight that differentiates the different relationships (importance, cost, speed etc.). The shape of the network (its topological characteristics), as demonstrated in numerous cases (da Fontoura Costa et al. 2011, p. 212-215; Baggio et al. 2010, p. 819-821), offers useful insights into the structure of the system and its dynamic characteristics. As many studies show (see e.g. the reviews contained in the books by Easley & Kleinberg (2010), and Newman (2010)), topological characteristics play a crucial role in determining the functioning of the system under investigation. The analysis can be qualitative or quantitative, providing in both cases outcomes of different nature.
A complex network can be described by using a wide series of measurements that underline the different features of the system. The most important and widely used measures are reported as following (Boccaletti et al. 2006, p. 180-185):
- degree: the number of direct relations that a particular node has with others;
- assortativity: the correlation coefficient between the degree of a node and that of its neighbors, it shows the preference for a network's nodes to attach to others that are similar in some way; - closeness: the inverse of the sum of the distances between any two nodes;
- betweenness: the number of times a given node is interposed on shortest path between two nodes, it allows to highlight bottlenecks in the network;
- clustering coefficient (also termed transitivity): a measure of the local inhomogeneity of the density of links.
Average values and statistical distributions of these quantities, mainly that of the degrees, typically depict the global characteristics of the network, while the single nodal values (often called centrality metrics) render the role or the importance of the single elements of the network.
The following metrics are commonly used, as well, for characterizing the global properties of a network:
- density of links: the ratio between the number of links present in the network and the maximum possible number;
- Gini coefficient for the degrees: measures the inequality among the values of the link distribution (1 is maximum inequality)
- average path length, largest minimum path (diameter): the average or largest series of links that connect any two nodes;
- modularity: the extent to which a network can be partitioned into groups of nodes that are more densely connected between them than with other parts of the network. In a socio-economic setting these can be identified as collaborative groups.
2.2. Reasons that make complex networks suitable for representing supply chains
system, and what configurations are the most effective with respect to some dynamic process unfolding on the network (Barrat et al. 2008; Newman 2010, p. 589-704).
The model we propose here is a network with topological (structural) characteristics defined by the connections between the vertices, to which we assign a weight that represent the monetary value of the exchange occurring.
3. The model
3.1. Materials and methods
The case study presented in this paper builds on the preliminary qualitative analysis presented at a previous EFITA conference by Nasuelli & Clemente (2013). We designed the model with the idea of representing the entire scenario of the products of animal origin. The model examines the Italian supply chains of milk and dairy products (cow, goat, sheep and buffalo milk), and beef and pork meat along with their derived products. The peculiarity of the Italian food supply chains and also of some other countries, such as France, is the large number of PDO products (Protected Denomination of Origin) and PGI (Protected Geographical Indication). The products having these awards have production lines since the beginning separate from those of products that are not PDO and not PGI. For its construction the model is open to the addition of other supply chains (i.e. poultry sector). Before extending the model to other supply chains we wanted to represent the supply chains of products of animal origin more closely related. In fact the whey deriving from the production of cheese is used in the feeding of pigs.
The model takes into account some business choices such as that of the direct selling of products, as well as some aspects concerning the recovery of waste through rendering activities for the production of energy or by-products that are used in other industries. It also considers issues currently under the spotlight for their social valence such as the recovery of the unsold for humanitarian purposes. In our model single nodes represent categories of actors in the supply chains, or activities that take place along the chains (thus a company performing different activities may be represented by different nodes).
For an initial graphical representation of the model, we used yEd Graph Editor, (available at: http://www.yworks.com/en/products/yfiles/yed/) a graphical software also providing a first qualitative assessment (Fig. 1 and 2). The total number of the elements is 228, the number of nodes that represent the single products is 184, linked by 491 directed relationships. The network has been assembled by taking into account the four main segments of a chain: production, processing, trade and consumption. These segments contain several sub-segments that contain the nodes of the network. The sub-segments are useful for a graphical representation of the network, but also for the assessment of data aggregated on the basis of product typology. For example in the sub-segment that represents cheese factories there are distinct groups for PDO cheeses and cheeses which are not PDO. We must keep in mind that both organic products and PDO products have production lines distinguished from those of other products since the origin of raw materials and for animal feeding, too. In addition some products exist exclusively in PDO version. Therefore, they differ from the other both for the production methodology constrained to the production disciplinary, both for the product obtained that will be by definition different from any other. Always remaining in the segment of processing a group apart is reserved for organic products. Also for the meat supply chain certain types of products have been collected in groups. This because there is interest by some operators to know the aggregate data more than the data of the individual product.
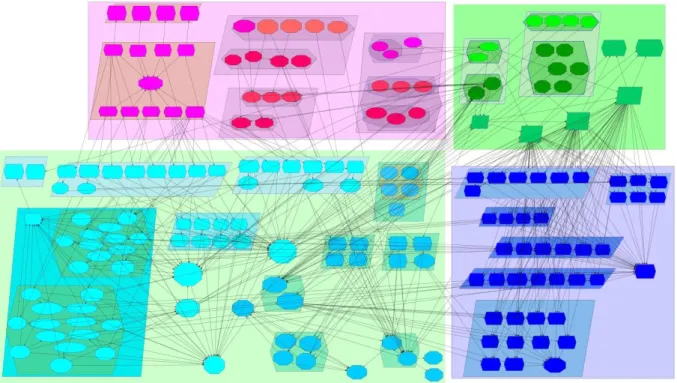
Figure 1. The complex network model of supply chains of products of animal origin in Italy.
The four segments are represented as rectangles, within which are contained the sub-segments which are the next level of the supply chain and are represented by parallelograms.
Legend
Geometric shapes: used to distinguish the level of particular described:
• rectangles = 1st level (the more generic): segments (production, processing, trade, consumption); parallelograms = 2nd level (grouping large groups of products in the same category): sub-segments; • hexagons = 3rd level (grouping most specific): for example products which differ in the fact of having a
production protocol
• octagons = 4th level: individual nodes
• ellipses = 5th level: represent companies that make direct sales
Different colors are used for showing the different elements of the supply chain: • pink = production; (fuchsia: milk producers; red: live animals producers) • turquoise = processing; (clearer: milk chain; darker: meat chain)
• green = trade; (clearer: milk import and export; darker: meat import and export; medium green: distribution on national territory)
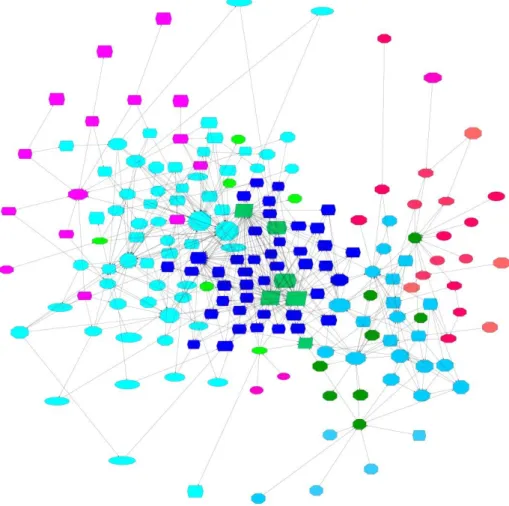
Figure 2. A “Circular layout – single cycle”, so called by the software yEd.
This figure shows the entire network in a circular arrangement of its nodes. As can be seen in the center of this layout there is the portion of nodes most tightly connected with the others, while less connected nodes
remain on the edge.
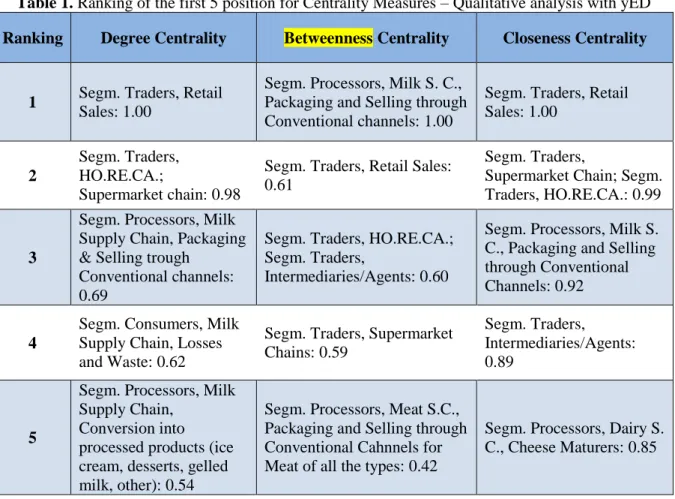
3.2. Qualitative analysis: Centrality Measures
The most important metrics in an economic network are degree, betweenness and closeness centrality measures. Degree centrality is a measure of the ability of communication of a node in the network. In our case (an economic network) this is the number of incoming and outgoing direct economic relations. Betweenness centrality (the number of times a given node is interposed over the shortest path between two nodes), which measures the role of crucial crossroads in the network, a key point for the supply chain. Closeness centrality gives the measurement of the capacity of a node to reach all the others in the network, in economic terms this is the influence of a node over the rest of the system.
Figure 3. Degree centrality
Figure 4. Betweenness centrality
Figure 5. Closeness centrality
Table 1. Ranking of the first 5 position for Centrality Measures – Qualitative analysis with yED
Ranking Degree Centrality Betweenness Centrality Closeness Centrality
1 Segm. Traders, Retail Sales: 1.00
Segm. Processors, Milk S. C., Packaging and Selling through Conventional channels: 1.00
Segm. Traders, Retail Sales: 1.00
2
Segm. Traders, HO.RE.CA.;
Supermarket chain: 0.98
Segm. Traders, Retail Sales: 0.61
Segm. Traders,
Supermarket Chain; Segm. Traders, HO.RE.CA.: 0.99
3
Segm. Processors, Milk Supply Chain, Packaging & Selling trough
Conventional channels: 0.69
Segm. Traders, HO.RE.CA.; Segm. Traders,
Intermediaries/Agents: 0.60
Segm. Processors, Milk S. C., Packaging and Selling through Conventional Channels: 0.92
4
Segm. Consumers, Milk Supply Chain, Losses and Waste: 0.62
Segm. Traders, Supermarket Chains: 0.59
Segm. Traders, Intermediaries/Agents: 0.89
5
Segm. Processors, Milk Supply Chain,
Conversion into processed products (ice cream, desserts, gelled milk, other): 0.54
Segm. Processors, Meat S.C., Packaging and Selling through Conventional Cahnnels for Meat of all the types: 0.42
Segm. Processors, Dairy S. C., Cheese Maturers: 0.85
3.3. Quantitative Analysis
The quantitative analysis of a complex network model of supply chain requires the availability of data of the supply chain of a company, and the evaluation of the weight of all the relationships between network nodes.
Unfortunately in the agro-food sector we do not have a publicly released complete data set and only for a part of products we have data collected by the authorities. In addition, for many products such as the buffalo Mozzarella cheese, data are recorded by the relevant authorities only for the last few years. Data were collected from official sources (ISTAT) when available, or from production or transformation consortia. For the nodes without official data, the amounts were estimated by resorting to an estimation using standard coefficients of transformation of raw materials into processed products. The idea is that considering the total sum of the relationships between network nodes (total amounts), the sum of the weights from official sources with those estimated should be consistent. The total sum of the relationships between the nodes of the network amounts to about 60 billion euro. This amount was obtained by computing the average over three years: between 2010 and 2012.
The choice of the nodes was performed by inserting the network nodes that represent the fundamental stages of supply chains and the most representative products of production, import, export, and of PDO products non-PDO products of Italian supply chains. The network covers more than 99.5% of the supply chains examined.
To weigh the network we performed the following operations: collecting data of the weight of relationships in a database.
establishing an alphanumeric code to be assigned to each node. The code allows to identify even at first sight: segment, supply chain (milk or meat), animal species;
As seen, the first step in the analysis was performed inspecting visually thegraphics. As said, they provide only a visual representation, but does not allow calculating the whole series of measures characterizing the network.
Therefore, as further step, more accurate and precise measurement of the network and its features was accomplished by using the Python programming language and the NetworkX library (available at: https://networkx.lanl.gov/) specialized in network analysis measurements.
3.4. Outcomes of the quantitative analysis
The main results of the analysis are reported in what follows; given the directed nature of the links the nodal measurements are divided into in- and out- metrics where in- refers to the connections arriving at a node and out- to those departing from a node. Moreover we compare also the unweighted and the weighted versions of the network (signaled by a W).
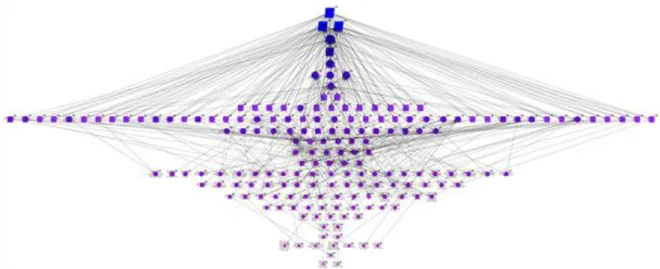
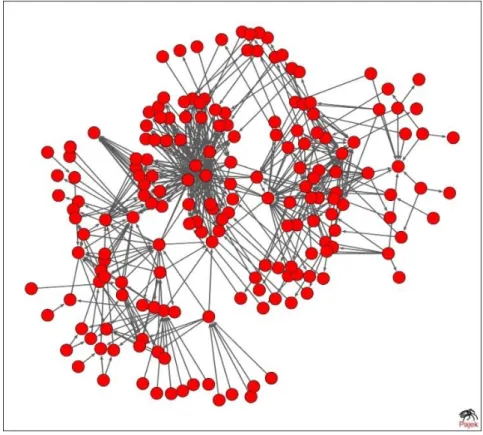
The topology of the network (Figure 6) is dominated by a relatively small number of highly connected nodes that join the rest of the less connected system. The degree distribution is highly in-homogeneous as shown by the Lorenz curves (Figure 7, the diagonal is the line of full equality), and follows a power law (Figure 8). This behavior is typical of many phenomena in the world of nature, sociology and economics, represented by networks "scale free". Important consequence of this is that the removal of nodes at higher connection leads to the disintegration of the network in different isolated clusters and to the increase in diameter of what remains of the network, while the removal of the less connected nodes does not have particular effects. As to the diameter it is a measure of the efficiency of a network. Great efficiency corresponds to small diameters, and then to a compact size. The different individual (nodal) measurements allowed identifying the most central actors as well as those whose position is critical for the connectedness of the whole system, and those whose neighborhood is of particular value.
Figure 7. Lorenz curve for the network degrees
Figure 8. Degree distribution in the unweighted network and in the weighted network
Table 2. Main metrics of the whole network
Measurements Unweighted
network
Weighted network
Node count 184 184
Link count 491 ---
Sum weights 491 997,85
Density 0,015 ---
Average path length 0,545 1,576
Diameter 7 21,256
Average transitivity 0,015
Modularity (infomap) 0,553 0,562
Degree Gini coefficient in: 0.582 in: 0.695
Tables 2 and 3 show the main quantities calculated for the supply chain network.
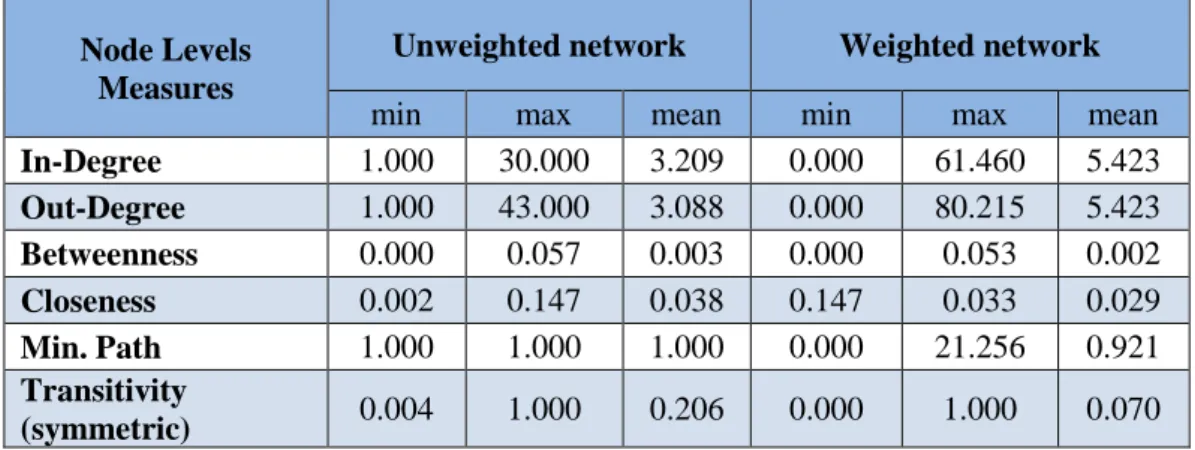
Table 3: Node Levels Measures for the nodes in the whole network
Node Levels Measures
Unweighted network Weighted network
min max mean min max mean
In-Degree 1.000 30.000 3.209 0.000 61.460 5.423
Out-Degree 1.000 43.000 3.088 0.000 80.215 5.423
Betweenness 0.000 0.057 0.003 0.000 0.053 0.002
Closeness 0.002 0.147 0.038 0.147 0.033 0.029
Min. Path 1.000 1.000 1.000 0.000 21.256 0.921
Transitivity
(symmetric) 0.004 1.000 0.206 0.000 1.000 0.070
Table 4 reports the parameters calculated for the degree and strength (weighted degrees) distributions. The parameters are the exponent (and associated statistical error) for a power-law distribution (in the following P(k) is the probability that a node has degree k):
P(k) k-
and mean () and standard deviation () for a lognormal distribution:
P(k) (1/2k)exp(–(ln k–)2/22)
Calculations were performed by using a maximum likelihood fit (as done in Baggio et al. 2010, p. 814) of the distributions as described by Clauset et al. (2009). The software used is the Python package available at: https://pypi.python.org/pypi/powerlaw. Table 4 reports the results along with the errors calculated. Here we notice that the weighted version is better fit by a lognormal distribution, which is quite common among many real networks and is barely distinguishable from the power-law, thus assuming the same meaning for all practical purposes (Mitzenmacher 2004, p. 244).
Table 4. Degree distributions parameters
Type Measures In Out
Degree distribution power-law α 4.25 3.44
error 0.44 0.38
Strength distribution lognormal μ -2.07 1.09
1.38 1.39
A modularity analysis was performed on the network by using the Infomap algorithm (Fortunato 2010) which is particularly suitable in the case (like ours) of weighted directed networks. Here the modules are identified as groups of nodes more strongly connected between them than to other parts of the network. The property is then measured by a modularity coefficient which shows how well “separated” are the modules identified (the coefficient ranges from 0 to 1, where 1 is the case of completely separated modules).
In this network we found 19 clusters, some consisted of high number of nodes (46 nodes), while others composed of few or very few nodes. The 4 larger groups contain respectively 46, 46, 20 and 17 nodes for the weighted network.
and then of processors, traders and consumers of fresh meat and cured meat products. In this cluster there are nodes of the milk and of the meat supply chain in much the same number. The 2nd group is composed mainly of consumers of milk and dairy products, of many of the cheeses (both PDO cheeses and non-PDO cheeses), the relative processors operating direct sales of these products, and traders of milk and dairy products. Only 3 nodes belong to the segment producers of raw materials, 2 nodes to milk producers and one node belongs to the producers of live animals (breeders animals for meat). The 3rd and 4th group (20 and 17 nodes respectively) are composed primarily of producers, processors and consumers mainly from meat and meat products chain, both fresh cuts and cured products. A lower number of nodes belongs to the milk chain. The smaller clusters put together producers of raw materials (milk and dairy products, and of live animals), processors and consumers. The general suggestions regarding these first results say that the composition of the clusters does not follow, if not in part in the major clusters, the division between the milk and the meat supply chain, nor the logic of the separation of a precise type of products, for example PDO products, from others.
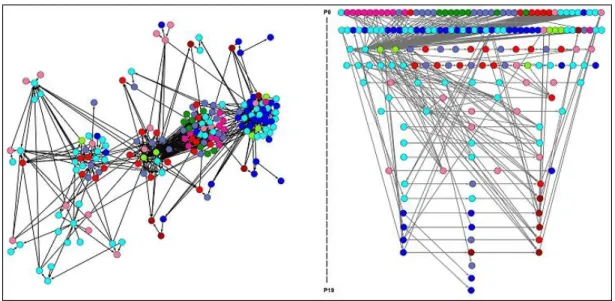
Two pictures of the modularized networks are shown in Figure 9. The diversity of elements making a single module is evident. We show two different arrangements of the formation and composition of the clusters because from different layouts it is possible to appreciate different features. In this case, in the second figure it is easier to see thanks to the differences of colors to which segment of the supply chain or type of chain (milk or meat) cluster nodes belong.
Figure 9. Weighted network modules
The important conclusion here is that, contrary to some common intuitive belief, the network self-organizes in collaborative groups that are composed of actors belonging to different types. Thus the results suggest that the topology generated by the system of connections between the different organizations in the supply chains goes beyond predetermined differentiations and provide indications that in order to optimize some performance, for example optimal communication channels or even productivity in collaborations, policy makers should take into account the spontaneous characteristics of the complex system, and embrace the ideas and practices of an adaptive approach to the management of supply chains. Otherwise, the dynamic characteristics of this complex system risk preventing an effective and efficient application of policy measures.
3.5. Individual nodes: ranking
weights, in fact, modify many of the metrics. The importance of each node in the weighted network no longer relies only on the number of links, but on a combination of links and weights.
The top five nodes for each measurement, for the unweighted and the weighted networks are shown in Table 4. Briefly commenting the results we see that nodes losses / waste in the first places in the ranking of the unweighted network in-degrees fortunately disappear in the top ranked nodes of the weighted network. It can be noted further the importance in every measure in the weighted network of many nodes of processors segment, especially packaging, but also maturers for cheeses, and hams and sausages. Moreover, many nodes of trade segment rank top in all measurements. The only PDO product with a high in-degree rank is PDO ham.
Table 5. Ranking of nodes according to measurements on the unweighted network
Ranking Nodes measurements Unweighted Network
InDegree
1 Segment Consumers, Dairy Supply Chain, Losses and waste 30.000
2 Segment Processors, Dairy Supply Chain, Packaging and Selling through conventional channels
25.000
3 Segment Processors, Dairy Supply Chain, Conversion into Processed products (ice cream, desserts, gelled milk, other products)
24.000
4 Segment Processors, Dairy Supply Chain, Losses and waste 22.000
5 Segment Processors, Meat Supply Chain, Slaughterhouse waste destined for Rendering
14.000
OutDegree
1 Segment Trade (Dairy&Meat), Retail Sales 43.000
2 a) Segment Trade (Dairy&Meat), HO.RE.CA.; b) Segm. Trade (Dairy&Meat), Supermarket Chains
42.000
3 Segment Producers, Dairy Supply Chain, Cow Milk for Processing
13.000
4 a) Segment Processors, Meat Supply Chain, Packaging and Selling through conventional channels for meat of all the types; b) Segm. Processors, Meat Supply Chain, Packagin and Direct Selling for Beef/Veal and all the types of Processed/Matured products
10.000
5 Segment Processors, Dairy Supply Chain, Packaging and Selling through conventional channels
8.000
Betweenness
1 Segment Processors, Dairy Supply Chain, Packaging and Selling through conventional channels
0.057
2 Segment Trade (Dairy&Meat), Retail Sales 0.038
3 a) Segment Trade (Dairy&Meat), HO.RE.CA.; b) Segm. Trade (Dairy&Meat), Supermarket Chains
0.037
4 Segment Processors, Meat Supply Chain, Packagin and Direct Selling for Beef/Veal and all the types of Processed/Matured products
0.033
Table 6. Ranking of nodes according to measurements on the unweighted network
Ranking Nodes measurements Weighted Network
InDegree 1 Segment Processors, Meat Supply Chain, Packaging and Selling through conventional channels for meat of all the types
61.460
2 Segment Processors, Dairy Supply Chain, Packaging and Selling through conventional channels
42.493
3 Segment Consumers, Meat Supply Chain, PDO cured ham 37.415
4 Segment Processors, Dairy Supply Chain, Cheese Maturers 36.195
5 Segment Consumers, Meat Supply Chain, Cuts of Beef 31.866
OutDegree 1 Segment Trade (Dairy&Meat), Retail Sales 80.215 2 Segment Trade (Dairy&Meat), Supermarket Chains 80.015
3 Segment Trade (Dairy&Meat), HO.RE.CA 79.848
4 Segment Trade, Meat Supply Chain, Live Animals 64.754
5 Segment Processors, Dairy Supply Chain, Packaging and Selling through conventional channels
40.187
Betweenness 1 Segment Processors, Dairy Supply Chain, Packaging and Selling through conventional channels
0.053
2 Segment Trade (Dairy&Meat), HO.RE.CA 0.051
3 Segment Trade (Dairy&Meat), Retail Sales 0.031
4 a) Segment Trade (Dairy&Meat), Supermarket Chains; b) Segm. Trade (Dairy&Meat), Intermediaries/Agents
0.026
5 Segment Processors, Meat Supply Chain, Maturers of Meat products
0.024
4. Conclusions
We have provided here the preliminary analysis of the network built considering the Italian supply chains of products of animal origin. The resulting network is a directed weighted network exhibiting a skewed (i.e. shows long tails) distribution of the links following an exponential shape (power-law or lognormal), that makes it similar to many other complex natural networks.
Measurements on individual network nodes show those who occupy strategic positions, with which it is convenient to be connected directly or otherwise in shortest possible paths.
The mechanism of formation of modules (clusters) provides a view into the mesoscopic structure of the network by highlighting more densely connected groups of nodes between them than with other parts of the network thus underlining the self-organization characteristics of the supply chain system. Moreover, these clusterings, which can be interpreted as collaborative groupings, can be of great importance for policy actions directed towards an optimization of the whole system and, for individual stakeholders, in order to look for possible new relationships with the aim of improving operational and strategic activities.
or a precise category, such as the PDO products, but that the activities have to consider the whole dairy supply chain or the whole meat chain.
As said this is a first attempt at using network analysis techniques in this field. In the context of animal production network theory has been used to assess the risk of spreading disease (Bigras-Poulin et al. 2006; Natale et al. 2009) and therefore aim and research area were different. Network theory has been applied to study the formation of prices in the fish market of Marseille (Vignes et al. 2011), and also in this case the purpose was different. About raw materials, in general, a minimum spanning tree network model was constructed and used to study the relationships and interdependencies of futures contracts for commodities for the period 1998 - 2007 (Sieczka et al. 2009). However, it is the first time that this methodology is applied in the productions of animal origin for purposes of a different type from those of previous studies and to a model different from the existing ones. This new model falls within the Multilayer type models, it is a network of networks. In the last few years many Multilayer and Multiplex models have been designed and studies on these types of new models have multiplied, although these studies mainly concern the transport sector. For our model we are thinking of a study in this sense too that will be investigated in the future. Many more investigations are, obviously, needed before being able to make this a fully operational tool. Apart from the deepening of the analysis and the possible implementation of other dedicated metrics, one of the most interesting ideas is that with a model like the one presented here it will be possible to simulate different configurations and find ways to optimize the supply chain with respect to different parameters such as time, costs or other quantities of interest.
References
Baggio, R & Scott, N & Cooper, C 2010, ‘Network science - a review with a focus on tourism’, Annals of Tourism Research, vol. 37, no. 3, pp. 802-827.
Barrat, A & Barthélémy, M & Vespignani, A 2008, Dynamical processes on complex networks, Cambridge University Press, Cambridge.
Bigras-Poulin, M & Thompson, RA & Chriel, M & Mortensen, S & Greiner M 2006, ‘Network analysis of Danish cattle industry trade patterns as an evaluation of risk potential for disease spread’. Preventive Veterinary Medicine 76, Issues 1–2, pp 11-39. Available online at www.sciencedirect.com.
http://www.businessdictionary.com/definition/model.html (definition of “model”). doi: 10.1016/j.prevetmed.2006.04.004
Boccaletti, S., Latora, V., Moreno, Y., Chavez, M., & Hwang, D. U. (2006). ‘Complex networks: Structure and dynamics’, Physics Reports, 424 (4), pp 175-308.
Clauset, A & Shalizi, C R & Newman, MEJ 2009, ‘Power-law distributions in empirical data’, SIAM Review, vol. 51, no. 4, pp. 661-703. doi: 10.1137/070710111
Criscione D, 2015, ‘The internationalization of the supply chain’, Degree Thesis in Management of Production, Supervisor: Nenni M. E., LUISS Guido Carli, available online at http://tesi.eprints.luiss.it/id/eprint/13487 . da Fontoura Costa, L & Oliveira, ON, & Travieso, G & Rodrigues, FA & Villas Boas, PR, & Antiqueira, L & Viana, MP & Correa Rocha, LE 2011, 'Analyzing and modeling real-world phenomena with complex networks: A survey of applications', Advances in Physics, vol. 60, no. 3, pp. 329-412. doi: 10.1080/00018732.2011.572452
Easley, D & Kleinberg, J 2010, Networks, crowds, and markets: Reasoning about a highly connected world, Cambridge University Press, Cambridge. doi: 10.1017/cbo9780511761942
Fortunato, S 2010, 'Community detection in graphs', Physics Reports, vol. 486, no. 3-5, pp. 75-174. doi: 10.1016/j.physrep.2009.11.002
Mitzenmacher, M. (2004). ‘A brief history of generative models for power law and lognormal distributions’,
Internet mathematics, 1(2), 226-251. doi: 10.1080/15427951.2004.10129088
Natale, F & Giovannini, A & Savini, L & Palma, D & Possenti, L & Fiore, G & Calistri, P 2009, ‘Network analysis of Italian cattle trade patterns and evaluation of risks for potential disease spread’, Preventive Veterinary Medicine 92, pp 341-350. doi: 10.1016/j.prevetmed.2009.08.026
Newman, MEJ 2010, Networks - an introduction, Oxford University Press, Oxford.
Raikes, P & Friis Jensen, M & Ponte, S 2000, ‘Global commodity chain analysis and the French filière approach: comparison and critique’, Economy and society, 29(3), 390-417. doi: 10.1080/03085140050084589
Sebeok, TA & Danesi, M 2000, ‘The forms of meaning: Modeling systems theory and semiotic analysis’ (Vol. 1). Walter de Gruyter, p. 2.
Sieczka, P & Holyst JA 2009, ‘Correlations in commodity markets’, Physica A 388, pp 1621-1630 Journal homepage: www.elsevier.com/locate/physica.
Surana, A & Kumara, S & Greaves, M & Nandini Raghavan, U 2005, ‘Supply chain networks: a complex adaptive systems perspective’, International Journal of Production Research 43 (20), pp 4235-4265, doi: 10.1080/00207540500142274
Vignes, A & Etienne, JM 2011, ‘Price formation on the Marseille fish market: evidence from a network analysis’, Journal of Economic Behavior & Organization 80, pp 50-67. doi: 10.1016/j.jebo.2011.07.003
Yu, M & Nagurney, A 2013, 'Competitive food supply chain networks with application to fresh produce',