http://www.sciencepublishinggroup.com/j/cbb doi: 10.11648/j.cbb.20170505.11
ISSN: 2330-8265 (Print); ISSN: 2330-8281 (Online)
Problems of Bad Contrast in Conventional Microscopy
Solution and Speckle Elimination with a Laser Fourier
Holographic Microscope
Vladimir Boris Karpov
Coherent and Nonlinear Optics Department, A. M. Prokhorov General Physics Institute, Russian Academy of Sciences, Moscow, Russia
Email address:
To cite this article:
Vladimir Boris Karpov. Problems of Bad Contrast in Conventional Microscopy Solution and Speckle Elimination with a Laser Fourier Holographic Microscope. Computational Biology and Bioinformatics. Vol. 5, No. 5, 2017, pp. 57-61. doi: 10.11648/j.cbb.20170505.11 Received: October 29, 2016; Accepted: October 13, 2017; Published: November 20, 2017
Abstract:
The problem of bad contrastinconventional microscopy is well-known and was solved in part by colouring the samples. It is shown theoretically that a laser Fourier holographic microscope produces images undisturbed by speckle-noise. A laser holographic microscope (LHM) is investigated experimentally. The instrument uses visible radiation of λ = 0.514 µm, Mach – Zehnder scheme optical setup, and CCD detector of the hologram. Images are reconstructed digitally. The standard slide of Parascaris Univalens Iarva (ascaris) is studied without any drying as for electron microscope. Comparison of the pictures of the same ascaris cell, observed by the LHM and high-quality Nikon conventional optical microscope with immersion oil and green filter indicates dramatically different contrast. The ultrahigh contrast of the LHM gives much more micromorphological information.Keywords:
Speckle-Noise, Fourier Holography, Mach – Zehnder Scheme, CCD Detector, Digital Image Reconstruction1. Introduction
A conventional optical microscope (COM) [1] is a popular human instrument, which will hardly fall into oblivion. Not considering the advantages, it is reasonable to be reminded of its disadvantages, limiting the obtainable information. Thus, the problem of bad contrast is well-known and was solved in part by colouring the samples [2].
Light emitted from a lamp is a carrier of information in a COM. Physically it is incoherent visible radiation with the central frequency ω0 and bandwidth ∆ω0 . When the
spectral filters are used ∆ω 0≈10 Hz13 . For a gas laser 5
0 10 Hz
ω
∆ ≈ .
The contrast of the image observed with a COM is defined by the probability of absorption the incident light by the sample matter. This probability depends of the molecular structure [3, 4]. Different molecules are described with various distributions of such probabilities. Let us consider two neighboring molecules with the frequencies of resonance absorption ω1 and ω2 (both close
to ω0). If ∆ω 0>>ω ω1− 2 , they cannot be resolved by the contrast. To increase the contrast one has to decrease ∆ω0.
2. The Problem of Speckle-Noise
Considerable distortions arise from the speckle-noise [5, 6] if the image is formed with high coherent laser radiation. Moreover, the speckle-noise disturbs images reconstructed from the holograms [7].
The speckle-noise is produced both by reflecting from rough surfaces and transmitting phase nonuniform optical elements. The speckle-noise contributors are placed before the sample, inside and after it. In this way it is reasonable to divide the problem into three steps. In the first step, a plane wave or Gaussian beam, which do not possess speckle-structures [8], have to be used for sample illumination.
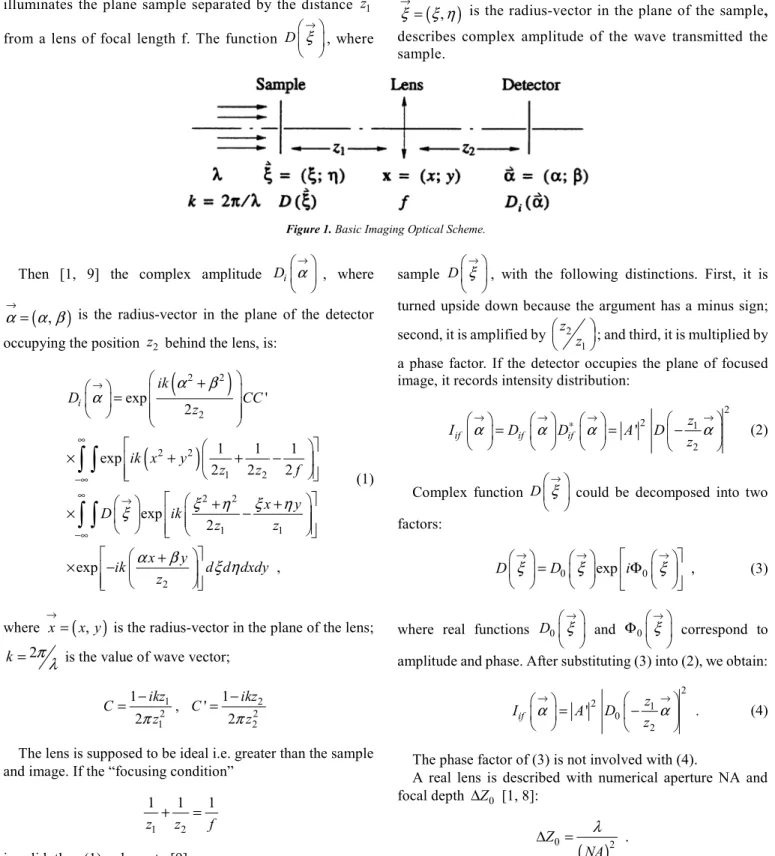
illuminates the plane sample separated by the distance z1
from a lens of focal length f. The function D ξ→
, where
( )
,ξ ξ η →
= is the radius-vector in the plane of the sample,
describes complex amplitude of the wave transmitted the sample.
Figure 1. Basic Imaging Optical Scheme.
Then [1, 9] the complex amplitude Di α
→
, where
(
,)
α→= α β is the radius-vector in the plane of the detector occupying the position z2 behind the lens, is:
(
)
(
)
2 2 2 2 2 1 2 2 2 1 1 2 exp ' 21 1 1
exp
2 2 2
exp 2 exp , i ik D CC z
ik x y
z z f
x y
D ik
z z
x y
ik d d dxdy
z
α β
α
ξ η ξ η
ξ
α β ξ η
→ ∞ −∞ ∞ → −∞ + = × + + − + + × − + × −
∫ ∫
∫ ∫
(1)where x
( )
x y,→
= is the radius-vector in the plane of the lens;
2
k=
π
λ
is the value of wave vector;1 2 2 2 1 2 1 1 , ' 2 2 ikz ikz C C z z π π − − = =
The lens is supposed to be ideal i.e. greater than the sample and image. If the “focusing condition”
1 2
1 1 1
z + z = f
is valid, then (1) reduces to [9]
(
2 2)
1 1
2
2 2
' exp .
2
if
ikz z
D A D
z z
α β
α→ α→
+ = −
The complex amplitude Dif α
→
is the same as for the
sample D ξ→
, with the following distinctions. First, it is
turned upside down because the argument has a minus sign;
second, it is amplified by 2 1 z
z
; and third, it is multiplied by
a phase factor. If the detector occupies the plane of focused image, it records intensity distribution:
2
2 1
2 '
if if if
z
I D D A D
z
α→ α→ ∗ α→ α→
= = −
(2)
Complex function D ξ→
could be decomposed into two
factors:
0 exp 0 ,
D ξ→ =D ξ→ iΦ →ξ
(3)
where real functions D0 ξ
→
and 0 ξ
→
Φ
correspond to
amplitude and phase. After substituting (3) into (2), we obtain:
2 2 1 0 2 ' . if z
I A D
z
α→ α→
= −
(4)
The phase factor of (3) is not involved with (4).
A real lens is described with numerical aperture NA and focal depth ∆Z0 [1, 8]:
( )
0 2 .
Z NA
λ ∆ =
2 0 1
d Z
λ
∆ = (5)
When ∆ > ∆Z1 Z0 the speckle-noise could not formed. In
the opposite case ∆ < ∆Z1 Z0 the high contrast [5] speckle-noise should disturb the focused image of the sample. For instance, looking by naked eye from a distance of 1 m into a piece of paper illuminated by a He-Ne laser one should have:
3 5 3 2
0 0 1
5 10 ; 6 10 ; 10 ; 2.4 ; 1.6 10 .
NA≈ × − λ= × − cm d ≈ − cm ∆Z ≈ cm ∆ ≈Z × − cm
Hence, ∆ << ∆Z1 Z0 and the speckle-noise should be considerable. But if one uses an objective of NA=1 for the same sample (a piece of paper), then:
5 2
0 6 10 ; 1 1.6 10 .
Z − cm Z − cm
∆ ≈ × ∆ ≈ ×
In this case ∆ >> ∆Z1 Z0 and the speckle-noise should be
absent.
For the third step of the speckle-noise removing it is necessary to put away all sources of the parasitic scattering and reflection placed between the sample and detector. The construction of a COM [2] does not allow it. Indeed, the larger the numerical aperture the smaller its objective lens.
Figure 2. Creation of Speckle-Noise Due to Diffraction on a Phase Sample.
In Figure 2 a phase sample with a typical transverse roughness size d0 is illuminated by a spatially and temporally coherent light beam with radiusa0, wavelength λ, and its uncertainty ∆λ. Behind the sample the field is characterized by the length ∆Z1 of the speckle-noise formation (5), divergence
0
θ , and its uncertainty ∆θ0. In the far field [1]:
0 0
, d
λ θ ≈
0
0
1 . d θ
θ ∂λ λ λ
∆ ≈ ∆ ≈ ∆
∂
In accordance with the linear theory of diffraction [1], if the
amplitude D r z→,
is given in a free space for plane z=zd
(the plane of the detector), then, it is possible to determine
, D r z→
for any other plane z=z0 (the plane of the sample):
0
, , d
D r z F D r z
→ →
=
(6)
Here F is known operator of propagation. The sample wave carries the intensity:
2 2
0 0
, , , d
I r z→ = D r z→ = F D r z →
(7)
A conventional detector (retina, photo film, CCD, etc.) is
responsible to the intensity (7), but losses the phase. That leads to impossibility of the image reconstruction with (6). We need a detector based on holography [1]. The principles of an LHM were explained in [9, 10].
3. Experimental Study of an LHM of
Visible Range
λ
=
0 514
.
µ
m
Results of the study of a real biological sample, specifically, a standard slide of Parascaris Univalense Iarva (ascaris) with an LHM are presented. An experimental setup, based on the Fourier holography [9, 11 – 13], is shown in Figure 3. Here, a cw Ar - ion laser 1 provides a continuous, linearly polarized, single transverse and longitudinal mode beam of wavelength
0.514 m
λ= µ . A shutter 2 creates a pulse with controlled duration. A beamsplitter 3 divides the beam into two parts, specifically, reference (transmitted) and sample (reflected). Intensities of both beams are controlled. The reference beam after reflection from a plane mirror 4 is focused by an objective 5. The waist W1 can be considered like a point source of a spherical wave, which after reflection from a beamsplitter 6 reaches the CCD detector 7. The sample beam is reflected by a mirror 8 and then focused by an objective 9. A sample 10, which is a standard slide with a thin section of ascaris, is placed in a focal waist W2. A scattered wave is a result of interaction between the sample and sample wave. A transmitted unscattered beam is blocked by an absorbing blocker 11. The scattered light transmitted the beamsplitter 6 incidents the CCD detector 7. The scattered field interference pattern with the reference wave (a Fourier hologram) is captured by the detector. The hologram is recorded, digitized, and stored by a personal computer 12. The holographic data are then transferred to a Stardent GS 2000 Supergraphic Workstation 13, where numerical image reconstruction is performed. The reconstructed image can then be displayed by a monitor 14, or printed by a Tektronix Copy Processor 15.
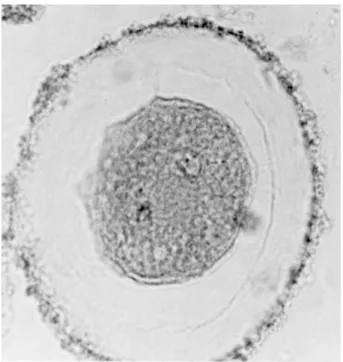
A picture of one certain ascaris cell, chosen for particular study, obtained with a high-performance Nikon COM 10×100 1.25⁄ with immersion oil and green filter is given in Figure 4, Figure 5 shows the image of the same cell and approximately equal magnification obtained with the LHM. Figures 4 and 5 present an image of the cell as a whole.
Figure 4. Picture of the Ascaris Cell, Obtained with High-Performance Nikon COM 10×100/1.25 with Immersion Oil and Green Filter.
Figure 5. Picture of the Same Ascaris Cell of Approximately Equal Magnification as in Figure 4, Obtained with LHM.
4. Conclusions
1. The contrast of the image obtained with the LHM is considerably higher than by the COM. The LHM allows observing distinctly a stripped structure of the cytoplasm, micromorphology of the nucleus, and transmission stage from the nucleus to the cytoplasm. The ultrahigh contrast of the LHM is assumed to be explained by the high coherence of the laser radiation, which allows separating neighbor structures with various resonance absorption frequencies.
2. The high quality of the images obtained with LHM, which are completely agree to electron microscopes ones [3, 4], confirms the absence of the speckle-noise.
Other biological samples were also studied with LHN. The results listed above are consistent with them too. The author have chosen the results for ascaris as the most visual.
References
[1] M. Born, and E. Wojf, Principles of Optics, Oxford: Pergamon, 1964.
[2] Light Microscopy in Biology. A Practical Approach, Ed. By Alan J. Lacey, Oxford: IRL, 1989.
[3] Biological Science, Ed. By R. Soper B. Sc., F. I. Biol Cambridge: CAMBRIGE, 1984.
[4] B. Alberts, D. Bray, J. Lewis, M. Raff, K. Roberts and J. D. Watson, Molecular Biology of the Cell, New York: Garland, 1989.
[5] J. W. Goodman, Statistical Optics, New York: Wiley, 1985. [6] D. Gabor, “Laser speckle and its elimination,” I. B. M. Journ.
[7] M. Francon, La Granularite Laser (Spekle) et ses Applications en Optique, Paris: Masson, 1978.
[8] B. Ya. Zel’dovich, N. F. Pilipetsky, and V. V. Shkunov, Principles of Phase Conjugation, Berlin: Springer, 1985. [9] J. B. De Vellis, and G. O. Reynolds, Theory and Application of
Holography, Mass: Addison - Wesley, Reading, 1967. [10] D. Gabor, “A new microscopy principle,” Nature, vol. 161,
1948, pp. 777 - 778.
[11] W. S. Haddad, D. Cullen, J. C. Solem, J. W. Longworth, A. McPherson, K. Boyer, and Ch. K. Rhodes, “Fourier - transform holographic microscope,” Applied Optics, vol. 31, Issue 24, 1992, pp. 4973 - 4978.
[12] J. T. Wintrop, and C. R. Worthington, “X - ray microscopy by successive Fourier transmission,” Physics Letters, vol. 15, 1965, pp. 124.