The effect of cyanides on the gill colour of fish
6
0
0
Full text
(2) 672. R. BASSINDALE, B. A. SOUTHGATE AND F. T. K. PENTELOW.. deficiency of dissolved oxygen. Experiments were carried out in which the changes in the gill colour of rainbow trout, and later of nsea trout smolts (Salmo trutta L.), brought about by these factors were observed. TABLE I. THE CHANGE OF GILL COLOUR OF RAINBOW TROUT IN A SOLUTION OF KCN. EQUIVALENT TO 0.017. GM. (CN) 5. No. of fish before poisoning No. of fish after poisoning* No. of fish on recovery No. .of fish 1 hr. after recovery. PER 100 LITRES.. Colour No. 789. 6. 3 6. 7 3 4. 2. 10. 2. 11. 3. 7 5. 4 3. 1 1. Average Gill Colour No.. 9 6 8 8. * 1 died.. TABLE II. CHANGE OF GILL COLOUR OF FISH DURING POISONING. AN INCREASE IN THE GILL COLOUR No. INDICATES A DARKENING OF COLOUR. Rainbow Trout. Average Gill Colours.. Sea Trout Smolts. Average Gill Colours. ...,. ...... Experimental. solution.. .0 '" '". ". ..<:: '" ..... 0. KON. 0.017 gm. (CN) per 100 litres 0.020 gm. (CN) per 100 litres 1.00 gm. (CN) per 100 litres p.Oresol. 0.7 gm. per 100 litres 0.8 gm. per 100 litres 1.0 gm. per 100 litres Ooke oven effluent containing 0.094% tar acids and no cyanide. 1% solution containing 0.94 gm. tar acids per 100 litres Naphthalene. t-saturated solution Fresh crude sewage. 50% Oxygen deficiency. ---. 101). >=. 'S0. '" 'S p, '" ..... §: 101) >=. >=. 's. 'S0. §:. ..... ..... '" 'S p,. ...,. '" ". '" '" >= '". 0. z. 0 "'" '" p::j. ::;:. '" It; A. 16. 9. 6. -3. 13. 9!. 6!. -3. 13. 8. Il!. H!. 13. 7. 10. +3. 14. 9. 12!. Hi. 8. lOi. 13!. +3. 25 4. 8i 10. 8! 14. 0 +4. '". .0 "" '". 101) >=. §:. a. 101). 'S. 'S0. s;-. ..... ..... >;. 0. S 0'" 'S p, '" .... 0 "'". "' p::j. ::;:. '" It; A. 4. 10. 8. -2. 3. 10. 13i. +3!. ". ..<:: '" ..... 0. z. '" 'S p,. '" '" >= '".
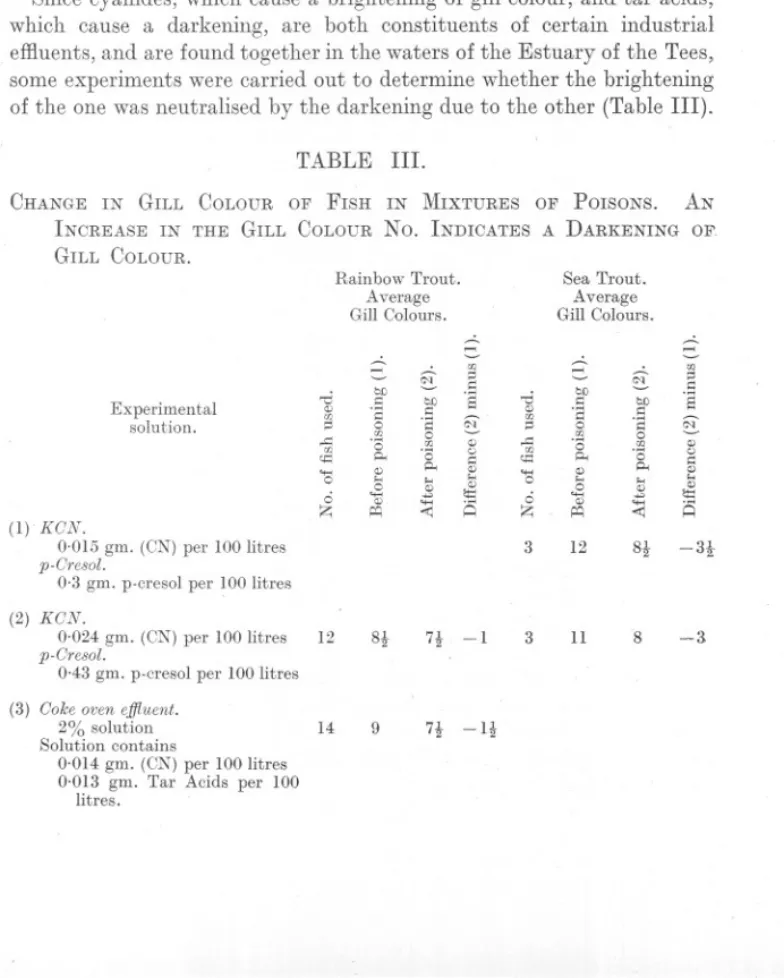
(3) GILL. COLOUR. 673. OF FISH.. In a typical experiment, the gill colours of about twelve normal fish were determined, after which they were exposed to an experimental solution. When at least half the fish had turned over on their side, they were removed, their gill colours were again observed, and they were allowed to recover in fresh water, further observations being made during the period of recovery. The results of a typical experiment are shown in Table I. The whole of the results obtained are summarised in Table II. Only in the case of cyanide was there any brightening of the gill colour, a marked darkening occurring during the other two types of poisoning most likely to be met with in the Estuary, that is by oxygen deficiency or by "tar acids" (represented in one of the series of experiments by .p-cresol). Since cyanides, which cause a brightening of gill colour, and tar acids, which cause a darkening, are both constituents of certain industrial effluents, and are found together in the waters of the Estuary of the Tees, some experiments were carried out to determine whether the brightening of the one was neutralised by the darkening due to the other (Table III). TABLE III. CHANGE IN GILL COLOUR OF FISH IN MIXTURES OF ParSONS. AN INCREASE IN THE GILL COLOUR No. INDICATES A DARKENING OF. GILL COLOUR. Rainbow Trout. Average Gill Colours.. Sea Trout. Average Gill Colours. ,...,. ,..., .-d. Experimental solution.. '" 00 .,. .-"i. 00 q::. ... 0. b!J .,. .a. .0 p.,. '" ,.., <:3 .s '". z. f11. §: b!J. .a0. 00. .0. p.,. ,..,. .3. :'<1. 00. .S. .-d. §:. .,. '" c.J. '" ,..,. '" H. (1) KCN. 0.015 gm. (CN) per 1001itres p-Cresol0.3 gm. p-cresol per 100 litres (2) KCN. 0.024 gm. (CN) per 100 litres p-Cresol. 0.43 gm. p-cresol per 100 litres (3) Coke oven ",ffiuent. 2% solution Solution contains 0.014 gm. (CN) per 100 litres 0.013 gm. Tar Acids per 100 litres.. ,...,. .,. 12. 8!. 7!. -1. 14. 9. 7t. -It. "' 00. b!J. .a. .-"i 00 q::. .0 p.,. 0. ,..,. .... <:3 Z. '". .s'". ::c.. §: b!J. .a0. 00 .0. p., ,.., '". f11. 00 .,. .S. §: '". c.J. '". ,..,. '" '"' A. 3. 12. 8!. -3t. 3. 11. 8. -3.
(4) I. 674. R. BASSINDALE, B. A. SOUTHGATE AND F. T. K. PENTELOW.. In the Tees Estuary the concentration of (ON) found by analysis does not usually exceed 0.02 gm. per 100 litres and that of tar acids 0,05 gm. per 100 litres. Even when the concentration of tar acid is twenty times that of (ON), as in Experiment 1 of Table III, the brightening due to the cyanide is well marked. In Experiment 2, the concentrations of p-cresol and KON used were of equal toxicity to rainbow trout. The industrial wastes discharged into the Tees Estuary consist mainly of two types of coke oven efHuent. The change in gill colour brought about by one type, which owes its toxicity to tar acids, is recorded in Table II, and that due to the other type, the main toxic constituent of which is cyanide, is recorded in Table III. In neither of these cases did any other substance interfere with the characteristic gill colour change of the main toxic constituent. The data for sea trout smolts are not so complete as those for rainbow trout owing to the difficulty of keeping the smolts, but since the reaction of the two species to the solutions in which they were tested is similar, it is reasonable to suppose that it would also be similar for other substances. THE. GILL. OOLOUR. OF SALMON. DYING. AND SEA. IN THE. TEES. TROUT. SMOLTS. FOUND. ESTUARY.. During the annual seaward migration of smolts in 1931, numbers of smolts of both sea trout and salmon (Salmo salar L.) were picked up in a dying condition in the Estuary, and their gill colours were compared with the colours of the standard chart. Only fish which were obviously alive and which were taken from the water were used. Some smolts were allowed to recover in freshwater tanks, after which the gill colours of the normal fish were recorded. The results obtained are given in Table IV. TABLE IV. THE. GILL. OOLOUR. OF SALMON. AND SEA. TEES. TROUT. SMOLTS. DYING. IN THE. ESTUARY.. Salmon smolts. Normal. Dying.. No. of smolts from which gill colour records were taken Average gill colour. 40 12.5. 66 8.5. Sea Trout smolts. Normal. Dying.. 76 11.7. 131 7.1. The gill colour of the dying fish was, in both cases, brighter than that of the normal fish, the average difference being 4.0 units in the case of salmon and 4.6 in the case of sea trout smolts. These results indicated that the smolts were dying from cyanide poisoning, a conclusion which was borne out by chemical observations..
(5) GILL. COLOUR. 675. OF FISH,. The Gill Colour Scale, Eight c?lours were prepared by mixing three solutions of coloured inks (Winsor and Newton's Mandarin Waterproof) in various proportions. Details of the colour mixtures used are given below :Solution A. Scarlet ink, 3 vols. Distilled water, 1 vol. Solution B. Ultramarine ink, 1.7 vols. Vermilion, 20 vols. Scarlet, 20 vols. Solution C. Ultramarine ink, 3 vols. Brown, 2 vols. Distilled water, 4 vols.. ,. TABLE V. ColourNo. 2 4 6 8. 10 12 14 16. SolutionA. vols. 8 6. Solution B. vols. 1. 4 3. 3 5 6. 1 0 0 0. 8 9 9 9. SolutionC. vols. 0 0 0 1. 'I. 2 4 6 9. Strips of Whatman's No.1 filter paper were soaked in these solutions, excess ink being immediately removed with blotting-paper. The colours referred to in Table V are those of the rough side of the filter paper. An analysis of the colours of the standard chart, made with a Lovibond Tintometer, modified for use with reflected light, is given in Table VI. TABLE VI. Gill Colour ScaleNo.. 2 4 6 8 10 12 14 16. Lovibond Tintometer Units.. Red.. 15.8 15.3 14.2 12.8 11.0 9'5 8.9 6.0. Yellow.. 1.5 1.5 1.9 1.9 2.5 2.5 2.8 2.8. NEwlsERIEs.-voL. XVIII. No.2. JANUARY, 1933.. Blue.. 0 0 0 0.3 1.3 2.6 3.4 4.0 Q.
(6) 676. R. BASSINDALE, B. A. SOUTHGATE AND F. T. K. PENTELOW.. SUMMARY. 1. The changes brought about in the colour of the gills of rainbow trout and sea trout smolts by various poisons are described. 2. Cyanide causes a marked brightening, whilst phenolic substances, dissolved oxygen deficiency and naphthalene bring about a darkening of the gill colour. Fresh, untreated sewage has no effect. 3. The gill colour of smolts dying in the Tees Estuary was brighter than normal, indicating cyanide poisoning. This conclusion was confirmed by chemical methods. The work described in this paper was carried out as part of the programme of the Water Pollution Research Board of the Department of Scientific and Industrial Research and is published by permission of the Department. We are indebted to Mr. N. Strafford, of the British Dyestuffs Corporation, Ltd., for calibration of the standard colour chart by the Lovibond Tintometer..
(7)
Figure
Related documents
Keywords: Personal Knowledge Management (PKM), Organizational Knowledge Management (OKM), PKM for Development (PKM4D), Informing Science Framework, Human Capital, Ca-
It was decided that with the presence of such significant red flag signs that she should undergo advanced imaging, in this case an MRI, that revealed an underlying malignancy, which
Also, both diabetic groups there were a positive immunoreactivity of the photoreceptor inner segment, and this was also seen among control ani- mals treated with a
The paper is discussed for various techniques for sensor localization and various interpolation methods for variety of prediction methods used by various applications
Мөн БЗДүүргийн нохойн уушгины жижиг гуурсанцрын хучуур эсийн болон гөлгөр булчингийн ширхгийн гиперплази (4-р зураг), Чингэлтэй дүүргийн нохойн уушгинд том
19% serve a county. Fourteen per cent of the centers provide service for adjoining states in addition to the states in which they are located; usually these adjoining states have
diallylacetic acid rather than bismuth since in one case in which analysis was performed only minute amounts of bismuth were recovered, and there was, in his opinion, ‘ ‘no
Assessing the Impact of Biodiversity Conservation in the Management of Maize Stalk Borer (Busseola f
Field experiments were conducted at Ebonyi State University Research Farm during 2009 and 2010 farming seasons to evaluate the effect of intercropping maize with
