c
Sharif University of Technology, June 2010
A Corporate Supply
Optimizer with Flow Network
M. Sepehri
1;, K. Fayazbakhsh
1and F. Ghasemzadeh
1Abstract. A holding or a multi-business corporate seeks to coordinate its supply for minimum overall costs. A Corporate Supply Optimizer (CSO), as a central entity taking advantage of the notion of ow networks, gathers necessary operational information from members of the corporate supply chain. The CSO then guides supply chain members on ordering decisions for a minimum overall cost for the entire supply chain. Its computational engine models the entire supply chain with multiple members in four stages to satisfy customer demand. The CSO seeks a solution with minimum total costs, unlike non-cooperative supply chains where individual members compete to optimize their local costs. The existing literature stays with restrictive assumptions on the number of supply chain stages, disallowing a case of multiple products. Simulation results indicate an approximately 26% reduction in total costs of the supply chain utilizing the CSO.
Keywords: Corporate supply; Coordination mechanism; Flow network; Linear programming; Optimizer.
INTRODUCTION
After a period of focusing heavily on individual busi-ness specic results, many multi-busibusi-ness companies are again becoming concerned to take advantage of potential synergies between their businesses. A focus on opportunities to add value and on the distinctive resources possessed by the corporate parent that lead to added value, provides the basis for valid corporate strategies [1]. Many suppliers also enter into part-nership or alliance agreements so that they can share the benets of serving better customers in a particular market [2].
Outsourcing has become a hot topic for many companies in recent years. Some companies are push-ing as many processes onto outside suppliers, while keeping control over the timing and mix of ow from each link. Although each supplier is a distinct business, the client persists in complete control on the timing and mix of the required supply [3].
It has become a widespread policy to organize multi-business rms into Strategic Business Units
1. Graduate School of Management, Sharif University of Tech-nology, Tehran, P.O. Box 18534, Iran.
*. Corresponding author. E-mail: [email protected]
Received 29 April 2009; received in revised form 25 August 2009; accepted 7 December 2009
(SBUs). Each SBU is given the responsibility to serve the particular demands of one business area or to produce a particular supply for other units [4]. Even where resources, activities and product oerings are split along business unit lines, integration can be achieved by ensuring that coordination is carried out between business units. Such orchestration of work across business unit boundaries should result in the ability to operate as if the various parts were actually one unit [5].
Coordination among the stages or, in other words, among a network of buyers and sellers is a major chal-lenge in cooperative supply chain, and generated much interest in the past several decades [6]. As the actual number of businesses related to manufacturing and distribution of products has increased in practice, the coordination issue has become immensely complicated. Lack of coordination may cause unfavorable eects such as longer lead times, higher operation (produc-tion, transportation or inventory) costs, degradation in the customer service levels and a negative impact on the relationships amongst members in a supply chain.
Although much formulation and quantitative analysis is developed in supply chain literature in the past two decades [7], a comprehensive model optimizing all aspects of cost and capacity for multiple stages
and products is not found, which may additionally include customer priority or product inventory and shortage. For a cooperative or a corporate-managed supply chain, the overall optimization problem has not yet been addressed. Furthermore, such initial supply chain optimization models have not been extended into practice, employing an integrated real-time mechanism to match advances in electronic procurement.
The idea behind the proposed mechanism in this paper is to present the corporate supply chain as a ow network, and then formulate and solve a corresponding linear programming model in the ow network. Furthermore, a Corporate Supply Optimizer (CSO) system, which may be actually an electronic hub (e-hub), gathers needed informa-tion about operainforma-tional costs and capacities from the supply chain members. CSO guides the cooper-ative supply chain members on ordering decisions, thus providing a minimum overall cost for the en-tire supply chain. Without such mechanism, every member makes decision on order quantities based on its local and accessible information, resulting in non-optimal performance of the corporate supply chain.
Organization of the paper is as follows. The next two sections review the literature on supply chain coordination and corporate-managed supply. Concept of ow network as a major player in the solution is investigated in the following section. Next parts provide denition and assumptions associated with the problem, and demonstrate how the proposed model can solve the problem. Evaluation of the model and conclusion have been presented at the end of the paper. SUPPLY CHAIN COORDINATION
A supply chain is dened as a set of suppli-ers, manufactursuppli-ers, distributors and retailers (sup-ply chain stages) along with all their interrelation-ships [8]. A supply chain is composed of several stages with a number of members in each stage, which may be distinct businesses related to each other directly or indirectly to satisfy customer de-mand. Dierent types of products are produced from a set of supplied components in a supply chain.
A supply chain coordination scheme in practice may generally include coordination contracts, informa-tion sharing and negotiainforma-tion. The most common mech-anism for bilateral relationship between a buyer and a seller is to collaborate and agree on a contract. Supply network contracts include quantity-discounts, revenue-sharing, buy-back contracts, price-discounts, quantity-exibility, sales-rebate, promotional allowances, coop-erative advertising and franchise contracts [7,9-11]. Cachon provides a thorough study of coordination
contracts [12]. Increase in the number of members of supply network transforms traditional contracts into inecient coordination mechanisms. Li and Wang [6] provide a survey of traditional coordination mecha-nisms for supply network taking an inventory control approach.
Decision making based on shared operational information by members of a supply chain is the second major type of coordination mechanisms. Lee and Whang [13] describe inventory, sales, demand forecast, order status and production schedule as dierent types of information shared. While Lee et al. [14] and Cachon and Fisher [15] clearly show the signicance of information sharing in a two-level supply chain, lack of information sharing aggravates the incurred cost in a supply chain with multiple members in several stages (see [16,17]). Usual choices for managing and sharing business information include Customer Relationship Management (CRM), Supplier Relationship Managment (SRM), Electronic Data Interchange (EDI), e-marketplaces and e-chains [8,18-22].
Sahin and Robinson [23] provide a literature re-view in product ow and information sharing in supply chains based on the degree of information sharing. An absolutely signicant question is that while members of the supply chain do not trust each other completely, why should they accept to share their own strategically important information via such coordination systems? Li [24] investigates the incentives for members of a two-level supply chain with one manufacturer and several retailers to share information horizontally. He concludes that voluntary information sharing is not rationally possible and therefore examines conditions under which information can be traded. Thus, it may be essential to restrict shared information as much as possible. The problem of a general supply chain with multiple levels and several members in each level still remains unexplained.
Many recent studies have focused on negotiation-based mechanisms for the supply chain coordination. Negotiation may be considered as a process with a spe-cial type of information sharing where less information is shared, and a protocol is used for conducting the negotiation process. Fox et al. [25] developed a high-level framework for supply chain functions with the idea of encapsulating these function in corresponding software agents. Consequently, Fox et al. [26] pre-sented a general approach to supply chain management operations covering planning and execution of actions with dierent types of software agents. Dudek and Stadtler [27] study a two-member supply chain. By dening members' mathematical operational model, they proposed a negotiation mechanism to reduce total costs. Chen, et al. [28] propose a exible negotiation-based multi-agent system in which new members can join the supply chain and its members may leave it.
Despite their nice approach to the problem, the issue of several agents' interactions remains unexplored. Fazel Zarandi et al. [29] attempt to provide an agent-based architecture based on fuzzy logic to realize a responsive and cooperative supply chain. Ding and Chen [30] con-sider using negotiation in return policy to coordinate a three-stage (with a single member in each stage) supply chain. Fink [31] proposes using a mediator software agent to conduct a bilateral negotiation process until both rms accept a contract. In general, limiting the number of supply chain members and concurrent interaction of multiple agents are the major obstacles in applying the current negotiation-based mechanisms to supply chains with multiple members.
Using linear programming techniques to formu-late and analyze the various supply chain management problems has a long record in the research literature. In addition to inventory management and production-distribution planning problems, which make use of linear programming schemes extensively [32-38] design-ing distribution networks [39-41], models for facility location allocation [42-44], the facility capacity allo-cation problem [45] and the aggregate planning [8,46] represent this category of supply chain management problems. While dealing with dierent supply chain problems, mixed Integer programming provides more accurate description of the problem, but reaching the fast and exact solutions to the problem might be a challenge (e.g. [47]).
CORPORATE-MANAGED SUPPLY
Corporate headquarters (CHQ) play varying roles in large or multi-business companies. CHQ or the parent unit can help the other elements expand their size and scope of activities in, for example, globalization or product extensions [2]. In organizational economics, the role of CHQ is mostly limited to monitoring and incentive issues. However, this role may be expanded to assist in exploiting economies of scope and other synergies, in building up internal capital markets, and in directing mix of activities within each unit [48].
Headquarter or corporate strategy can be de-scribed as the identication of the purpose of the organization and the plans and actions to achieve that purpose amongst the business units [2]. Corporate strategies should facilitate the coordination of orga-nizational actions and their interactions [49]. In a multi-business company, each business needs to have its own strategy to succeed in its particular product market arena. However, the corporate strategy must be more than simply the aggregation of these business strategies [50]. Otherwise, there is no justication for bringing the separate businesses together under the common ownership of a single corporate parent.
Corporate level strategy is about selecting an
optimal set of businesses and determining how they should be integrated into the corporate whole. Decid-ing on the best array of businesses and relatDecid-ing them to one another is referred to as the issue of `corporate conguration' [49]. Determining the conguration of a corporation can be disentangled into two main questions:
(a) \What businesses should the corporation be active in?" This is called the topic of `corporate compo-sition'.
(b) \How should this group of businesses be man-aged?"This function is labeled as the issue of `corporate management'.
Centralization, coordination and standardization be-tween business units can also be achieved without the use of hierarchical authority. Business units might be willing to cooperate because it is in their interest to do so, or because they recognize the overall collective interests. Corporate strategists interested in such inte-gration, by mutual adjustment, will focus on creating the organizational circumstances under which such self-organization can take place [51]. Such coordination can result on lower overall costs shared by all business units. Pro [52] developed a research concept to assess the consistency of corporate strategies. He formulated a research hypothesis that Return On Equity (ROE) increases with an increase in consistency between the corporate and lower-level business strategies. The research hypothesis was signicantly conrmed by an empirical investigation of the corporate strategies, using a sample of the 35 largest German diversied rms [52].
A case in point is IKEA, which was founded over 60 years ago in Southern Sweden. It has since grown to become the world's largest furniture retailer. During its expansion in the 1960s, IKEA also laid the groundwork for its purchasing strategy, relying on long-term relationships with selected suppliers as external sources for its oerings. Today, its supply network spans the entire world and has become increasingly complex [53].
A pivotal role in this network is played by \IKEA of Sweden". This leading business unit not only manages IKEA's product range, but also supervises the entire IKEA universe and develops long-term market-ing, logistics and purchasing strategies. IKEA designs and purchases products that entail low production and transportation costs by carefully taking into account all the activities performed in the network from raw materials to customer homes. Remaining faithful to its original external orientation, IKEA performs only a few of these activities internally while it intensively uses its relationships with suppliers to combine its internal and their external resources [53]. IKEA of Sweden in fact acts as a central unit to manage the suppliers.
Supply networks are widely publicized and re-searched phenomena, especially in high-tech sectors where the likes of Dell, Microsoft or Genentech pursue their network strategies through research and devel-opment joint ventures, cross-licensing or strategic al-liances [54]. Networks are not only important for small rms that need to interact with their peers to supple-ment their limited resources, but they are fundasupple-mental for large companies as well. For instance, multinational companies in the steel, paper and automotive industries interact tightly with their suppliers, sub-suppliers, distributors and customers to develop new technologies or increase eciency [55]. There are many examples of large rms from several sectors that relied strongly on networks for their rapid growth: Apple, Benetton, Toyota, Corning and McDonald's [56].
FLOW NETWORKS
Since the `ow network' concept is an integral part of the proposed solution in this research, a brief overview of the concept is provided here. A ow network is a directed graph in which each node can produce, consume or pass a ow. Examples of the ow networks include electrical and urban transportation, telecom-munication, railroad and oil product pipeline networks. Each directed arc is a one-way conduit for the ow with a dened capacity. Nodes are conjunction points of ow paths and can only pass the ow (not store or consume it) except for two special types of nodes: the source node(s) and the sink node(s). A source node has only outgoing arc(s) and produces the ow, while a sink node has only incoming arc(s) and consumes the ow. Several studies [57,58] provide comprehensive surveys of algorithms for solving network-ow problems.
A ow network G = (V; E) is a directed graph in which each arc (u; v) 2 E has a nonnegative capacity, i.e. c(u; v) 0. If (u; v) =2 E, it is assumed that c(u; v) = 0. In a typical ow network, consider two distinguished nodes: source node, s, and sink node, t. It is assumed that every arc lies on some path from the source to the sink. A ow is a real-valued function f : V V ! R that satises the following properties: a) Capacity constraint: for all u; v 2 V , f(u; v)
c(u; v).
b) Skew symmetry: for all u; v 2 V , f(u; v) = f(v; u).
c) Flow conservation:P for all u 2 V fs; tg,
v2Vf(u; v) = 0.
f(u; v), which can be positive, zero or negative, is the ow from node u to node v. Furthermore, a ow network may have several sources and sinks rather than just one of each. In this case, the source and sink
nodes should be replaced with a set of source nodes and a set of sink nodes in the aforementioned denition, respectively.
The multi-commodity ow problem consists of shipping several dierent commodities from their re-spective sources to their sinks through a common network so that the total ow going through each edge does not exceed its capacity. Associated with each commodity is a demand which is the amount of that commodity that we wish to ship through the network [58]. Given a multi-commodity ow problem, we would like to know if there is a feasible ow, i.e. a way of shipping the commodities that satises the demands as well as the capacity constraints. This problem can be solved using either exact algorithms or approximation algorithms [59,60] to speed up the solution.
OVERVIEW OF THE PROBLEM Problem Denition
A supply chain is considered with multiple members in at least four stages, providing k dierent types of products to the customers. Supply chain stages include suppliers, manufacturers, distributors and retailers. Each product is manufactured from a number of basic components or raw materials provided by the suppliers. A manufacturer can potentially produce all products, limited by its production and delivery capacity or by its strategies. Any supplier has a restricted capacity for providing each kind of basic components. The distributors, according to their distribution capacity, are able to send the products from the manufacturers to the retailers. Finally the retailers sell the products to the customers. The aforementioned denition removes two simplifying assumptions in the previous works containing quantitative analyses, i.e. limited number of members in the supply chain and single-product case. Thus, a more general and realistic problem is investigated.
The proposed mechanism aims to minimize total operations costs for the entire supply chain. Distri-bution, transportation, lost sales, holding inventory, excess capacity and production are considered as dier-ent compondier-ents of the total costs in the supply chain. In this way, higher competitiveness for the supply chain is achieved by lower overall cost of providing products to the end-customers. We develop a linear programming model for the problem considering single-period case.
Assumptions
Sale prices of the products are assumed to be inde-pendent of the chain performance because they are
derived from the overall supply and demand in a competitive market and are not controlled signicantly by individual members in a supply chain. The problem here, therefore exclusively concerns with minimizing costs of providing products to the customers.
The operation of the supply chain is focused here on a single planning period, as the decisions are in practice usually made at the beginning of each period. The members in the supply chain are assumed to follow the xed interval policy for inventory control. Hence, an agreement exists on a xed order placement period for the products. However, the model may be expanded in the future to include multiple periods. Members only make decisions about quantities and sources of their orders. Retailers are also provided, at the beginning of each period, with customer demand information for dierent types of products. Manufacturers use all of the received supplies to produce nal products. Moreover, manufacturers and retailers can hold inven-tory of products. In practice, distributors given the demand information, rst examine ways of providing products from the manufacturers to the retailers before placing order to them. Therefore, distributors are considered as unpreventable intermediate nodes and we do not consider a case in which excess inventory remain in distributor as the end of planning period. Contrary to distributors, holding inventory by retailers is commonplace.
Obviously, most real-world scenarios involve more intricate and complicated characteristics such as using dierent inventory management systems and stochastic nature of demand. However, this paper as an ongoing research aims to extend the previous studies by consid-ering multiple stages and multiple products. Thus, as a primary step, the proposed coordination mechanism is studied with potential for more complex situations. COORDINATION MECHANISM
Consider a directed graph G = (V; E) in which each node represents a member of the supply chain and each directed arc represents a potential relationship between two members. Every directed arc (u; v) shows the possibility of providing basic components, raw materials or nished products from member u to member v. Arc capacities are given as capacities for supply, production, distribution and transportation (depending on nature of a relationship) from an orga-nization to another for a planning period. Moreover, a cost factor is assigned to each arc representing the costs of supply, production, distribution and transportation for each unit of a product or component. These costs are assigned to the rst member in a relationship (i.e. organization u).
Notation used in the model is listed below:
p: index for number of dierent types of compo-nents/materials;
k: index for number of dierent of types of products; i: index indicating type of product, where i = 1; 2; ; k;
j: index indicating type of component (or raw material), where j = 1; 2; ; p;
aij: necessary quantity/amount of component/raw
material type j necessary to produce every unit of product type i;
Ai = fai1; ai2; ; aipg: set of components/raw
materials composing one unit of a product type i (for example, if A4 = f0; 2; 1g, then every unit of forth
type of products contains two units of component type 2 and one unit of component type 3. It is obvious that component type 1 is not needed to produce type of product);
Sset = fsps; 8s = 1; 2; ; Sg: set of suppliers;
Mset = fmanum; 8m = 1; 2; ; Mg: set of
manu-facturers;
Dset = fdistd; 8d = 1; 2; ; Dg: set of distributors;
Rset = fretr; 8r = 1; 2; ; Rg: set of retailers;
Network (I): a ow network with vertices consisting of Mset, Dset and Rset and arcs which connect these vertices;
Network (II): a ow network with vertices consisting of Sset and Mset and arcs which connect these vertices;
V1: set of vertices of Network (I) (V1 =
MsetSDsetSRset);
V2: set of vertices of Network (II) (V2 =
SsetSMset);
V : set of vertices of directed graph G;
dir: quantity of customer demand for product type
from retailer r (where r = 1; 2; ; R);
ci(u; v): capacity of arc (u; v) for ow of product i (in
Network (I));
oi(u; v): cost of ow of each unit of product i through
arc (u; v) (in Network (I));
fi(u; v): value of ow of product type i in arc (u; v)
(in Network (I));
cj(u; v): capacity of arc (u; v) for ow of component
(or raw material) type j (in Network (II));
oj(u; v): cost of ow of component/raw material type
j through arc (u; v) (in Network (II));
fj(u; v): value of ow of component/raw material
type j through arc (u; v) (in Network (II));
QPim: quantity of production of ith type of products
Inv(I)ir: inventory level corresponding to rth retailer
and ith type of products at the beginning of the planning period;
Inv(II)ir: inventory level corresponding to rth
re-tailer and ith type of products at the end of the planning period;
Inv(I)im: inventory level corresponding to mth
man-ufacturer and ith type of products at the beginning of the planning period;
Inv(II)im: inventory level corresponding to mth
manufacturer and ith type of products at the end of the planning period;
Hir: holding cost corresponding to rth retailer for
every remained unit of ith type of products' inventory at the end of planning period;
Him: holding cost corresponding to mth
manufac-turer for every remained unit of ith type of products' inventory at the end of planning period;
LSir: lost sale cost corresponding to rth retailer and
every unit of ith type of products;
ECCi(u; v): excess capacity cost corresponding to arc
(u; v) (u; v 2 V1);
ECCj(u; v): excess capacity cost corresponding to arc
(u; v) (u; v 2 V2);
UCim: production cost for each unit of ith type of
product by mth manufacturer;
P Rir: order fulllment priority assigned to rth
retailer and ith type of products (0 < P Rir 1);
z: objective function representing the total cost incurred by the supply chain.
As it is clear from the notation, the original directed graph G representing the whole supply chain is logically decomposed into two parts: Network (I) which includes manufacturers, distributors and retailers, and Network (II) which covers suppliers and manufactur-ers. In Network (I) products ow, while in Network (II) components/raw materials ow. In Network (I), manufacturers and retailers are considered as sources and sinks of ow, respectively; while in Network (II), suppliers and manufacturers are considered to take these roles.
Parameters ci(u; v), cj(u; v), oi(u; v) and oj(u; v)
are given as input data for each planning horizon for which the model is used. ci(u; v) is interpreted
as maximum feasible capacity of organization u for providing (i.e. distributing and transporting) product i and delivering it to organization v with cost oi(u; v).
oi(u; v) is considered as distribution transportation
costs. cj(u; v) and oj(u; v) have similar interpretations
replacing products with basic components (or raw materials). dir is another input parameter to the
model. LSir, Hir, Inv(I)ir, Inv(I)im, ECCi(u; v),
ECCj(u; v) and UCim are also predened parameters
or available from previous periods' data given as inputs to the model. Parameter P Rircan be initially assigned
value one. If there is no feasible solution for the model, it might be reduced for some retailers with less cooperative background and solve the model again. Application of P Rir as well as other parameters are
claried further in the next section. Finally, fi(u; v),
fj(u; v) and QPimare decision variables.
The proposed model for the whole supply chain is provided as follows:
min z = 0 @ X u;v2V1 k X i=1
oi(u; v)fi(u; v)
1 A + 0 @ X u;v2V2 p X j=1
oj(u; v)fj(u; v)
1 A
+ XR
r=1 k
X
i=1
dir Inv(I)ir
X
u2V1
fi(u; retr)
! LSir !!! + R X r=1 k X i=1
(Inv(I)irHir)
!!
+ XM
m=1 k
X
i=1
(Inv(I)imHim)
! + 0 @ X u;v2V1 k X i=1
(ci(u; v) fi(u; v)ECCi(u; v))
!1 A + 0 @ X u;v2V2 0 @Xp
j=1
(cj(u; v) fj(u; v)ECCj(u; v))
1 A
1 A
+ XM
m=1 k
X
i=1
QPimUCim
!
; (1)
subject to:
fi(u; v) ci(u; v); 8i = 1; 2; ; k; 8u; v 2 V1;
(2) fi(u; v)= fi(v; u); 8i=1; 2; ; k; 8u; v 2 V1;
(3) X
v2V1
fi(u; v) = 0; 8i = 1; 2; ; k; 8u 2 Dset;
X
u2V1
fi(u; retr) (dir Inv(I)ir)P Rir;
8i = 1; 2; ; k; 8r = 1; 2; ; R; (5) fj(u; v)cj(u; v); 8j =1; 2; ; p; 8u; v 2 V2; (6)
X
u2V2
fj(u; manum) k
X
i=1
(aij
X
v2V1
fi(manum; v));
8j = 1; 2; ; p; 8m = 1; 2; ; M; (7) QPim+ Inv(I)im
X
v2V1
fi(manum; v);
8j = 1; 2; ; p; 8m = 1; 2; ; M; (8) (dir Inv(I)ir
D
X
d=1
fi(distd; retr)) 0;
8hi = 1; 2; ; k; 8r = 1; 2; ; R; (9) fj(sps; manum) 0; 8s = 1; 2; ; S;
8m = 1; 2; ; M; 8j = 1; 2; ; p; (10) fi(manum; distd) 0; 8m = 1; 2; ; M;
8d = 1; 2; ; D; 8i = 1; 2; ; k; (11) fi(distd; retr) 0; 8d = 1; 2; ; D;
8r = 1; 2; ; R; 8i = 1; 2; k; (12)
QPim 0; 8m = 1; 2; ; M; 8i = 1; 2; ; k:
(13) Expression 1 describes objective function which indi-cates total operational costs of the supply chain. Is consists of eight terms logically separated by parenthe-ses. The rst and second terms indicate ow costs (i.e. purchasing and transportation costs) in Network (I) and Network (II), respectively. The third term shows cost of lost sales. The fourth and the fth parentheses represent holding cost of remained inventory from the previous period. Costs incurred by the supply chain because of excess capacity in Network (I) and Network (II) are shown by the two subsequent terms. Finally, the eighth term stands for production costs.
There are also twelve constraint sets denoted by Relations 2 to 13 in the model. First three constraint sets (Relations 2, 3 and 4) are equivalent to capacity constraint, skew symmetry and ow conservation prop-erties of ow networks (for Network (I)), respectively. Constraints 5 guarantees satisfying demand in retailers.
Constraints 6 are equivalent to capacity constraint of ow networks (for Network (II)). Constraints 7 guarantee satisfying demand from the manufacturers for basic components to produce sucient products.
Constraints 8 assure sucient production by the manufacturers. Constraints 9 both assure non-negativity of lost sales and not having remained inventory at retailers (note that similar constraints for manufacturers are implicitly satised according to model). Finally, Constraints 10 to 13 are non-negativity constraints on the values of out ows and quantities of product.
Note that if supply chain members choose order quantities according to the solution of the model, they will not have any excess inventory. However, they may opt for holding inventory because of their own forecast of future demands or keeping safety stock (i.e. Inv(II)ir 0 or Inv(II)im 0). Therefore, Inv(I)ir
and Inv(I)im are not necessarily zero at the beginning
of the upcoming planning period.
Since the model is a linear programming model, existing polynomial-time algorithms such as Kar-markar's algorithm [61] can be used to solve them eciently. Upon solving the model and informing the supply chain members of their respective ow values, the members are able to make decisions and place orders such that optimal situation for the whole supply chain would be attainable.
CORPORATE SUPPLY OPTIMIZER
To coordinate the supply chain in practice, a central software entity named Corporate Supply Optimizer (CSO) plays a central role whose architecture is de-scribed later in this section. The suppliers and manu-facturers are asked to provide Aisets information to the
CSO. Whenever Ai changes, they can inform the CSO
immediately. At the beginning of a planning period, for example at beginning of each month, the retailers also provide demand forecast information to the CSO. Every supplier, manufacturer and distributor in supply chain provides the CSO with names of connected organizations in its next stage along with associated capacity and cost parameters. In other words, a retailer retrsends dir and every non-retailer member of supply
chain such as u species arcs (u; v) and values for ci(u; v) and oi(u; v) to the CSO. Formally, Info(u)
denoting information given to the CSO by member of the supply chain is dened for dierent members as follows:
Info(sps)
=
(cj(sps; v); oj(sps; v); ECCj(sps; v) :
j = 1; 2; ; p (sps; v) 2 E
Info(manum)
= 8 > > < > > :
(ci(manum; v); oi(manum; v);
ECCi(manum; v);
Inv(I)im; Him; UCim) : i = 1; 2; ; k;
(manum; v) 2 E;
9 > > = > > ;;(15) Info(distd)
= 8 < :
(ci(distd; v); oi(distd; v)
ECCi(distd; v)) : i = 1; 2; ; k;
(distd; v) 2 E;
9 =
;; (16)
Info(retr)
= f(dir; Inv(I)ir; Hir; LSir) : i = 1; 2; ; kg : (17)
Note that providing the CSO with information accord-ing to the above four sets is the most cooperative case. In minimum, only c(u; v), o(u; v) and dir would be
sucient to form the optimization model [62]. In the latter case, unknown parameters may be forecast based on previous periods' information. In the worst case in which no information is available these parameters and members do not want to announce them cooperatively, corresponding terms may be omitted from objective functions and constraints which results in a less actual but still quite helpful model.
Priority parameter PRir which is set by the
CSO, reects cooperative records of a member (the greater value means a more cooperative behavior). Cooperation is the degree to which a supply chain member abides by the order quantities declared by the CSO. This parameter might take initial value of one. If there is not any feasible solution for the model because of limited ow capacity, the CSO could reduce priority parameters for members with less cooperative records. As a result, tendency to become selsh, and act in a locally-optimum fashion, would be deterred over time. Using gathered information, the CSO is then able to construct and solve the optimization model and send the ows' values to the corresponding supply chain members. These orders are placed to assure the entire supply chain operations with minimum feasible costs and satisfying customer demand. Necessary decision information provided by the CSO for manufacturer manum, distributor distd and retr retailer are denoted
by Expressions 18, 19 and 20: Decision Info(manum; u; j)
= 8 < :
(fj(u; manum); QPim) :
(u; manum) 2 E;
i = 1; 2; ; k; m = 1; 2; ; M 9 =
;; (18)
Decision Info(distd; u; i)
= ffi(u; distd) : (u; distd) 2 Eg ; (19)
Decision Info(retr; u; i)
= ffi(u; retr) : (u; retr) 2 Eg : (20)
AN APPLICATION
Iran Khodro is the oldest and the largest vehicle manufacturing company in Iran. Having an average share of 65 percent of domestic vehicle production market, Iran Khodro produced 550,000 vehicles in year 2008 (http://www.ikco.com/default.aspx). In the past, the company used hundreds of independent do-mestic and international suppliers for delivering parts and sub-assemblies to its multiple production lines. Frustrated by long delivery delays, uncoordinated and non-cooperative suppliers and local sub-optimized decisions by each supplier, the company moved to-wards developing a coordinated and empowered supply chain.
In 1993, Iran Khodro helped establishing SAPCO (Supplying Automotive Parts Company), a member of Iran Khodro Industrial Group with a mission of \the localization of automotive parts and development of Iran Khodro part supply chain". Its premier sta was a group of Iran Khodro em-ployees who worked in Supply Chain department and helped establish the new company with a planned supply chain operation for the mother com-pany (www.sapco.com).
A paradigm shift has occurred in Iran Khodro's Supply Chain operation, matching with a Just-in-time mentality learned from the Japanese counterparts [63]. SAPCO moved from a traditional adversarial competi-tion among the suppliers towards a measured develop-ment of a supplier network in which various members are coordinated by the ultimate stakeholder, namely Iran Khodro. Although SAPCO is a Strategic Business Unit (SBU), it acts a corporate supply coordinator arm of Iran Khodro industrial group.
The problem in this paper is motivated and de-ned based on the type of actual operations in SAPCO, which manages the requirements of Iran Khodro for coordination of its supply chain. The members in various stages, though are independent and wish the highest throughputs with lowest costs locally, act in a coordinated fashion for the lowest overall costs of the supply chain. As in JIT paradigm, a one period planning horizon is used, as inventory or back-order are highly undesirable. The problem is formulated exactly with multiple customers, multiple stages and multiple products under stable and deterministic capacity and demand.
An initial version of the CSO was implemented at SAPCO in 2008, which was received well by the company and the suppliers. It allowed the company to obtain an initial optimum solution and various what-if simulation results for follow-up supply negotiation within the supply chain. A modied version of the system with expanded input-output designs is to be implemented in a near future, and is expected to be eventually integrated with the existing information systems. The above framework is not limited to Iran Khodro and Iran alone, but is the current norm in a widespread range of industries in Iran and in the World. EVALUATION
In this section, sample computations have been pro-vided to demonstrate the solution in depth. Further-more, simulation results show how the solution would be useful in dierent situations.
Sample Computations
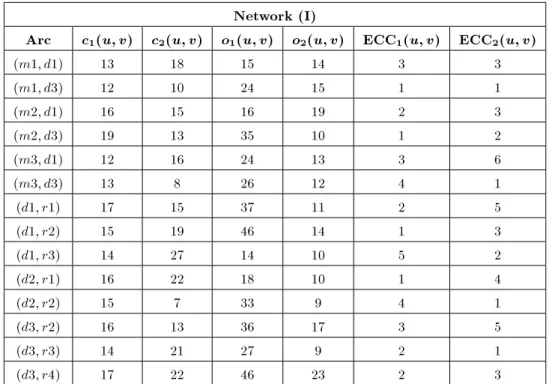
This section provides a numerical example to illustrate the mechanism. Consider a supply chain with two suppliers, three manufacturers, three distributors and four retailers. In this example, two types of products are manufactured from three types of basic components such that A1= f11; 4; 19g and A2= f5; 6; 12g.
All of the illustrative computations in this section are based on this example. Finally all priority factors are considered having value one. Tables 1 to 4 represent the supply chain parameters with regard to ow net-work description of a sample supply chain described before.
Using ILOG CPLEX 11.0 standard mathematical programming solver, the results appear in Tables 5, 6 and 7.
The minimized total cost equals 46295.63. Note that in this example there is no lost sale. This fact
Table 1. Network (I) specications. Network (I)
Arc c1(u; v) c2(u; v) o1(u; v) o2(u; v) ECC1(u; v) ECC2(u; v)
(m1; d1) 13 18 15 14 3 3
(m1; d3) 12 10 24 15 1 1
(m2; d1) 16 15 16 19 2 3
(m2; d3) 19 13 35 10 1 2
(m3; d1) 12 16 24 13 3 6
(m3; d3) 13 8 26 12 4 1
(d1; r1) 17 15 37 11 2 5
(d1; r2) 15 19 46 14 1 3
(d1; r3) 14 27 14 10 5 2
(d2; r1) 16 22 18 10 1 4
(d2; r2) 15 7 33 9 4 1
(d3; r2) 16 13 36 17 3 5
(d3; r3) 14 21 27 9 2 1
(d3; r4) 17 22 46 23 2 3
Table 2. Network (II) specications. Network (II)
Arc c1(u; v) c2(u; v) c3(u; v) o1(u; v) o2(u; v) o3(u; v) ECC1(u; v) ECC2(u; v) ECC3(u; v)
(s1; m1) 193 190 420 10 7 15 2 1 1
(s1; m2) 257 210 530 11 5 11 3 2 3
(s2; m1) 264 348 370 10 9 10 1 1 4
(s2; m2) 339 144 445 8 8 14 2 2 1
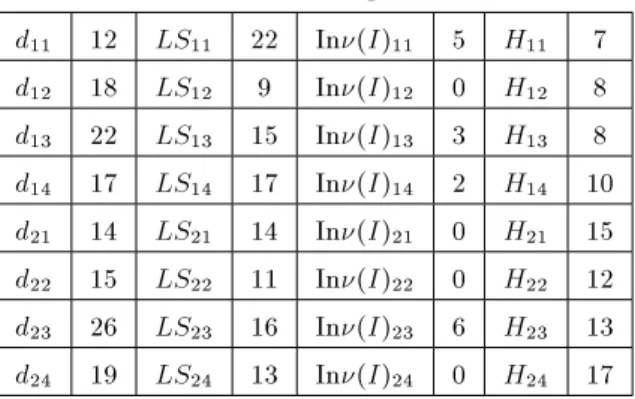
Table 3. Retailers' parameters.
d11 12 LS11 22 In(I)11 5 H11 7
d12 18 LS12 9 In(I)12 0 H12 8
d13 22 LS13 15 In(I)13 3 H13 8
d14 17 LS14 17 In(I)14 2 H14 10 d21 14 LS21 14 In(I)21 0 H21 15 d22 15 LS22 11 In(I)22 0 H22 12 d23 26 LS23 16 In(I)23 6 H23 13 d24 19 LS24 13 In(I)24 0 H24 17
Table 4. Manufacturers' parameters.
In(I)11 0 H11 10 UC11 10
In(I)12 2 H12 12 UC12 12
In(I)13 1 H13 8 UC13 8
In(I)21 1 H21 13 UC21 13
In(I)22 3 H22 16 UC22 16
In(I)23 0 H23 17 UC23 17
Table 5. Network (I) ow values. Arc f1(u; v) f2(u; v)
(m1; d1) 13 18
(m1; d3) 0.4 5.4
(m2; d2) 16 15
(m2; d3) 17.6 13
(m3; d1) 1 16
(m3; d3) 13 0.6
(d1; r1) 0 6
(d1; r2) 0 8
(d1; r3) 14 20
(d2; r1) 7 8
(d2; r2) 9 7
(d3; r2) 9 0
(d3; r3) 6 0
(d3; r4) 16 19
Table 6. Network (II) ow values Arc f1(u; v) f2(u; v) f3(u; v)
(s1; m1) 193 190 165
(s1; m2) 171 210 530
(s2; m1) 71.1 4 370
(s2; m2) 339 92.5 445
(s2; m3) 236.9 155.5 465
Table 7. Quantity of products.
QP11 13.7
QP12 31.6
QP13 13
QP21 22.4
QP22 25
QP23 16.9
makes sense because the networks' capacities are set such that the supply chain is capable of fullling all the customer demands. Moreover, there is no remained inventory after the planning period (i.e. Inv(II)ir and
Inv(II)im have become zero).
In the lack of sucient capacity, lost sale plays a role in total costs. In the aforementioned example if c3(s2; m2) = 0, solution of the model results in 78.2
lost sale cost. RESULTS
To evaluate the solution the locally optimum behav-ior by the members is considered as a comparison benchmark to determine usefulness of the proposed mechanism (see Appendix). Consider performance ratio as an indicator for this purpose:
Performance Ratio = Total Cost without SCO Total Cost with SCO :(21) First we want to determine how performance ratio is dependant to variety of ows in the supply chain. k + p is a metric to represent variety of ows in the supply chain. Simulated supply chain contains 70 suppliers, 10 manufacturers, 20 distributors and 50 retailers. Values for k and p are set randomly such that k < p and their summation equals the intended value. during simulation. Figure 1 depicts simulation results from ILOG CPLEX 11.0 standard mathematical programming solver.
The average value for performance ratio is 1.354 or 26.14% reduction in total costs.
In order to determine eectiveness of the mech-anism in dierent sizes of the supply chain, the prob-lem is simulated considering a supply chain providing 20 dierent products from 150 various components. Network size can be expressed as the total number of supply chain members:
Network Size = S + M + D + R: (22)
During the simulation random values for number of members are set such that D M, R D and S M. Figure 2 illustrates how performance ratio varies with network size.
Figure 1. Dependency of performance ratio to the variety of ows.
Figure 2. Dependency of performance ratio to the network size.
Considering the average value for performance ratio is 1.358, it can be concluded that network size does not aect the performance ratio.
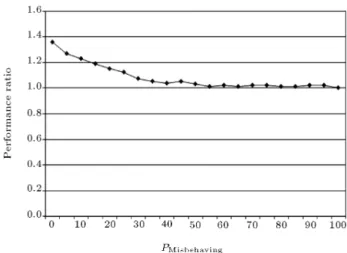
Finally, we want to investigate how the ratio (percentage) of misbehaving members which do not be-have in a locally optimum style aect the performance ratio. Consider a supply chain with 70 suppliers, 10 manufacturers, 20 distributers and 50 retailers in which 20 dierent products from 150 various components ow. Note that the number of misbehaving members in each stage of the supply chain is appropriate to relative number of the stage's members comparing with the whole number of supply chain members. Figure 3 depicts the eect of the percentage of misbehaving members, i.e. PMisbehaving, on the performance ratio.
According to simulation results, performance ra-tio deteriorates when the percentage of misbehaving members increase. With PMisbehaving = 10% the
per-formance ratio is 1.23. When PMisbehaving = 30% the
performance ratio falls to 1.07. A stable performance
Figure 3. Dependency of performance ratio to the percentage of misbehaving members.
ratio about 1.03 is observed when PMisbehaving 40%.
Thus, higher percentage of misbehaving members leads to lower eectiveness of the proposed solution.
According to the aforementioned simulation re-sults, the proposed solution responds eciently in dierent situations. The CSO could be implemented using practical IT-based architectures to be exploited in real circumstances.
CONCLUSION
This paper proposes a software-based coordination mechanism for a multi-stage and multi-product supply chain. Each type of product is produced from a set of basic components or raw materials. The supply chain is modeled as a ow network considering operation capacities and costs for all members of the supply chain. By developing and solving a set of linear programming models, members are able to make decisions which result in overall minimum cost for the entire supply chain. Existing literature, assuming a limited number of members in the supply chain and only a single product, did not reect the real world supply chains.
To achieve the above goal, a central entity named Corporate Supply Optimizer (CSO) receives informa-tion about relainforma-tionships, capacities, costs and some operational parameters from members of the supply chain at the beginning of the planning period. The CSO then forms and solves a linear programming model and sends optimal order quantities to the members.
It is possible that supply chain members may place orders and get products (or components) more than specied optimum ow values determined by the CSO so that they hold inventory at the end of the planning period. Maintaining safety stock or forecast-ing capacity deterioration can explain such behavior. At all events, the CSO gets the information about the behavior of the members (directly from themselves or
indirectly inferred from the whole supply chain received information) and might punish selsh members (i.e. members that tend to act based on their locally-optimum preference rather than the solution provided by the CSO), with reduction of their order fulllment priority factor in the upcoming periods.
Further research can focus on several issues. Developing an exact reputation mechanism to detect non-cooperative members and consequently exact de-termination of priority factor in the model, exploration of multi-period problem, extending the functionality of the CSO in areas such that strategic planning, investigating stochastic models are proposed as future works.
REFERENCES
1. Campbell, A., Devine, M. and Young, D., A Sense of Mission, FT/Pitman Publishing (1993).
2. Lynch, R., Corporate Strategy, 4th Ed., Prentice Hall (2006).
3. Young, D. and Sutclie, B. \Value gaps-who is right? -The raiders, the market or the managers?", Long Range Planning, 23(4), pp. 20-34 (1990).
4. Goold, M. and Campbell, A., Strategies and Styles, Blackwell, Oxford (1987).
5. Goold, M. and Quinn, J.J., Strategic Control, FT/Pitman Publishing (1993).
6. Li, X. and Wang, Q. \Coordination mechanism of sup-ply chain systems", European Journal of Operational Research, 179(1), pp. 1-16 (2007).
7. Fugate, B., Sahin, F. and Mentzer, J.T. \supply chain management coordination mechanisms", Journal of Business Logistics, 27(2), pp. 129-162 (2006). 8. Chopra, S. and Meindl, P., Supply Chain Management:
Strategy, Planning and Operations, United States: Prentice-Hall (2003).
9. Cachon, G.P. and Lariviere, M. \Supply chain coordi-nation with revenue-sharing contracts: Strengths and limitations", Management Science, 51(1), pp. 30-44 (2005).
10. Shin, H. and Benton, W.C. \A quantity discount approach to supply chain coordination", European Journal of Operational Research, 80(2), pp. 601-616 (2007).
11. Liu, Y., Zhang, Y. and Zhao, Z. \The survey on supply chain coordination with contracts", Proceedings of 7th ACM International Conference on Electronic Commerce, pp. 807-809 (2005).
12. Cachon., G.P. \Supply chain coordination with con-tracts", Handbooks in Operations Research and Man-agement Science: Supply Chain ManMan-agement: Design, Coordination and Operation, S. Graves and T. deKok, Eds., in 1st Ed., Elsevier Publishing Company (2003).
13. Lee, H.L. and Whang, S. \Information sharing in a supply chain", International Journal of Manufacturing Technology and Management, 1(1), pp. 79-93 (2000). 14. Lee, H.L., So, K.C. and Tang, C.S. \The value
of information sharing in a two-level supply chain", Management Science, 46(5), pp. 626-643 (2000). 15. Cachon, G.P. and Fisher, M. \Supply chain inventory
management and the value of shared information", Management Science, 46(8), pp. 1032-1048 (2000). 16. Lee, H.L., Padmanabhan, V. and Whang, S.
\Informa-tion distor\Informa-tion in a supply chain: the bullwhip eect", Management Science, 3(4), pp. 546-558 (1997). 17. Metters, R. \Quantifying the bullwhip eect in supply
chains", Journal of Operations Management, 15(2), pp. 89-100 (1997).
18. Kelle, P. and Akbulut, A. \The role of ERP tools in supply chain information sharing, cooperation and cost optimization", International Journal of Production Economics, 93-94(1), pp. 41-52 (2005).
19. Grieger, M. \Electronic marketplaces: a literature review and call for SCM research", European Journal of Operational Research, 144(2), pp. 280-294 (2003). 20. Eng., T.Y. \The role of e-marketplaces in supply
chain management", Industrial Marketing Manage-ment, 33(2), pp. 97-105 (2004).
21. Bourland, K.E., Powell, S.G. and Pyke, D.F. \Exploit-ing timely demand information to reduce inventories", European Journal of Operational Research, 92(2), pp. 239-253 (1996).
22. Singh, R., Salam, A.F. and Iyer, L. \Agents in e-supply chains", Communications of the ACM, 48, pp. 109-115 (2005).
23. Sahin, F. and E. Robinson, P. \Flow coordination and information sharing in supply chains: Review, impli-cations, and directions for future research", Decision Sciences, 33(4), pp. 505-536 (2002).
24. Li, L. \Information sharing in a supply chain with horizontal competition", Management Science, 48(9), pp. 1196-1212 (2002).
25. Fox, M.S., Chionglo, J.F. and Barbuceanu, M. \The integrated supply chain management system", Internal Report, Department of Industrial Engineering, Univer-sity of Toronto (1993).
26. Fox, M.S., Barbuceanu, M. and Teigen, R. \Agent-oriented supply-chain management", International Journal of Flexible Manufacturing Systems, 12(2-3), pp. 165-188 (2000).
27. Dudek, G. and Stadtler, H. \Negotiation-based col-laborative planning between supply chain partners", European Journal of Operational Research, 163(3), pp. 668-687 (2005).
28. Chen, Y., Peng, Y., Finin, T., Labrou, Y. and Cost, S. \A negotiation-based multi-agent system for supply chain management", Proceedings of the AAAI Work-shop on Articial Intelligence for Electronic Commerce (1999).
29. Fazel Zarandi, M.H., Moattar Hosein, S.M., Bastani, S. and Mohebi, A. \A fuzzy intelligent information agent architecture for supply chains", Scientia Iranica, 15(5), pp. 623-636 (2008).
30. Ding, D. and Chen, J. \Coordinating a three level supply chain with exible return policy", Omega, 36(5), pp. 865-876 (2008).
31. Fink, A. \Supply chain coordination by means of au-tomated negotiations", Proceedings of the 37th Hawaii International Conference on System Sciences (2004). 32. Silver, E.A., Pyke, D.F. and Peterson, R., Inventory
Management and Production Planning and Scheduling, 3rd Ed., Wiley (1998).
33. Dogan, K. and Goetschalckx, M. \A primal decompo-sition method for the integrated design of multi-period production-distribution systems", IIE Transactions, 31, pp. 1027-1036 (1999).
34. Sarmiento, A.M. and Nagi, R. \A review of inte-grated analysis of production-distribution systems", IIE Transactions, 31, pp. 1061-1074 (1999).
35. Dhaenens-Flipo, C. and Finke, G. \An integrated model for an industrial production-distribution prob-lem", IIE Transactions, 33, pp. 705-715 (2001). 36. Boudiaa, M. and Prins, C. \A memetic algorithm with
dynamic population management for an integrated production-distribution problem", European Journal of Operational Research, 195(3), pp. 703-715 (2007). 37. Zipkin, P.H., Foundations of Inventory Management,
1st Ed., McGraw-Hill/Irwin (2000).
38. Chen, Z. \Integrated production and distribution op-erations: taxonomy, models, and review", Handbook of Quantitative Supply Chain Analysis: Modeling in the E-Business Era, Chapter 17, D. Simchi-Levi, S.D. Wu, Eds. (2004)
39. Chopra, S. \Designing the delivery network for a supply chain", Transportation Research, Part E, 39(2), pp. 123-140 (2003).
40. Tsiakis, P. and Papageorgiou, L.G. \Optimal pro-duction allocation and distribution supply chain net-works", International Journal of Production Eco-nomics, 111(2), pp. 468-483 (2008).
41. Amiri, A. \Designing a distribution network in a supply chain system: Formulation and ecient so-lution procedure", European Journal of Operational Research, 171(2), pp. 567-576 (2006).
42. Daskin, M.S., Network and Discrete Location, New York, John Wiley and Sons (1995).
43. Langevin, A. and Riopel, D., Logistics Systems: De-sign and Optimization, 1st Ed., Springer (2005). 44. Meloa, M.T., Nickela, S. and Da Gama, F.S.
\Dy-namic multi-commodity capacitated facility location: a mathematical modeling framework for strategic supply chain planning", Computers and Operations Research, 33(1), pp. 181-208 (2006).
45. Tayur, S., Ganeshan, R. and Magazine, M., Quanti-tative Models for Supply Chain Management, 1st Ed., Springer (1998).
46. Gomes da Silva, C., Figueira, B., Lisboa, J. and Barman, S. \An interactive decision support system for an aggregate production planning model based on multiple criteria mixed integer linear programming", Omega, 34(2), pp. 167-177 (2004).
47. Jayaraman, J. and Pirkul, H. \Planning and coordina-tion of produccoordina-tion and distribucoordina-tion facilities for mul-tiple commodities", European Journal of Operational Research, 133(2), pp. 394-408 (2001).
48. Collis, D. and Montgomery, C., Corporate Strategy, John Wiley (2004).
49. Goold, M., Campbell, A. and Alexander, M., Corporate-Level Strategy: Creating Value in the Multi-business Company, New York, Wiley (1994).
50. De Wit, B. and Meyer, R., Strategy, Process, Content, Context, an International Perspective, 3rd Ed., Thom-son Publishing, London (2004).
51. Goold, M., Campbell, A. and Alexander, M. \Corpo-rate st\Corpo-rategy and parenting theory- briefcase", Long Range Planning, 31(2), pp. 308-314 (1998).
52. Pro, H. \Using consistent corporate strategies to maximize value addition by the parent organization of diversied company", International Journal of Learn-ing and Intellectual Capital, 3(2), pp. 178-194 (2006). 53. Baraldi, E., \Strategy in industrial networks: Expe-riences from IKEA", California Management Review, 50(4), pp. 145-149 (2008).
54. Lorenzoni, G. and Baden-Fuller, C. \Creating a strate-gic center to manage a web of partners", California Management Review, 37(3), pp. 146-163 (1995). 55. Koka, B.R. and Prescott, J.E. \Strategic alliances as
social capital: A multidimensional view", Strategic Management Journal, 23(9), pp. 795-806 (2002). 56. Powell, W.W., \Hybrid organizational arrangements:
New form or transitional development?", California Management Review, 30(1), pp. 67-87 (1987). 57. Ahuja, R.K., Magnanti, T.L. and Orlin, J.B., Network
Flows: Theory, Algorithms, and Applications, United States: Prentice Hall (1993).
58. Goldberg, A.V., Tardos, E. and Tarjan, R.E., Network Flow Algorithms, Paths, Flows, and VLSI-Layout, Springer-Verlag, pp. 101-164 (1990).
59. Awerbuch, B. and Leighton, T. \A simple local-control approximation algorithm for multi-commodity ow", Proceedings of the 34th Annual Symposium on Foundations of Computer Science (1993).
60. Garg, N. and Koenemann, J. \Faster and simpler algorithms for multicommodity ow and other frac-tional packing problems", 39th Annual Symposium on Foundations of Computer Science (1998).
61. Karmarkar, N. \A new polynomial time algorithm for linear programming", Combinatorica, 4(4), pp. 373-395 (1984).
62. Fayazbakhsh, K. \A coordination mechanism for a multiple-member supply chain", M.Sc. Thesis, De-partment of Computer Engineering and IT, Amirkabir University of Technology, Iran (2007).
63. Sepehri, M., Just-in-Time, Not Just in Japan, Case Studies of American Pioneers in JIT Implementation, APICS Publications, New Falls, Georgia (1986).
APPENDIX
Description of Locally Optimum Behavior As mentioned before, selsh supply chain members place orders based on their locally optimum utility rather than complying with the CSO's globally opti-mum solution. If this is the case, each selsh member tries to nd available sources with the lowest cost until its demand is fullled. As mentioned before, the case of locally optimum behavior is used as a benchmark for comparison and evaluating improvements using the CSO.
Consider modeling of supply chain using the concept of ow networks. Assume v is a destination member which wants to receive ow (product, compo-nent or raw materials) from a source node t where an arc (t; v) exists in the corresponding graph. Consider S as an array of information about all potential sources for v to fulll its demand, such that St (tth
element of the array) is an ordered pair (o(t; v); c(t; v)). Remember from previous sections that o(t; v) indicates cost of ow in the arc (t; v), and c(t; v) shows capacity of this arc. In fact, the member v forms array S using the information received from its potential source nodes. The following pseudo-code describes the selsh behavior of the destination member v:
UnfullledDemand = Demand
Sort array S ascendingly based ono(t; v)
While (UnfullledDemand> 0)
ff(t; v) = min (UnfullledDemand, c(t; v)) UnfullledDemand=UnfullledDemand f(t; v) t = t + 1 (i.e. going to the next potential source
with the lowest cos t)g:
Note that since the selsh behavior described in the pseudo code does not depend on the supply chain stage at which the selsh member is located, i or j indices can be associated with c(t; v), o(t; v), and f(t; v) based on the type of corresponding ow (i.e. i index for ows in Network (I) and j index for ows in Network (II)). BIOGRAPHIES
Mehran Sepehri is an Associate Professor in the Graduate School of Management at Sharif University of Technology in Tehran. He earned a PhD in Industrial Engineering and Engineering Management from Stan-ford University, USA. His teaching and research spe-cializations include: Operations Management, Project Management, and Management Information Systems. Kaveh Fayazbakhsh earned his BS in Computer En-gineering from Sharif University of Technology (SUT) and his MS in Computer Engineering from Amirkabir University of Technology, in Tehran. He continued as a teaching and research assistant at SUT before furthering his education in the USA.
Friedoon Ghasemzadeh is an Assistant Professor at the Graduate School of Management at Sharif University of Technology in Tehran, having earned a PhD from McMasters University in Canada. His teach-ing and research specializations include: Management Control and Management Information Systems.