ISSN: 2252-8938, DOI: 10.11591/ijai.v7.i2.pp95-104 95
Evolutionary Computational Algorithm by Blending of PPCA
and EP-Enhanced Supervised Classifier for Microarray
Gene Expression Data
Manaswini Pradhan
P.G Department of Information and Communication Technology, Fakir Mohan University, India
Article Info ABSTRACT
Article history: Received Feb 21, 2017 Revised Apr 7, 2018 Accepted May 19, 2018
In DNA microarray technology, gene classification is considered to be difficult because the attributes of the data, are characterized by high dimensionality and small sample size. Classification of tissue samples in such high dimensional problems is a complicated task. Furthermore, there is a high redundancy in microarray data and several genes comprise inappropriate information for accurate classification of diseases or phenotypes. Consequently, an efficient classification technique is necessary to retrieve the gene information from the microarray experimental data. In this paper, a classification technique is proposed that classifies the microarray gene expression data well. In the proposed technique, the dimensionality of the gene expression dataset is reduced by Probabilistic PCA. Then, an Artificial Neural Network (ANN) is selected as the supervised classifier and it is enhanced using Evolutionary Programming (EP) technique. The enhancement of the classifier is accomplished by optimizing the dimension of the ANN. The enhanced classifier is trained using the Back Propagation (BP) algorithm and so the BP error gets minimized. The well-trained ANN has the capacity of classifying the gene expression data to the associated classes. The proposed technique is evaluated by classification performance over the cancer classes, Acute Myeloid Leukemia (AML) and Acute Lymphoblastic Leukemia (ALL). The classification performance of the enhanced ANN classifier is compared over the existing ANN classifier and SVM classifier.
Keyword:
Artificial Neural Network (ANN),
Back propagation (BP), Dimensionality reduction Evolutionary programming (EP),
Microarray gene expression data,
Probabilistic PCA (PPCA), Supervised classifier,
Copyright © 2018 Institute of Advanced Engineering and Science. All rights reserved.
Corresponding Author: Manaswini Pradhan,
P.G Department of Information and Communication Technology, Fakir Mohan University,
Balasore-756019, Odisha, India.
Email: [email protected]
1. INTRODUCTION
Enormous amount of genomic and proteomic data are available in the public domain. The ability to process this information in ways that are useful to humankind is becoming increasingly important [1]. The computational recognition is a basic step in the understanding of a genome and it is one of the challenges in the analysis of newly sequenced genomes. For analyzing genomic sequences and for interpreting genes, precise and fast tools are necessary [2]. In such situation, conventional and modern signal processing methods play a significant role in these fields [1]. A relatively new area in bio-informatics is Genomic signal processing [14] (GSP). It deals with the utilization of traditional digital signal processing (DSP) methods in the representation and analysis of genomic data.
Gene is a segment of DNA, which contains the code for the chemical composition of a particular protein. Genes serve as the pattern for proteins and some additional products, and mRNA is the main
intermediary that translates gene information in the production of genetically encoded molecules [4]. The strands of DNA molecules usually contain the genomic information represented by sequences of nucleotide symbols, symbolic codons (triplets of nucleotides), or symbolic sequences of amino acids in the corresponding polypeptide chains [2]. Simultaneously monitoring of the expression levels of tens of thousands of genes under diverse experimental conditions has been enabled by gene expression microchip, which is perhaps the most rapidly expanding tool of genome analysis. This provides a powerful tool in the study of collective gene reaction to changes in their environments, and provides indications about the structures of the involved gene networks [3].
Today, using microarrays it is possible to simultaneously measure the expression levels of thousands of genes, possibly all genes in an organism, in a single experiment [4]. Microarray technology has become an indispensable tool in the monitoring of genome-wide expression levels of gene [5]. The analysis of the gene expression profiles in various organs using microarray technologies reveal about separate genes, gene ensembles, and the metabolic ways underlying the structurally functional organization of organ and its physiological function [6]. Diagnostic task can be automated and the accuracy of the conventional diagnostic methods can be improved by the application of microarray technology. Microarray technology enables simultaneous examination of thousands of gene expressions [7].
Efficient representation of cell characterization at the molecular level is possible with microarray technology which simultaneously measures the expression levels of tens of thousands of genes [8]. Gene expression analysis [10] [18] that utilizes microarray technology has a wide range of potential for exploring the biology of cells and organisms [9]. Microarray technology assists in the precise prediction and diagnosis of diseases. Three common types of machine learning techniques utilized in microarray data analysis are clustering [11] [15], classification [12] [16], and feature selection [13] [17]: Of these, classification plays a crucial role in the field of microarray technology. However, classification in microarray technology is considered to be very challenging because of the high dimensionality and small sample size of the gene expression data. Numerous works have been carried out for the effective classification of the gene expression data. A few recent works available in the literature are reviewed in the following section.
2. RELATED WORKS
Some of the recent related research works are reviewed here. Liu et al. [19] have offered an analytical method for categorizing the gene expression data. In the proposed method, dimension reduction has been achieved by utilizing the kernel principal component analysis (KPCA) and categorization has been achieved by utilizing the logistic regression (discrimination). KPCA is a generic nonlinear form of principal component analysis. Five varied gene expression datasets related to human tumor samples has been categorized by utilizing the proposed algorithm. The high potential of the proposed algorithm in categorizing gene expression data has been confirmed by comparing with other well-known classification methods like support vector machines and neural networks. Roberto Ruiz et al. [20] have proposed a novel heuristic method for selecting appropriate gene subsets which can be utilized in the classification task. Statistical significance of the inclusion of a gene to the final subset from an ordered list is the criteria on which their method is based. Comparison result has proved that the method was more effective and efficient than other such heuristic methods. Their method exhibits outstanding performance both in identification of important genes and in minimization of computational cost.
Peng et al. [21] have performed a comparative analysis on different biomarker discovery methods that includes six filter methods and three wrapper methods. After this, they have presented a hybrid approach known as FR-Wrapper for biomarker discovery. The objective of their approach was to achieve an optimum balance between precision and computation cost, by exploiting the efficiency of the filter method and the accuracy of the wrapper method. In their hybrid approach, the majority of the unrelated genes have been filtered out utilizing the Fisher’s ratio method, which is simple, easy to understand and implement. Then the redundancy has been minimized utilizing a wrapper method. The performance of the FR-Wrapper approach has been appraised utilizing four widely used microarray datasets. Experimental results have proved that the hybrid approach is capable of achieving maximum relevance with minimum redundancy.
Mramor et al. [22] have proposed a method for the analysis of gene expression data that gives an unfailing classification model and gives useful insight of the data in the form of informative perception. The proposed method is capable of finding simple perceptions of cancer gene expression data sets utilizing a very small subset of genes by projection scoring and ranking however presents a clear visual classification between cancer types. They have proposed in view of data visualization’s promising part in penetrative data analysis, short runtimes and interactive interface, that data visualization would enhance other recognized techniques in cancer microarray analysis assisted by efficient projection search methods and become part of the standard analysis toolbox. Wong et al. [23] have proposed regulation-level method for symbolizing the
microarray data of cancer classification that can be optimized utilizing genetic algorithms (GAs). The proposed symbolization decreases the dimensionality of microarray data to a greater extent compared with the traditional expression-level features. Several statistical machine-learning methods have become usable and efficient in cancer classification because noise and variability can be accommodated in the proposed symbolization. It has been confirmed that the three regulation level representation monotonically converges to a solution by experimental results on real-world microarray datasets. This has confirmed the presence of three regulation levels (up-regulation, down-regulation and non-significant regulation) associated with each particular biological phenotype. In addition to improvement to cancer classification capability, the ternary regulation-level promotes the visualization of microarray data.
Ahmad M. Sarhan [7] has developed an ANN and the Discrete Cosine Transform (DCT) based stomach cancer detection system. Classification features are extracted by the proposed system from stomach microarrays utilizing DCT. ANN does the Classification (tumor or no-tumor) upon application of the features extracted from the DCT coefficients. In his study he has used the microarray images that were obtained from the Stanford Medical Database (SMD). The ability of the proposed system to produce very high success rate has been confirmed by simulation results. Papachristoudis et al. [24] have offered SoFoCles, an interactive tool that has made semantic feature filtering a possibility in microarray classification problems by the utilization of external, unambiguous knowledge acquired from the Gene Ontology. By improving an initially created feature set with the help of legacy methods, genes that are associated with the same biological path during the microarray experiment are extracted by the utilization of the idea of semantic similarity. As one of its many functions, SoFoCles offers a huge repository of semantic similarity methods for deriving feature sets and marker genes. Discussion about the structure and functionality of the tool, and its ability in improving the classification accuracy has been given in detail. By means of experimental evaluation, the improved classification accuracy of the SoFoCles has been demonstrated utilizing different semantic similarity computation methods in two real datasets
Debnath et al. [25] have proposed an evolutionary method that is capable of selecting a subset of potentially informative genes that can be used in support vector machine (SVM) classifiers. The proposed evolutionary method estimates the fitness function utilizing SVM and a specified subset of gene features, and new subsets of features were chosen founded on the frequency of occurrence of the features in the evolutionary approach and amount of generalization error in SVMs. Hence, theoretically, the selected genes reflect the generalization performance of SVM classifiers to a certain extent. Comparison with several existing methods has confirmed that better classification accuracy can be achieved by the proposed method with fewer numbers of selected genes. From the review, it can be seen that most of the recent works have performed the classification using selective gene expression data. The selected gene expression sub-dataset has been optimized and classified using traditional classifiers. Though the optimization is effective the ultimate objective is not attained because the effectiveness of classification is inadequate. Hence, the enhancement of classifier becomes an essential pre-requisite for effective classification of microarray gene expression data.
In this paper, we propose an effective classification technique that uses an enhanced supervised classifier. It is well known that microarray gene expression datasets are characterized by high dimension and small sample size. The dimension of the gene expression dataset is reduced using PPCA. With the aid of the dimensionality reduced gene expression dataset, the ANN, which is selected as supervised classifier in our work, is enhanced using EP technique. The enhanced classifier is utilized for classification and so it is trained using BP algorithm. The well-trained classifier is then subjected to the classification of microarray gene expression dataset. The rest of the paper is organized as follows. Section 3 details the proposed classification technique with required mathematical formulations and illustrations. Section 4 discusses about the implementation results and Section 5 concludes the paper.
3. CLASSIFICATION TECHNIQUE FOR MICROARRAY GENE EXPRESSION DATA
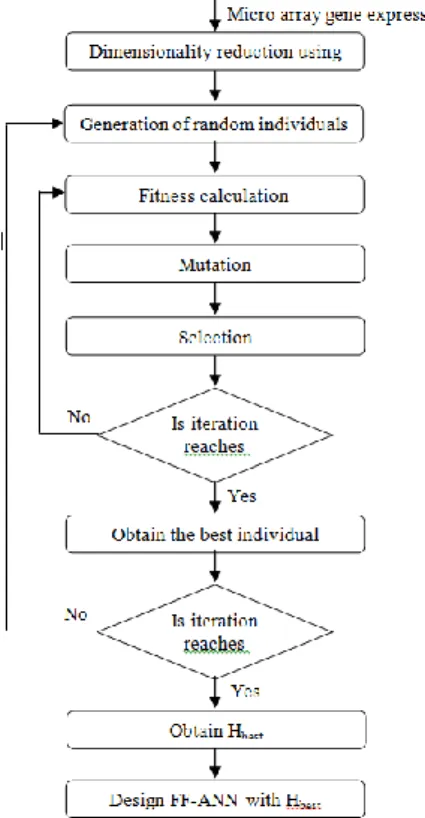
Here, an efficient technique to classify microarray gene expression data is proposed. The proposed technique is comprised of three fundamental processes, namely, dimensionality reduction, development of supervised classifier and gene classification. The development of enhanced supervised classifier is illustrated in the Figure 1 and the training process is depicted in Figure 2.
The dimensionality reduction involves the process of reducing the dimension of the microarray gene expression data using PPCA. In the second process, a supervised classifier is developed using feed forward ANN, which is enhanced using EP technique. In the gene classification, the enhanced classifier is trained using the gene expression data and then the testing process is conducted. So, given a microarray gene expression data, the classifier effectively classifies the data by representing the class to which the data belongs.
Figure 1. Enhancement of Feed Forward ANN using EP technique
Figure 2. Training process of enhanced supervised classifier using BP algorithm
3.1. Dimensionality Reduction Using PPCA
Let, the microarray gene expression data be
M
jk;
0
j
N
s
1
,
0
k
N
g
1
, where, sN
represents the number of samples andN
grepresents the number of genes. The dimension of gene data is higher and so it is subjected to dimensionality reduction. In dimensionality reduction, the high dimensional gene dataM
jk is converted to a low dimensional gene data. To reduce the dimensionality, we use PPCA, which is a PCA with the presence of probabilistic model for the data. The PPCA algorithm composed by Tipping and Bishop [26] is capable of calculating a low dimensional representation utilizing a rightly formed probability distribution of the higher dimensional data.The instinctive attraction of the probabilistic representation is because of the fact that the definition of the probabilistic measure allows comparison with other probabilistic techniques, at the same time making statistical testing easier and permitting the utilization of Bayesian methods. Dimensionality reduction can be achieved by making use of PPCA as a generic Gaussian density model. Dimensionality reduction facilitates efficient computation of the maximum-likelihood estimates for the parameters connected with the covariance matrix from the data principal components. By performing the dimensionality reduction using PPCA, microarray gene expression data of dimension
N
s
N
g is reduced toN
s'
N
g' . The dimensionality reduced matrix is given asM
^
. Other than dimensionality reduction, the PPCA finds more practical advantages such as finding missing data, classification and novelty detection [26].
3.2. Enhancement of Feed Forward ANNs
Here, an enhanced supervised classifier using multi-layer feed forward ANNs is developed. The enhancement of the neural network is accomplished by optimizing the dimension of the hidden layer using EP technique. EP is a stochastic optimization strategy primarily formulated by Lawrence J. Fogel in 1960, which is similar to genetic algorithm, but it stresses on the behavioral linkage between parents and their offspring instead of attempting to imitate specific genetic operators as seen in nature. The EP technique
is comprised of (1) population initialization, (2) fitness calculation (3) selection and (4) mutation. The EP technique used to enhance the classifier is discussed below.
Step1: A population set
X
a;0
a
N
p
1
is initialized, where,X
a is an arbitrary integer generated within the interval(
0
,
N
H
1
)
andN
p is the population size.Step 2:
N
p neural networks, each with an input layer, a hidden layer and an output layer are designed. In everya
th neural network,N
s' (dimensionality reduced) input neurons and a bias neuron,X
a hidden neurons and a bias neuron and an output neuron are present.Step 3: The designed NN is weighted and biased randomly. The developed NN is shown in Figure 3.
Figure 3. The ANN developed with hidden neurons that are recommended by EP individuals
Step 4: The basis function and activation function are selected for the designed NN as follows
1 0
^
'
g
N
k jk jk
j w M
y , 0 jNs' 1 (1)
y
e y
g
1 1 )
( (2)
y y
g( ) (3)
Equation 1 is the basis function (given only for input layer), Equation 2 and Equation. 3 represents the sigmoid and identity activation function, which is selected for hidden layer and output layer respectively. In Equation 1
M
^
is the dimensionality reduced microarray gene data,
w
jk is the weight of the neurons and
is the bias. The basis function given in Equation 1 is commonly used in all the remaining layers (hidden and output layer, but with the number of hidden and output neurons, respectively). TheM
^
is given to the input layer of the
N
p ANNs and the output from the all those ANNs are determined.Step 5: The learning error is determined for all the
N
p networks as follows
1
0 '
'
1 Ns b
ab s
a D Y
N
E (4)
Step 6: Fitness is determined for every individual, which is present in the population pool, using the fitness function as follows
1 0 1 p N a a a a E E F (5)Step 7: The individuals which have maximum fitness are selected for the evolutionary process, mutation. So,
N
p2
individuals are selected from the population pool and subjected to mutation.Step 8: In mutation, new
N
p2
individualsX
new are generated to fill the population pool and the generation is given as follows otherwise ; 2 ; 2 ; 2 1 d P d d P d d new M N M if M N M if M X (6)
In Equation 6, the mutation set
M
d is determined asM
d
M
in-
N
lbest, where,}
,
,
3
,
2
,
1
{
inM
;
is the median ofN
lbestandN
lbest is a set of best individuals that has maximum fitness1
d
M
is determined asM
d
M
d' , where,M
d' is a set of random integers that are generated within the interval(
,
N
H
1
)
. The setM
d' is generated in such a way that it satisfies the following conditions(i)
d P d N M
M' 2 (7)
(ii) Md' Nlbest (8)
In Equation 6,
2
d
M
is the set of random elements which are taken from the setM
d such that.2
2 P
d N
M and Md2 Min.
Step 9: The newly obtained individuals
X
new occupy the population pool and so the pool retains its size pN
. Then, NNs are developed as per the individuals present in the new population pool and the process is iteratively repeated until it reaches the maximum number of iteration1
max
I
. Once, the process is completed, the best individual is obtained from the population pool based on the fitness value.Step 10: The obtained best individual is stored and the process is again repeated from step1 for
2
max
I
iterations. In each iteration, a best individual is obtained and so2
max
I
best individuals (the best individual represents numberof hidden units, which is termed asH
best) are obtained after completion of all the iterations.Among the
2
max
I
iterations, the best individual which has maximum frequency i.e. the individual, which is selected as best for the most number of times is selected as the final best individual. Thus obtainedbest individual is selected as the dimension of the hidden layer and so the NN is designed. Hence, an enhanced NN is developed by optimizing the dimension of the hidden layer using the EP technique. 3.3. Classification of Microarray Gene Expression using the Enhanced Classifier
In the classification of microarray gene expression data, two phases of operation are performed that include training phase and testing phase. In the training phase, the enhanced supervised classifier is trained using the BP algorithm. The dimensionality reduced microarray gene expression dataset is utilized to train the NN.
3.3.1. Training Phase: Minimization of Error by BP algorithm
The training phase of the NN using BP algorithm is discussed below.
1. The weights are randomly generated within the interval
0
,
1
and assigned to the hidden layer as well as output layer. For input layer, the weights maintain a constant value of unity.2. The training gene data sequence is given to the NN so that the BP error is determined using the Equation 4. The basis function and transfer function are similar to that used in the optimization (given in Equation 1, Equation 2 and Equation 3.
3. When the BP error is calculated, the weights of all the neurons are adjusted as follows
jk jk
jk
w
w
w
(9)In Equation 3,
w
jkis the change in weight which can be determined as
w
jk
.
y
jk.
E
, where,E
is the BP error and
is the learning rate, usually it ranges from 0.2 to 0.5.4. Once the weights are adjusted as per the Equation 9, the process is repeated from step 2 until the BP error gets minimized to a least value. Practically, the criterion to be satisfied is
E
0
.
1
.The BP algorithm is terminated when the error gets minimized to a minimum value, which construes that the designed ANN is well trained for its further testing phase.
3.3.2. Testing Phase: Classification of Given Microarray Gene Sequence
In the training phase, the ANN learns well about the training gene sequence and the class under which it is present. The well-trained ANN can classify the microarray gene sequence in an effective manner. Given a test sequence, the dimensionality reduction is performed using the PPCA. The dimensionality reduced gene sequence is given as input to the well-trained enhanced supervised classifier. The classifier effectively classifies the gene sequence by determining the class to which it belongs. The supervised classifier is designed with the intention of classifying the microarray gene sequence and hereby, it is accomplished well.
4. RESULTS AND DISCUSSION
The proposed classification technique is implemented in the MATLAB platform (version 7.8) and it is evaluated using the microarray gene expression data of human acute leukemias. The standard leukemia dataset for training and testing is obtained from [27]. The training leukemia dataset is of dimension
7192
g
N
andN
s
38
. This high dimensional training dataset is subjected to dimensionality reduction using PPCA and so a dataset of dimensionN
g
30
andN
s
38
is obtained. In developing the enhanced supervised classifier, the dimensionality reduced microarray gene dataset is used to find the optimal dimension of the hidden layer. The enhancement of the ANN is performed with the parametric values given in the Table 1. In each iteration, the error gets minimized and the optimal value for the dimension of the hidden layer is found. While enhancing ANN, the error, which is determined for different iterations and the calculated fitness, while enhancing ANN, are depicted in the Figure 4. The training of enhanced ANN classifier is implemented using the Neural Network Toolbox in MATLAB. The error versus epochs, which is obtained in the training of ANN using BP, is illustrated in Figure 5.Table 1. EP parameters used in the enhancement of ANN
S.No EP Parameters Values
1 Np 10
2 NH 20
3 D 0.25 (for ALL) 0.75 (for AML)
4 Imax1 50
5 Imax2 100
(a) (b)
Figure 4. EP performance in enhancement of ANN classifier: (a) Error versus Number of iterations and (b) Fitness versus number of iterations.
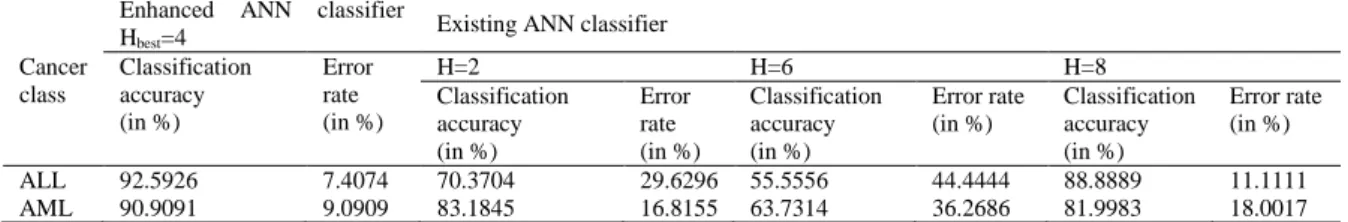
Once the enhanced supervised classifier is developed and trained well, the classification is performed by providing the microarray gene expression test dataset. The classifier detects the type of cancer from the dataset with a good accuracy. The significance of the enhanced ANN classifier is demonstrated by comparing its classification performance with that of the existing ANN classifier. The comparison results are provided in the Table 2. Moreover, the performance of the classifier is also compared with the existing SVM classifier and the results are given in the Table 3. The comparison results given in the Table demonstrate that the classification accuracy of the enhanced classifier with optimized hidden layer dimension is good, and 90% more than that of the ANN classifier with arbitrary hidden layer dimension. From Table 2 and Table 3 results, it can be seen that the proposed technique has good classification accuracy and less error rate when compared with the SVM classifier.The results show that the enhanced supervised classifier performs well in classifying the microarray gene expression dataset.
Table 2. Comparison between enhanced ANN classifier and existing ANN classifier
Cancer class
Enhanced ANN classifier
Hbest=4 Existing ANN classifier
Classification accuracy (in %)
Error rate (in %)
H=2 H=6 H=8
Classification accuracy (in %)
Error rate (in %)
Classification accuracy (in %)
Error rate (in %)
Classification accuracy (in %)
Error rate (in %)
ALL 92.5926 7.4074 70.3704 29.6296 55.5556 44.4444 88.8889 11.1111
AML 90.9091 9.0909 83.1845 16.8155 63.7314 36.2686 81.9983 18.0017
Table 3. Comparison between enhanced ANN classifier and existing SVM classifier
Cancer class Enhanced ANN classifier Existing SVM classifier
Classification accuracy (in %) Error rate (in %) Classification accuracy (in %) Error rate (in %)
ALL 92.5926 7.4074 70.3704 29.6296
AML 90.9091 9.0909 72.7273 27.2727
5. CONCLUSION
In this paper, we have proposed an efficient classification technique with an enhanced supervised classifier using ANN. The proposed technique has been demonstrated by performing the classification of AML and ALL cancers. The implementation results have shown that the classification of the cancer is performed with good classification rate. The better classification performance is achieved mainly because of the enhancement of the ANN. The enhancement is performed with the intention of finding the dimension of the hidden layer such that the error is minimized. Using the EP, an optimal dimension for hidden layer has been identified. The training of ANN using BP has reduced the BP error to a considerable amount. The comparison results for existing ANN classifier and SVM classifier has demonstrated that the classification accuracy is more in the enhanced ANN classifier rather than the other classifier. Hence, it can be concluded that the proposed classification technique is more effective in classifying the microarray gene expression data for cancers with remarkable classification accuracy.
REFERENCES
[1]. Vaidyanathan and Byung-Jun Yoon, "The role of signal processing concepts in genomics and proteomics", Journal of the Franklin Institute, Vol.341, No.2, pp.111-135, March 2004.
[2]. Anibal Rodriguez Fuentes, Juan V. Lorenzo Ginori and Ricardo Grau Abalo, “A New Predictor of Coding Regions in Genomic Sequences using a Combination of Different Approaches”, International Journal of Biological and Life Sciences, Vol. 3, No.2, pp.106-110, 2007.
[3]. Ying Xu, Victor Olman and Dong Xu, "Minimum Spanning Trees for Gene Expression Data Clustering", Genome Informatics, Vol. 12, pp.24–33, 2001.
[4]. Anandhavalli Gauthaman, "Analysis of DNA Microarray Data using Association Rules: A Selective Study", World Academy of Science, Engineering and Technology, Vol.42, pp.12-16, 2008.
[5]. Chintanu K. Sarmah, Sandhya Samarasinghe, Don Kulasiri and Daniel Catchpoole, "A Simple Affymetrix Ratio-transformation Method Yields Comparable Expression Level Quantifications with CDNA Data", World Academy of Science, Engineering and Technology, Vol. 61, pp.78-83, 2010.
[6]. Khlopova, Glazko and Glazko, “Differentiation of Gene Expression Profiles Data for Liver and Kidney of Pigs”,
World Academy of Science, Engineering and Technology, Vol. 55, pp.267-270, 2009.
[7]. Ahmad M. Sarhan, "Cancer Classification Based on Microarray Gene Expression Data Using dct and Ann",
Journal of Theoretical and Applied Information Technology, Vol.6, No.2, pp.207-216, 2009.
[8]. Huilin Xiong, Ya Zhang and Xue-Wen Chen, "Data-Dependent Kernel Machines for Microarray Data Classification", IEEE/ACM Transactions on Computational Biology and Bioinformatics (TCBB), Vol.4, No.4, pp.583-595, October 2007.
[9]. Javier Herrero, Juan M. Vaquerizas, Fatima Al-Shahrour, Lucıa Conde, Alvaro Mateos, Javier Santoyo Ramon Dıaz-Uriarte and Joaquın Dopazo, "New Challenges in Gene Expression Data Analysis and the Extended GEPAS",
Nucleic Acids Research, Vol. 32, pp.485–491, 2004.
[10]. Sveta Kabanova, Petra Kleinbongard, Jens Volkmer, Birgit Andrée, Malte Kelm and Thomas W. Jax, "Gene Expression Analysis of Human Red Blood Cells", International Journal of Medical Sciences, Vol.6, No.4, pp.156-159, 2009.
[11]. Sungwoo Kwon and Chonghun Han, "Hybrid Clustering Method for DNA Microarray Data Analysis", Genome Informatics, Vol.13, pp, 258-259, 2002.
[12]. Sungwoo Kwon, young-Hwan Chu, Heui-Seok yi and Chonghun Han, "DNA Microarray Data Analysis for Cancer Classification Based on Stepwise Discriminant Analysis and Bayesian Decision Theory", Genome Informatics, Vol.12, pp.252-254, 2001.
[13]. Supoj Hengpraprohm and Prabhas Chongstitvatana, "Feature Selection By Weighted-Snr for Cancer Microarray Data Classification", International Journal of Innovative Computing, Information and Control, Vol.4, No.12 (A), pp.4627-4635, December 2009.
[14]. Anastassiou, "Genomic Signal Processing," IEEE Signal Processing Magazine, Vol. 18, pp. 8-20, 2001.
[15]. Ho Sun Shon, Sunshin Kim, Chung Sei Rhee and Keum Ho Ryu, "Clustering Approach Using Mcl Algorithm for Analyzing Microarray Data", International Journal of Bioelectromagnetism, Vol.9, No.2, Pp.65-66, 2007.
[16]. Hieu Trung Huynh, Jung-Ja Kim and Yonggwan Won, "Classification Study on DNA Microarray with Feedforward Neural Network Trained by Singular Value Decomposition", International Journal of Bio-Science and bio-Technology, Vol.1, no.1, pp.17-24, December 2009.
[17]. Changjing Shang and Qiang Shen, "Aiding Classification of Gene Expression Data with Feature Selection: A Comparative Study", International Journal of computational Intelligence Research, Vol.1, No.1, pp.68-76, 2005 [18]. Chen-Hsin Chen, Henry Horng-Shing Lu, Chen-Tuo Liao, Chun-houh Chen, Ueng-Cheng Yang and Yun-Shien
Lee, "Gene Expression Analysis Refining System (GEARS) via Statistical Approach: A Preliminary Report",
Genome Informatics, Vol.14, pp.316-317, 2003.
[19]. Zhenqiu Liu, Dechang Chen and Halima Bensmail, "Gene Expression Data Classification with Kernel Principal Component Analysis", J Biomed Biotechnol, Vol.2005, No.2, pp. 155–159, 2005.
[20]. Roberto Ruiz, Jose C. Riquelme and Jesus S. Aguilar-Ruiz, "Incremental Wrapper-Based Gene Selection from Microarray Data for Cancer Classification," Pattern Recognition, Vol. 39, No. 12, pp. 2383-2392, 2006.
[21]. Yanxiong Peng, Wenyuan Li and Ying Liu, "A Hybrid Approach for Biomarker Discovery from Microarray Gene Expression Data for Cancer Classification”, Cancer Inform., Vol.2, pp.301-311, February 2007.
[22]. Minca Mramor, Gregor Leban, Janez Demar and Bla Zupan, "Visualization-Based Cancer Microarray Data Classification Analysis", Bioinformatics, Vol. 23, No.16, pp.2147-2154, June 2007.
[23]. Hau-San Wong and Hong-Qiang Wang, "Constructing the Gene Regulation-Level Representation of Microarray Data for Cancer Classification", Journal of Biomedical Informatics, Vol.41, No.1, pp.95-105, February 2008. [24]. Georgios Papachristoudis, Sotiris Diplaris and Pericles A. Mitkas, "SoFoCles: Feature filtering for microarray
classification based on Gene Ontology", Journal of Biomedical Informatics, Vol.43, No.1, pp.1-14, February 2010. [25]. Rameswar Debnath and Takio Kurita, "An evolutionary approach for gene selection and classification of
microarray data based on SVM error-bound theories", BioSystems, Vol.100, No.1, pp.39-46, April 2010.
[26]. M. E. Tipping and C. M. Bishop, “Probabilistic Principal Component Analysis”, Journal of the Royal Statistical Society, Series B, Vol. 21, No. 3, p.p. 611–622, 1999.