SOCIAL DRIVERS OF HEALTH AND LOCAL PUBLIC HEALTH AGENCIES OF NORTH CAROLINA
Laurie L. B. Stradley
A dissertation submitted to the faculty at the University of North Carolina at Chapel Hill in partial fulfillment of the requirements for the degree of Doctor of Public Health in the Department of Health Policy
and Management in the Gillings School of Global Public Health.
Chapel Hill 2018
Approved by: Pam Silberman Cleo A. Samuel B. Alexander White
ABSTRACT
Laurie L. B. Stradley: Social Drivers of Health and Local Public Health Agencies of North Carolina
(Under the direction of Pam Silberman)
Social determinants of health (SDH) have far reaching impact on population health outcomes. SDH include income, education, transportation, housing, racism and other social factors. Research shows that they account for between 28 and 50% of health outcomes. North Carolina’s local public health agencies are tasked with improving the public health through three core functions: assessment, policy development and assurance. In order to determine the major health concerns of their populations, all counties complete a community health needs assessment (CHNA) and identify local health priorities. At the time of this research, only 17 of 100 counties prioritized a SDH.
The purpose of this dissertation was three-fold: identify facilitators of and barriers to prioritizing and engaging in work to improve SDH by local public health agencies; identify common characteristics, circumstances, policies and practices associated with local public health agencies that are prioritizing and engaging in work to improve SDH; and a practical guide to improving prioritizing and engaging in SDH for local public health agencies.
Survey results indicated interest in SDH work by local health agencies. Local health directors rated the role of public health highest for education, environment, social connectivity and racism. The lowest rated sectors were income, housing and transportation. The primary concern around implementation was access to resources. There was no single “type” of North Carolina public health agency more or less likely to prioritize SDH. No matter the economic status or population density, different communities are identifying with the roles local public health agencies can or should be playing in SDH.
Interview results further illuminated opportunities and barriers to work in SDH. While access to resources remained a central theme, most informants referenced community connectivity and engagement as a major support for SDH work. Informants were committed to the work, but recognized that formal processes, funding and structure would improve their ability to have an impact.
ACKNOWLEDGEMENTS
TABLE OF CONTENTS
LIST OF TABLES ... xii
LIST OF FIGURES ... xiii
LIST OF ABBREVIATIONS ... xv
CHAPTER 1: INTRODUCTION ... 1
Background ... 1
What Impacts Health? ... 3
What are the Social Drivers and Determinants of Health? ... 4
How are the social determinants and drivers of health weighted against other determinants of health? ... 8
Social Determinants of Health and Health Equity ... 16
Purpose ... 17
CHAPTER 2: LITERATURE REVIEW ... 18
Introduction ... 18
Methodology ... 19
Income, Wealth, and Economic Hardship ... 20
Education ... 25
Social Connectedness ... 31
Racism ... 33
Conclusions ... 34
Limitations ... 35
CHAPTER 3: METHODOLOGY ... 36
Study Overview ... 36
Background ... 37
Data Collection ... 41
Delimitations ... 43
Data Management and Analysis ... 43
Data management. ... 43
Data analysis. ... 44
CHAPTER 4: QUANTITATIVE RESULTS ... 47
Responses by Urban/Rural and Economic Tiers ... 54
Urban/Rural Analysis ... 55
Economic Tier Analysis ... 59
Counties Prioritizing SDH vs. Counties Not Prioritizing SDH ... 63
Limitations ... 63
Conclusions ... 63
Four Counties ... 66
County A... 67
County B. ... 69
County C. ... 71
County D... 73
General Findings and Common Themes ... 75
Public health agencies as conveners or organizers. ... 76
Available resources... 77
Community engagement in and understanding of SDH. ... 78
Interagency and multisector collaboration ... 79
Unique commentary. ... 79
Limitations ... 81
Conclusions ... 81
CHAPTER 6: DISCUSSION ... 83
Public Health 3.0 ... 83
Role of Public Health in its Community ... 85
Engagement of Public Health across Sectors ... 88
Public Health Accreditation and Public Health 3.0 ... 90
Availability of Timely, Reliable, Granular-level, Actionable Data ... 92
Racism, Race, and Public Health ... 96
CHAPTER 7: PLAN FOR CHANGE ... 99
Broad based Recommendations for Stakeholders ... 99
Recommendation #1: Increase knowledge about the needs and skills of the public health workforce. ... 99
Recommendation #2: Improve skills set of the public health workforce. ... 100
Recommendation #3: Increase funding for local public health agencies specifically to engage in work around SDH. ... 101
Recommendation #4: Codify requirements for local public health agencies to engage in SDH. ... 103
Recommendation #5: Educate and engage stakeholders in understanding and valuing SDH while listening and learning from other sectors for synergistic opportunities. ... 104
Practical Guide for Local Public Health Agencies ... 106
Assure a Competent Workforce ... 108
Step 1. ... 108
Step 2. ... 109
Monitor and Evaluate ... 109
Step 1. ... 109
Step 2. ... 110
Step 3. ... 110
Educate and Empower ... 110
Step 3. ... 111
Develop Policy and Mobilize Partnerships ... 111
Step 1. ... 111
Step 2. ... 112
Conclusion ... 114
APPENDIX A: LITERATURE REVIEW & RESEARCH PROCESS ... 115
APPENDIX B: PRIORITIES BY COUNTY ... 116
APPENDIX C: SURVEY TO LOCAL HEALTH DIRECTORS ... 120
APPENDIX D: PUBLIC HEALTH KEY INFORMANT INTERVIEW GUIDE ... 126
APPENDIX E: NON-PUBLIC HEALTH KEY INFORMANT INTERVIEW GUIDE ... 131
APPENDIX F: CODEBOOK ... 134
Barriers ... 134
Understanding of social determinants ... 136
Facilitators ... 136
Public Health Roles ... 137
LIST OF TABLES
Table 1. Type of agency responding to the survey (N = 56). ... 47 Table 2. Potential supports that would encourage participation in work of SDH (% stating that the identified support would increase likelihood of
LIST OF FIGURES
Figure 1. Aggregate health and social spending in 2007 among OECD
member nations (Bradley & Taylor, 2013). ... 2
Figure 2. Factors driving health outcomes created by the Commission on Social Determinants of Health of the World Health Organization (World Health Organization Commission on Social Determinants of Health, 2008). ... 5
Figure 3. Multiple perspectives on the weight of factors affecting health outcomes (Booske et al., 2010). ... 10
Figure 4. Comparison of mortality by income(Pappas et al., 1993). ... 22
Figure 5. The effect of education across age by cohort (S. Lynch, 2003). ... 26
Figure 6. Life expectancy per average years of education for 138 countries (Cutler & Lleras-Muney, 2006). ... 26
Figure 7. Earnings and unemployment rates by educational attainment. ... 28
Figure 8. Priority themes across North Carolina community health assessments. ... 40
Figure 9. Partnership by sector (N = 56). ... 48
Figure 10. Average rating of the role of public health in addressing specific SDH (N = 56). ... 50
Figure 11. Perceived strength of barriers to work in SDH (N = 45). ... 52
Figure 12. Perceived strength of facilitators for working in SDH (N = 56). ... 53
Figure 13. Average rating of the role of public health in addressing specific SDH by county population density (nurban = 23, nrural = 22). ... 56
Figure 14. Perceived strength of barriers to work in SDH by population density (nurban = 23, nrural = 22). ... 58
Figure 15. Perceived strength of facilitators for work in SDH by population density (nurban = 23, nrural = 22). ... 59
LIST OF ABBREVIATIONS
ANOVA One-Way Analysis of Variance APHA American Public Health Association
ASTHO Association of State and Territorial Health Officials CDC Centers for Disease Control and Prevention
CHNA Community Health Needs Assessment CHIP Community Health Improvement Plans
NACCHO National Association of County & City Health Officials NCALHD North Carolina Association of Local Health Directors NC DHHS North Carolina Department of Health and Human Services NCPHH North Carolina Department of Public Health
NCGA North Carolina General Assembly
CHAPTER 1: INTRODUCTION Background
In 2013, the Institute of Medicine put a spotlight on what is sometimes called the “American Paradox.” The United States spends more on medical care and has poorer health outcomes than any other developed nation in the world. The United States lags behind in a variety of health outcomes, including birth outcomes, injuries and homicides, adolescent pregnancy and sexually transmitted infections, HIV and AIDS, drug-related mortality, obesity, diabetes, heart disease, chronic lung disease, and disability. These outcomes combine to provide Americans with shorter lifespans than their peers in other developed nations and are also so persistent that they appear for all ages (through 75 years), across diseases, races, behavioral risk factors, and more (Woolf & Aron, 2013). While some call this a paradox, others see a clear reason. While the United States outspends every other developed nation in health care expenses, they lag far behind in investments in social and environmental factors. According to Bradley and Taylor (2013), “Inadequate attention to and investment in services that address the broader determinants of health is the unnamed culprit behind why the United States spends so much on health care but continues to lag behind in health outcomes” (p. 2).
Database (SOCX)," 2001). The United States may simply be spending more money in a less effective manner, as the bulk of U.S. health spending is on medical costs. Other nations spend the bulk of their dollars in social areas. In fact, the United States nearly doubles the next highest medical spender, Netherlands, yet ranks only 37th out of 119 World Health Organization member nations in terms of health system performance (Murray & Frenk, 2000). As shown in Figure 1, the United States falls into the middle of member nations of the OECD in terms of overall spending and to the bottom of the pack in terms of spending on social welfare factors affecting health outcomes (Bradley & Taylor, 2013).
Figure 1. Aggregate health and social spending in 2007 among OECD member nations (Bradley & Taylor, 2013).
For example, overutilization or unnecessary tests and treatments may account for nearly 20% of U.S. medical care spending. However, a panel from the Institute of Medicine did not find ineffective medical spending to be a root cause of the American health paradox. Instead, they noted that issues of access to public health services and medical care, along with non-medical determinants, were more strongly associated with disparate health outcomes (Woolf & Aron, 2013).
What Impacts Health?
Over the past century, our understanding of and focus on issues impacting health have changed, moving from an emphasis on sanitation, to medical care, and then health behaviors (Booske, Athens, Kindig, Park, & Remington, 2010). During the early 1900s, much of the U.S. efforts to improve health involved better sewage management, access to clean water, and garbage removal (Greenberg, 2012). The development and use of vaccines from the mid-1800s onward also became a critical part of limiting infectious disease. In the later 20th and early 21st centuries, public health increasingly focused on chronic disease prevention, ushering in another shift in public health work.
In the era following World War II, western countries began to establish medical care options for low wealth citizens, hoping to improve the poor mortality rates associated with a lower income status. The National Health Service, providing health care for all United Kingdom citizens, was established in 1948. The Canadian system of universal health insurance was
Human Services in 1981 showed major advances in access to care but conceded that the
“attending conditions of poverty,” including poor housing, access to good nutrition, and unsafe neighborhoods might make it “impossible” to close health disparities between high and low income populations (Davis, Gold, & Makuc, 1981). The understanding that socioeconomic factors contribute to health outcomes was acknowledged, but there was little effort by public health leaders to introduce policy, programs, and practices to improve health by impacting SDH. What are the Social Drivers and Determinants of Health?
Social and environmental factors affecting health are commonly known as the social determinants of health (SDH). These factors typically include issues such as education, income, access to safe and affordable housing, access to healthy food and safe places to play, and an environment with clean air and water. The World Health Organization defines the SDH as:
…the conditions in which people are born, grow, work, live, and age, and the wider set of forces and systems shaping the conditions of daily life. These forces and systems include economic policies and systems, development agendas, social norms, social policies and political systems. ("Social Determinants of Health," 2016)
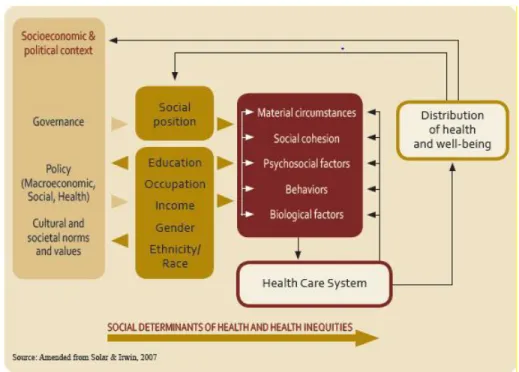
The Commission on Social Determinants of the World Health Organization developed a conceptual framework to determine how several factors overlap and interact to drive health outcomes (Figure 2). The contributors of health identified in this framework are broader than the typically defined determinants of health. For example, race and ethnicity are identified as factors of social position and are also tied to socioeconomic and political contexts and to factors directly related to the health care system. Each of these factors interact within the system and the
cohesion—all factor into unhealthy outcomes and all serve as points for intervention. This framework leads to the three guiding principles of the Commission’s aim to improve health outcomes: (1) improve the conditions of daily life; (2) tackle the inequitable distribution of wealth, power and resources; and (3) measure, evaluate, learn, and ensure a global health workforce that understands and educates the public about the impact of social drivers of health (World Health Organization Commission on Social Determinants of Health, 2008). These principles are provided to help public health practitioners and policy makers identify points for intervention and change.
Figure 2. Factors driving health outcomes created by the Commission on Social Determinants of Health of the World Health Organization (World Health Organization Commission on Social Determinants of Health, 2008).
human-made environment, and the social and community context (Bambra et al., 2009; Booske et al., 2010; USDHHS, 2014). For the purpose of this project, social drivers of health will include the typical definitions and be expanded to include racism.
Income, wealth, and economic stability are directly associated with lifetime health quality and lifespan (N. E. Adler & Ostrove, 1999; Lantz et al., 1998). These three factors are distinct, but connected constructs that impact the resources an individual can access and will be explored further in the literature review. Those with greater economic stability have greater access to health care, safer housing, healthy food, and other resources that promote health and protect against illness and injury. Conversely, low income, low wealth, and economic instability are directly associated with poorer lifetime health and reduced life expectancy. Research initially focused on poverty status, showing a direct relationship between poverty and health, rather than the spectrum of income and associated health outcomes. With further study, it has become clearer that incrementally higher income is associated with incrementally better health. This is known as the “social gradient.” In other words, better income is associated with having better health, without needing extreme poverty or extreme wealth to see the impact (Adler et al., 1994).
This means that when all of these intermediary factors of better jobs, etc. are accounted for, the linkage between total education and health remains.
The environments in which we live also impact long term health (N. E. Adler & Ostrove, 1999; Wright & Kloos, 2007). Access to healthy food, housing quality, safe neighborhoods, and environmental conditions are all separately tied to positive health outcomes. Crime and violence in an individual’s neighborhood may reduce the likelihood that individuals are physically active (Molnar, Gortmaker, Bull, & Buka, 2004). Individuals living in food deserts with reduced access to healthy foods are more likely to suffer from diseases of poor nutrition (Walker, Keane, & Burke, 2010). Quality of housing is associated with rates of infectious disease, chronic disease, injury, nutrition, and mental health (Krieger & Higgins, 2002). For example, poor quality housing with mold and insects is linked to higher incidence of chronic asthma in children and adults. In addition to the quality of housing is the location of that housing in relation to environmental risks. Poor air quality, poor drinking water, proximity to landfills, proximity to highways, and other environmental factors are associated with higher risk of chronic disease and mental health concerns (Lee, 2002).
Racism is defined by those working actively to end it as prejudice plus power (Jones, Jones, Perry, Barclay, & Jones, 2009). Racism exists on several levels, including personal, institutional, and systemic. One potential driver of continued racism in this country is
unconscious or implicit bias. Unconscious bias is defined as a predisposition or prejudice about a person, idea, or thing that is unknown or unrecognized by the individual, as opposed to a
conscious or explicit bias, which a person can identify and control. Bias has been introduced into American culture, causing unintentional differential and typically negative impacts on
individuals and communities of color. This unconscious bias affects everything from hiring practices (Bertrand & Mullainathan, 2004), to medical decision making (Green et al., 2007), and the criminal justice system (Rachlinski, Johnson, Wistrich, & Guthrie, 2009). People of color are less likely to receive an interview call back, more likely to receive below standard medical care, and more likely to be incarcerated than white Americans. Institutional and systemic racism can also be found throughout American history. For example, historically black neighborhoods are often the site of waste management, landfills, and other environmental hazards that are not placed in white neighborhoods (Bullard, 2000). While not currently identified as a SDH, or included in weighting of drivers of health outcomes, this analysis will include racism as an under-recognized determinant of health.
determinant versus the other? With limited resources, should we focus on one more than
another? While research has shown greater impact of social and environmental factors on health outcomes, effective access to and quality of medical care continues to dominate discussions around determinants of health and garner the majority of resources.
There have been many attempts to find the keystone determinant, which could fix most of our health problems. For example, researchers examined whether or not the difference between health outcomes for low and high wealth individuals could be explained by riskier health
behaviors, such as tobacco use and poor nutrition, in low wealth communities. This would mean that poverty is not the issue, rather healthy behaviors are. However, differences in behavioral risk factors could not fully account for the differences between low and high wealth individuals, pointing toward additional, deeper factors in determining health outcomes (Lantz et al., 1998).
environmental factors (such as air pollution and exposures to other toxins) encompass those issues referred to previously as SDH. Health behaviors include such issues as tobacco use, nutrition, and physical activity. Clinical care refers to treatment by a clinician in a medical setting. The authors included the built environment, such as mold in a housing development or public transportation, in environmental factors.
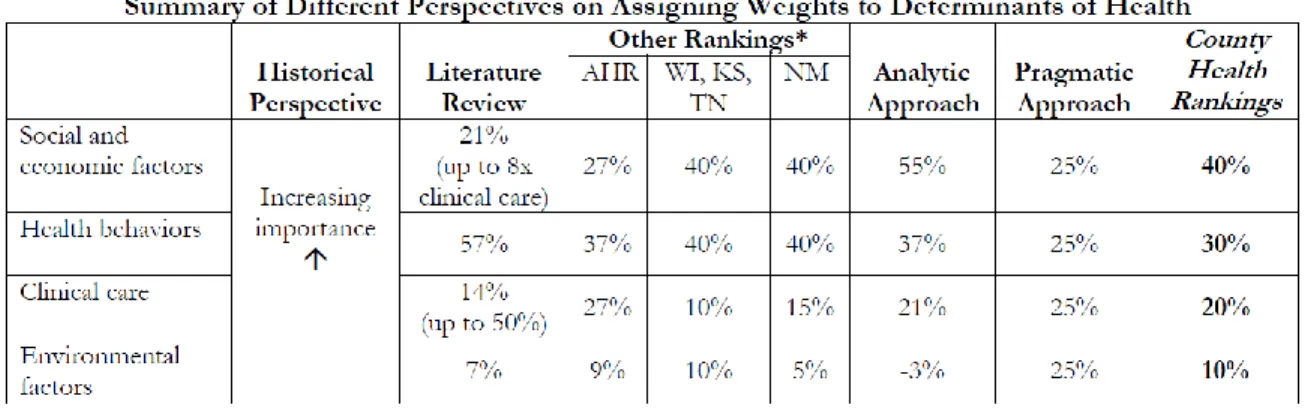
After dividing the four categories, the authors assessed different methods for weighting them (Figure 3).
Figure 3. Multiple perspectives on the weight of factors affecting health outcomes (Booske et al., 2010).
equal ability to change health behaviors for the better. For example, an individual who knows they should eat more fresh fruits and lean meats may not have a grocery store close enough to access these foods. A child who wants to be more active may not live in a neighborhood that supports them. Thus, the primary driver of health is now in the realm of social and economics.
The second method examined by the researchers was based on a review of the literature. Again, as no consensus about the weight of different determinants exists, the writers attempted to incorporate multiple published proposals. Some articles were very specific in associating
percentages with determinants (McGinnis et al., 2002), while others within the literature review, even including the same lead article, were more broad in their findings, possibly due to the early timing of their work (McGinnis & Foege, 1993). Booske et al. (2010) in the literature review column used McGinnis (2002)after adjusting for genetic factors.
The third method for assigning weight to determinants presented in Figure 3 was
gathered by examining other ranking models, including America’s Health Rankings, those used by Wisconsin, Kansas, Tennessee, and New Mexico. Booske et al. (2010) were not able to directly compare County Health Rankings to other ranking models due to differences in what was contained within a category as well as how the measures of determinants were defined. In order to compare, Booske et al. reorganized measures and created estimated comparisons, as shown in Figure 3.
in the impact of social factors and a decrease in the impact of health behaviors. A recognized limitation of regression analysis used in this case was that the timing of measuring the
determinants and the outcomes may not have allowed time for the impact of the determinant on the health outcome. In other words, the outcomes measured may not truly reflect the impact of the determinant.
The fifth and final method of evaluating the weight of determinants of health is labeled the “pragmatic approach.” This approach is not reliant on data or other research findings. Rather, it is intended to speak directly to public policy decision making and cross-sector engagement. Each factor may have some level of influence on another, and therefore cannot be completely separated in its impacts. In this way, Booske et al. (2010) suggested that a pragmatic approach would weigh each factor equally.
Finally, the County Health Rankings weighting is shown in the ninth column of Figure 3. Because there is, to date, no perfect method of weighing determinants, the County Health
Rankings have settled on a combination of the other five methods shared in the above
paragraphs. According to this document, the most conservative impact of SDH (as defined above to include environmental factors) would be 28% based on the literature review, while all other methods reviewed settle in around 50%. Regardless of the weighting system used, it is clear that a focus on SDH has great potential for improving population health.
What is the role of public health in influencing social determinants and drivers of health? The National Public Health Performance Standards at the Centers for Disease Control and Prevention (CDC) define the public health system as “all public, private, and voluntary entities that contribute to the delivery of essential public health services within a
Within the public health system, local public health agencies are generally tasked with promoting and protecting the health of the public they serve. The CDC identifies “10 Essential Public Health Services,” which were developed by the Core Public Health Functions Steering Committee in 1994 (CDC, 2010). These essential services were created to elaborate upon the three core services of public health described in the 1988 Institute of Medicine report:
assessment, assurance, and policy development (Institute of Medicine Committee for the Study of the Future of Public Health, 1988). Assessment is necessary to understand the drivers of health and the impact of chosen interventions. Thus, the authors of the report recommended that each public health agency regularly and systematically collect, analyze, and share the
information necessary to make decisions about how to improve the health of the public. With the information gathered through regular and careful assessment, the authors recommended that public health workers develop policy agendas rooted in science that promote the health of the public. Finally, the authors of the IOM report recommended that public health agencies assure the public that the resources necessary to create health will be available through collaboration, regulation, or direct service provision. Within these three categories, the ten essential services are described (Institute of Medicine Committee for the Study of the Future of Public Health, 1988):
Assessment:
1. Monitor health status to identify and solve community health problems;
2. Diagnose and investigate health problems and health hazards in the community. Policy Development:
3. Inform, educate, and empower people about health issues;
5. Develop policies and plans that support individual and community health efforts. Assurance:
6. Enforce laws and regulations that protect health and ensure safety;
7. Link people to needed personal health services and assure the provision of health care when otherwise unavailable;
8. Assure a competent public and personal health care workforce;
9. Evaluate effectiveness, accessibility, and quality of personal and population-based health services;
10.Research for new insights and innovative solutions to health problems.
wealth for economic stability and access to neighborhood alliances and mentoring programs for social connectivity.
With respect to policy development, the second grouping of the ten essential services, public health agencies should be “informing, educating and empowering” and “mobilizing community partnerships.”(Institute of Medicine Committee for the Study of the Future of Public Health, 1988) Much of public discourse focuses on individual behaviors and decisions. Public health agencies have an obligation to educate the public about all the different drivers of health, as well as to empower individuals to become involved in the changes that would lead to better health. Public health is rooted in research and development of evidence-based practice. Public health agencies can educate and engage partners in the identification, implementation, and evaluation of evidence-based practices associated with improving or mitigating the adverse consequences of some of the SDH. One compendium of evidence-based practices is The Community Guide to Preventive Services (Fielding et al., 2015), which was created by the Community Preventive Services Task Force in order to review and identify programs and policies that can help improve public health. With these resources, public health agencies can then serve as facilitators or conveners around a variety of health related issues (Alexander et al., 2003; Plough & Olafson, 1994).
opportunities for change. They can bring knowledge about how various sectors impact health and have the opportunity to have positive impacts. They can work together to innovate efficient and impactful collaborations. In addition, assurance demands a highly trained public health
workforce, which means that education around structural and personally mediated racism should be included in standard workforce training. These essential services provide specific entry points for public health workers into the arena of SDH, though they may be outside traditional
definitions of health.
Social Determinants of Health and Health Equity
An additional need for focus on SDH lies in health equity. In North Carolina, people of color have measurably worse health outcomes than white, non-Hispanic people. According to the report “North Carolina Resident Population Health Data by Race and Ethnicity” prepared by the North Carolina Department of Health and Human Services, State Center for Health Statistics in 2017, white and black citizens have exactly the same incidence of total cancer, yet black citizens are 20% more likely to die from this illness (North Carolina Department of Health and Human Services State Center for Health Statistics, 2017). In fact, black men are 2.5-times more likely to die from prostate cancer than white men. The infant mortality rate for Native American children is nearly twice as high as for white children. The same measure for black children is 2.5-times as high as for white children. The adult HIV infection rate is nine-times higher for African
the median household income for an African American family in North Carolina is $33,022. For a Native American family it is $33,094, and for a Hispanic/Latino family, $32,463. If SDH account for a significant amount of individual health outcomes, then it may follow that gaps in social determinants account for some portion of gaps in health outcomes. Engaging in efforts to improve SDH with racial inequities in mind could also lead to improvements in health equity. Purpose
Given the importance of social determinants on health outcomes and health equity, and the role of public health in addressing social determinants, it may be necessary to better
understand how and why local public health agencies in North Carolina are engaging in work to impact SDH, as well as to better understand those that have chosen not to engage in this area. Thus, the purpose of this dissertation is to:
Identify facilitators of and barriers to prioritizing and engaging in work to improve social determinants and social drivers of health by local public health agencies (external to the local health agency);
Identify common characteristics, circumstances, policies, and practices associated with local public health agencies that are prioritizing and engaging in work to improve social determinants and social drivers of health (internal to the local health agency);
CHAPTER 2: LITERATURE REVIEW Introduction
Over the past several decades, researchers have identified a strong link between social, economic, and environmental factors with health outcomes (Davis et al., 1981; J. Lynch, Kaplan, Cohen, Tuomilehto, & Salonen, 1996). Researchers have found that income, education, housing, food security, and other social and economic factors influence health. Still, it has been
challenging to disentangle the unique and interactive effects of various social determinants (Winkleby, Jatulis, Frank, & Fortmann, 1992). For example, people with lower incomes are more likely to live in poor and unsafe neighborhoods and have less access to fresh fruits and vegetables. Is the increased likelihood of negative health outcomes related to the level of income itself, or the combination of effects that having a low income can create that negatively affect health outcomes? Over time, researchers have developed evidence that most SDH have both direct and indirect impacts on lifetime health. For example, highly educated individuals also tend to have jobs with a greater income, consume healthier diets, and live in high quality housing. These indirect effects of an education impact health. However, it appears that level of education alone, independent of whether or not a person uses that education to get a good job, buy a nice house, and eat healthy foods, will also impact lifetime health. Thus, education impacts health both directly and indirectly.
Additionally, gradients of socioeconomic status may have incremental levels of impact on health outcomes (N. E. Adler & Ostrove, 1999). This literature review explores the impact of income, education, environment, social connectedness and racism on health outcomes.
Methodology
In order to identify appropriate research studies, multiple search phrases were employed by the principal investigator within the Google Scholars search engine. Search terms included: “social determinants of health,” “education and health,” “socioeconomic status and health,” “environment and health,” “social context and health,” “public health as community convener,” and “racism and health.” For each search phrase, the abstracts of the top 25 results were
assessed, and if appropriate, identified for full review. The search strategy resulted in a total of 175 article abstracts that were then screened using the following eligibility criteria:
Primary interest of the research was to examine linkages between health status and identified determinant of health;
Article was written in the English language;
Not an opinion or editorial publication.
Of those 175 abstracts, 26 met all study inclusion criteria and were included in this review. In addition to this formal search, 55 articles were identified through examination of citations, or “snowballing” and recommendations from professional colleagues. Each of these 55 articles received full review and 46 were included in this literature survey. Finally, a Google alerts system was set up in October, 2015 and closed in January 2016 with the phrase “social
Income, Wealth, and Economic Hardship
Financial status has many components. Income, wealth, and economic hardship are independent factors that are often tied together in the research of economics and health. Income is defined by Merriam Webster as money received in exchange for work or investment. Wealth more broadly encompasses income, assets, and other areas of financial resources. Economic hardship typically refers to point in time financial difficulty, for example, the loss of a job and associated income or the acquisition of debt following a serious medical problem. Additionally, income or wealth can be tied to education and job status in order to define socioeconomic status, which appears regularly in the literature, but does not allow for distinct examination of finances versus education.
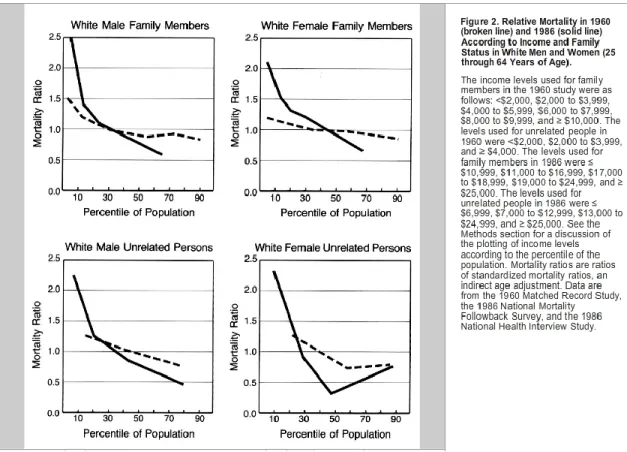
Researchers have identified poverty as a driver of poor health outcomes with studies focused on comparing those living in poverty with people who have high wealth. Additional research has shown that each step up the income ladder comes with improved health outcomes. A study of social service employees in the United Kingdom identified specific gradations, known as the social gradient, in health outcomes by income level. Individuals working in social service institutions, from well-paid directors to low paid clerical staff, were assessed for cardiovascular health. A direct association between income level and health became apparent. With each increase in income, a parallel increase in health outcomes was seen. This was the first time a graded effect was identified, rather than a simpler understanding that poverty was the only level of income that could impact health outcomes (Marmot et al., 1991).
Other research has shown that the gradient may be getting stronger with new
Figure 4. Comparison of mortality by income(Pappas et al., 1993).
This research defining gradation has helped inform additional studies into potential causal associations between wealth, income, and health outcomes. For example, one research team hypothesized that differences in health outcomes by income could be fully explained by the different health behaviors practiced between high and low income groups (Lynch, Kaplan, & Salonen, 1997) The research began with the hypothesis that higher rates of smoking, obesity, alcohol, and drug-use are seen in income communities and can account for the fact that low-income individuals have worse health outcomes than high-low-income individuals who may have better health behaviors. However, there is still a gap in health outcomes, even after accounting for differences in health behaviors. While the mechanism remains undefined, this suggests that there is something specific about income as an independent variable that impacts health
increased risk of myocardial infarction, contributing to higher morbidity and mortality rates (J. Lynch et al., 1996). Still more correlate physical and mental wellbeing with personal wealth (Anastasiadis, 2010; Shea, Miles, & Hayward, 1996). One reason it may be important to separate out wealth from income is that the racial disparities in wealth are potentially far greater than in income and may contribute more to racial health disparities (Shea et al., 1996).
Finally, the demands of life associated with graded levels of economic status are inversely tied to the resources available to deal with those demands. In other words, those with the lowest wealth and income have the highest needs because they live with lower quality housing, in potentially unsafe neighborhoods, with reduced access to food and transportation, and they have the fewest resources to manage those demands. An example of an individual with higher demands and lower resources would be a migrant field worker who has high physical demands, high exposure to environmental toxins, and likely little or no resources for medical care. An individual working at a desk for a salary with benefits would have fewer physical demands on his body and more financial and social resources to manage his personal health (Kaplan, Haan, Syme, Minkler, & Winkleby, 1987).
As noted earlier, there is also a body of literature that examines the directionality of the impact between income and health. There is some evidence from the field of economics
lifelong effects because of the vast amounts of physical, mental, and social development taking place at this point in life (Catalano, 1991). Some argue that social drift impacts the full lifespan only when a difficult health status erupts early in life. For example, onset of schizophrenia in the late teens and early twenties is associated with social drift because it can prevent an individual from completing school, establishing a stable career, and developing wealth (Adler et al., 1994).
The impact of acute or chronic low-income status on health is another area of interest. Much of the analysis of income has focused on snapshots in time, comparing point in time health and point in time income. This has allowed for a stronger understanding of the acute impact of income on health outcomes. For example, job loss and acute economic stress is associated with poor mental health diagnoses and associated nonspecific physiological illnesses (Catalano, 1991). In addition, chronic economic hardship is also strongly associated with lifetime health outcomes. In a closed cohort study following the same individuals for 29 years, individuals below 200% of the poverty level had mortality rates that were nearly twice as high as those who did not face economic hardship (Lynch, Kaplan, & Shema, 1997). Chronic low-income status impacted nearly every functional capacity assessed during the study, leading the research team to conclude that income status has a consistent, chronic, and graded effect on psychological,
physical, and cognitive function.
Education
The connection between educational attainment and health outcomes is well established (Cutler & Lleras-Muney, 2006; Goesling, 2007). As level of education increases, so too does the likelihood of positive health outcomes. It is a critical area of interest, as it appears that the impact of education on health is increasing with each birth cohort(S. Lynch, 2003). Figure 5 shows the effect of education by age based on a linear regression model. The Y access is the amount of education and the x access is the age. The intercept is the effect of education on health by age. The intercept isn't good health or bad health, it's the amount of effect education has on health by age.
Figure 5. The effect of education across age by cohort (S. Lynch, 2003).
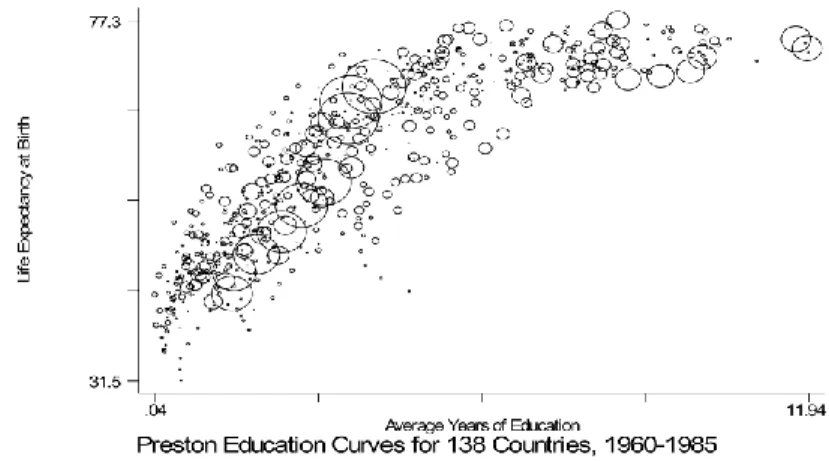
An education gradient, much like an income gradient, also appears in the research. As the amount of education increases from some high school education through a four year degree or more, a reduction in incidence of disease and an improvement in mortality rate can be found (Adler et al., 1994). In Figure 6, average education by country compared to life expectancy shows a positive relationship (Cutler & Lleras-Muney, 2006).
Research has identified at least two health outcomes impacted by educational attainment. Firstly, the greater the amount of education acquired, the more likely an individual is to
experience reduced incidence of disease and improved mortality rates post-diagnosis. Secondly, the greater level of education achieved, the lower the incidence of chronic disease (Castro, 2012). In contrast, the lower the education level, the greater the mortality rate will be if a chronic disease is diagnosed (Christenson & Johnson, 1995). In other words, lower education rates not only mean a greater chance of acquiring a chronic disease, but also a greater chance of dying prematurely because of that disease.
There are several explanations that attempt to describe the factors underlying the association between education and health, which can be sorted into three major ideas that help explain the indirect or intermediate impact on health, including: (1) relationship between education and income; (2) relationship between education and knowledge of self-care; and (3) relationship between education and social and psychological resources (J Paul Leigh, 1983; Masters, Hummer, & Powers, 2012). The first explanation is that increasing educational
Figure 7. Earnings and unemployment rates by educational attainment.
Follow-up research has shown that the total number of years of education, rather than the type of degree or college selectivity, accounts for most of the differences in life expectancy (Catherine E Ross & Mirowsky, 1999). This means that a person with two community college associate degrees may see the same health impact as an individual with a bachelor’s degree. Differences in income, wealth, and other associated constructs are discussed earlier in this review.
The second explanation, focusing on education and knowledge of self-care, shows that increasing educational attainment improves knowledge of self-care and healthy behaviors (J. P. Leigh & Fries, 1994). Those with lower amounts of education have higher rates of smoking, for example, and tobacco-use is associated with increased rates of chronic obstructive pulmonary disease, heart disease, and lung cancer (Montez & Zajacova, 2013).
two ways. The first centers around self-efficacy for healthy living. In other words, those with higher educational attainment improved their belief that they can affect their health, which was in turn associated with improved health behaviors. The second way social resources are defined is in terms of having a social network of support, which is also associated with improved health outcomes. Social support includes having a trusted adult who could help navigate decisions and personal directions. The impact of social support on health is discussed later in this review. Those who went farther in their education had a correlated increase in social support, which was in turn tied to better lifetime health outcomes (Catherine E. Ross & Wu, 1995).
None of the aforementioned explanations can alone account for the impact of educational achievement on disease incidence and overall mortality. After accounting for income, healthy behaviors, and improved psychological attainment, differences in health outcomes by
educational levels persist. It appears that, as with other health determinants, there is some additional direct impact of educational attainment on health outcomes. The act of acquiring higher levels of education directly impacts long term health and its influence has been shown to be independent of income and occupation (Winkleby et al., 1992).
The Built Environment
The physical space in which individuals live, work, and play can impact health outcomes of chronic disease, acute illness, and mental health (Diez Roux, 2001; Wright & Kloos, 2007). The quality of an individual’s home and housing, as well as existence of environmental supports like sidewalks and bike lanes where people work and spend leisure time, has a real and lasting impact on health.
on health because of their effect on health behaviors. For example, high walkability of neighborhoods is associated with increased physical activity and decreased body mass index, regardless of socioeconomic status of the neighborhood (Sallis et al., 2009). If there is no safe place to walk, few will choose walking or biking to run errands or get to work, and even fewer will participate in leisure walking. In addition, overcrowding or unsanitary conditions in the home and neighborhood can increase acute illness through exposure to infectious disease (Krieger & Higgins, 2002). The second impact, known as “weathering,” includes the effect of chronic stress, detrimental environmental exposure, and long-term reduced access to resources (Ellen, Mijanovich, & Dillman, 2001). This can happen as a result of housing proximity to garbage and toxic waste dumps, low water-quality, and poor air-quality. Social factors such as crime and violence also contribute to weathering. Additionally, people who live in low-income communities may lack access to high-quality food, as these neighborhoods may not have stores that sell nutritious food (i.e., food deserts), while also having a wide variety of unhealthy food and drink choices (i.e., food swamps). This can also contribute to chronic health conditions.
Neighborhoods with low socioeconomic status are associated with poor health behaviors. For example, higher rates of smoking, lower rates of physical activity, and poor nutrition are more prevalent in low income neighborhoods than in high wealth neighborhoods (Huie, 2001). However, even after researchers control for these individual health behaviors, the difference in health outcomes between neighborhoods persists (Leventhal & Brooks-Gunn, 2000).
neighborhood may have health status on par with his or her low-wealth neighbors. Even with the protective qualities of income, poor health outcomes persist in this example, leading to the possibility that location of a person’s home in a certain neighborhood independently impacts health outcomes (Diez Roux, 2001). The built environment is likely the key to this issue, not simply health behaviors or the quality of the housing itself. One explanation may be that poor air quality is also associated with increased risk of asthma and other respiratory problems. The family may have enough income to access nutritious food, and a clean and safe home
environment, but is still exposed to lower quality air, limited safe space to be physically active, and other community-level factors.
Social Connectedness
The social context of a person’s life includes the safety of the neighborhoods in which they live, their personal and social associations, and the belief that a person can rely on and work with their neighbors to effect change (Yen & Syme, 1999). Evidence shows that while the
physical space in which a person lives can impact their lives, social context may be important as well (Roberts, 1997).
In addition to the physical properties of housing and neighborhoods, other factors that surround housing can impact health outcomes. Research focused on the “neighborhood effect” examines the relationship between health outcomes and neighborhood-level measures, such as economic hardship, housing costs, social connectivity, and neighborhood socioeconomic status. For example, a negative association between neighborhood-level economic hardship and low birth weight has been shown to exist (Roberts, 1997). One hypothesis examined by the
outcomes. However, the research team drew the conclusion that the lower birth rates may also be indicative of lower social connectivity and social safety nets. For example, these women have fewer friends and family members able to support and guide them toward good prenatal practices. These problems persist throughout the life span, with older adults showing significantly worse health in lower wealth communities, independent of individual socioeconomic status, indicating a need for intervention not just in youth and those of childbearing age, but to be inclusive through end of life (Menec, Shooshtari, Nowicki, & Fournier, 2010).
A subset of the “neighborhood effect” research includes improved understanding of collective efficacy. Collective efficacy is defined as “an emphasis on shared beliefs in a
neighborhood’s conjoint capability for action to achieve an intended effect, and hence an active sense of engagement on the part of residents” (Sampson, 2003). In other words, neighbors believe in each other’s collective interest and ability to make positive change in the neighborhood. This includes such variables as mutual trust among neighbors, shared expectations of relationships, and participation in voluntary community organizations. The results of the author’s analysis show that collective efficacy is an additional factor in determining health as a result of neighborhood membership, as communities with higher “collective efficacy” also had lower rates of violent crime and resulting associated injury, illness, and death.
Racism
Like other social drivers of health, racism has both direct and indirect impacts on the health of individuals. Racism occurs on multiple levels: personally mediated, internalized, and structural or institutional racism (Jones et al., 2009). This literature review will focus on
personally mediated and structural racism and their impacts on health of individuals experiencing racism in daily life. Structural racism is the interaction of policies, practices, and norms that create systems and institutions that provide advantages to some, typically white, people while disadvantaging others, typically minority groups (Lawrence, 2004). Personally mediated racism can be implicit or explicit and is experienced through personal interactions (Lawrence, 2004). An example of personally mediated racism would be the store clerk that closely trails people of color shopping in the store but does not closely track white shoppers, making the person of color feel singled out as a potential criminal. These levels of racism interact and overlap, causing direct and indirect impact on health outcomes.
Indirect impacts of racism appear as an exacerbation of other determinants of health. Structural and personally mediated racism, or the differential treatment of certain racial demographics, increases the risk that an individual will live in poverty, in a less than ideal physical environment, without strong social supports, and with less success in education. As a result, simply having a different skin color means that a person is already at higher risk for the negative health outcomes associated with these social drivers and determinants of health.
behavior. Another area of health directly impacted is birth outcomes. African American infants experience disproportionate rates of premature birth and low birth rates (Thornton et al., 2016). One research study identified five contributors to these outcomes: ethnic differences in
socioeconomic status and health behaviors; higher levels of stress in African American women; greater susceptibility to stress in African Americans; the impact of racism; and ethnic differences in physiological systems (Giscombé & Lobel, 2005). Two of these pathways, racism and stress, contribute directly to negative birth outcomes. Another study explored more perceived-racism-related stress during pregnancy and confirmed the predictive value of perceived racism with negative birth outcomes(Dominguez, Dunkel-Schetter, Glynn, Hobel, & Sandman, 2008).
The systems and behaviors that result in the differential treatment of segments of the American population are leading to negative health outcomes in those same segments. Racism is a predictor of poor health outcomes. An investment in changing those systems and behaviors is as valid an investment as other identified SDH.
Conclusions
Limitations
CHAPTER 3: METHODOLOGY Study Overview
The purpose of this study was to better understand whether and how some local public health agencies in North Carolina are prioritizing and engaging in efforts to improve SDH as well as the motivating factors behind this work. In order to gain an in-depth understanding, a mixed methods approach was employed. The first phase of the study included a survey targeting all local North Carolina health directors or their proxies. The purpose of this survey was to identify knowledge and attitudes around SDH and their impact on community health, as well as to gain an understanding of public health’s efforts to engage cross-sector partners in their work. The survey also assessed local health directors’ perception of whether and how they are
prioritizing SDH and who they perceive to be their partners outside of public health. For example, while a social determinant may not be listed as a “priority,” perhaps developing a partnership with the local education agency is a strategy to overcome another identified priority (e.g., reducing childhood obesity). Lastly, the survey helped to identify appropriate agencies to be recruited into the next phase of data collection.
Background
Every four years, North Carolina local public health agencies are required to complete and submit a CHNA to the North Carolina Department of Health and Human Services (NC DHHS) as a part of the agency accreditation process, which includes a community health action plan as the final step of the CHNA. The purpose of the CHNA is to engage stakeholders in identifying the key issues impacting the health of the community, to share that information with the community, and then to use that information to make a collective plan for improving the community’s health. According to the NC DHHS, CHNA is a “systematic collection, assembly, analysis, and dissemination of information about the health of the community.” More recently, public health agencies have had the option of moving to a three-year cycle in order to partner with hospitals that are required to complete a CHNA as a part of the Affordable Care Act. Each CHNA must follow guidelines laid out by NC DHHS. This includes an eight-phase process:
Phase 1: Establish a community health assessment team. The local health agency identifies local stakeholders, professionals, and community leaders who will drive the community health assessment process.
Phase 2: Collect primary data. This phase requires the collection of local, county-level health data. This may include surveys, interviews, listening sessions, and focus groups in order to learn about the health concerns facing the community. This goes beyond objective health data and includes the subjective perceptions of community members about which health concerns worry them the most.
Phase 4: Analyze and interpret county data. This phase requires the CHNA team to examine the data collected in phases 2 and 3 in order to better understand the factors driving health outcomes in the community.
Phase 5: Determine health priorities. After the data is assessed, compiled, and analyzed, the CHNA team must present findings to the community for feedback. The CHNA team and community participants must then set priorities for working to improve the health of the community, based on the data from phases 2 and 3. These priorities are set for either three or four years, depending on the life cycle of the CHNA (four years for public health agency accreditation, three years if partnering with a health care organization with the purpose of accreditation and meeting Affordable Care Act requirements).
Phase 6: Create the community health assessment document. The CHNA team must compile all of the data and processes used to collect it, along with the new priorities and share a detailed description of methods for how the CHNA team came to those priorities.
Phase 7: Disseminate the community health assessment document. Upon completion of creating the CHNA document, it must be shared widely in the community. This can include press releases, community meetings and other methods.
Each North Carolina county goes through a local version of this process, identifying a range of priority areas. Some public health agencies, known as district health departments, represent more than one county. Though multiple counties may be served by a single public health agency, each county must conduct a community health assessment, create priorities for each of their counties and lay out an action plan for moving forward. Thus, each county has its own health priorities and plans for improvement.
The state public health department requires each county to select at least two of the forty objectives identified by Healthy NC 2020 as priorities for their counties. I reviewed of each county’s publicly available community health assessment revealed a range of priorities, which fell into a handful of themes. These assessments were published between 2010 and 2015. Most counties identified three to five priorities, though one county identified 24 separate priorities. For the purposes of this project, the review was limited to the top five priorities of any county.
Figure 8. Priority themes across North Carolina community health assessments.
Seventy-seven of 100 counties identified chronic disease as one of its top health priorities. While there was consistency across counties in identifying chronic illness as one of their priority areas, there was some variation in the type of chronic illness (e.g., diabetes, heart disease, cancer). In addition, 55 of 100 counties chose behavioral or mental health, 48 of 100 chose access to clinical care, and 46 of 100 chose substance abuse as one of their top priorities. Another 28 of 100 identified other priority areas, including healthy families, personal
responsibility, sexually transmitted diseases, and child and maternal health. Seventeen of 100 counties identified one or more SDH as one of their top five priorities, including:
Alamance: education, economic factors
Cabarrus: un/underemployment, education
Carteret: economic development
Cleveland: social determinants of health
17 55 48 77 46 28 0 10 20 30 40 50 60 70 80 90 100 Social Determinants Behavioral Health
Durham: poverty, education
Granville: success in schools
Haywood: social determinants of health
Hertford: social determinants of health
Mitchell: access/support for low income households (lacking every day needs)
Orange: built environment
Polk: economy and health
Rockingham: social determinants with an emphasis on education
Vance: success in schools
Wake: poverty and unemployment
Wayne: social indicators (poverty, access to health care, crime, education)
Wilkes: economy/poverty
Wilson: poverty/low income
A complete list of priorities by county can be found in Appendix B. Data Collection
for the selection of the four counties was that the local health director had participated in the survey. Next, the county needed to have identified a SDH within its most recent CHNA. Finally, geographic spread and economic tier status were included to ensure a variety of each (East, West, Central, and tier 1, 2, 3).
Within the four counties, stakeholder leaders from sectors associated with SDH (e.g., education, economic development, housing, public safety, and public health) were recruited as key informants for interviews. Key informants must have had a decision-making role within their agency, and that agency must have been commonly acknowledged as a leading organization within a sector impacting a specific SDH (e.g., superintendent of schools, director of housing, faith leaders, etc.) Separate interview processes and guides were developed for public health key informants versus other sectors (Appendices D and E). For non-public health sector key
informants, qualitative data was collected around the mission, vision, and values of the agency. In addition, informants were asked about their interactions with public health and their
understanding of SDH. For public health agency leadership, qualitative data was collected around the vision and values of the agency, and the professional beliefs and values of the organizational leadership about if, how, and why public health agencies should be engaging in multi-sector efforts to impact SDH. These beliefs and values may be a factor in why an agency chooses a level of engagement in SDH. Additionally, the interviews attempted to collect
information describing beliefs of both public health agencies and external partners on the role of public health in social determinants (i.e., activities not traditionally identified as “health”).
role in affecting change in SDH. The interviews were also used to collect information about facilitators and barriers for local public health agencies in prioritizing SDH. Specific to partner agencies outside of the local public health agency, interviews were used to collect information about the stakeholder organization and leaders’ perception of the role of public health in the work of improving SDH, the interest of non-public health sectors in collaborating with the public health agency, and understanding of the capacity of the local health agency to engage in SDH work.
Delimitations
The major delimitation of this study was the decision to focus exclusively on agencies of North Carolina. SDH work faces public health agencies across the nation. As the principal
investigator, I work and practice in North Carolina, and I plan to use this research to create a plan for change to implement here. Including other states in the research may have resulted in a more generalizable product, however, as a North Carolina practitioner, that level of generalizability is not necessary.
A secondary delimitation of this study was the limited number of communities that could be included in Phase II of the research due to the capacity necessary to collect in depth detail about each. This design enabled collection of in-depth organizational details for the development and implementation of a focused plan for change rather than a broad and theoretical plan.
Data Management and Analysis
assessment. This survey was used to collect information from the local health agency director (or designee) regarding beliefs about whether or not the agency should be engaging in work to impact SDH. This data will help to understand which SDH, if any, the local health agency leadership believes they have a role to play. The survey sought to collect data that could help researchers understand the barriers and facilitators to public health engagement in community work to address SDH. The survey asked respondents to share whether or not participants or organizations involved in the CHNA pressed for inclusion of SDH, and if so, who those participants/agencies were. In addition, the survey asked the respondent to identify whether or not the agency has regular partners in other sectors. Finally, the respondent was asked to share whether or not there have been attempts to engage partners from different sectors and whether or not there have been responses to those requests.
Data collected was held confidentially behind password protected encryption and then downloaded and stored in password protected excel files on a secure laptop. While no identifying or attributable data will be shared, results from the interviews were used to identify participants for the second phase of the study. Survey participants were notified that they may be contacted following the submission of the survey. Interviews were audio-recorded and electronically stored in a secure university owned, password-protected cloud service, known as OneDrive.
Interviewees were only identified by participant number on the recording. These recordings were submitted to the online service Transcribeme.com for transcription.
Results from the survey were then analyzed in order to build a profile of characteristics,
circumstances, policies, and practices common among public health agencies engaged in work to improve SDH.
Based on the information procured through the survey, including current priorities, cross-sector partnering efforts, belief in public health role in social determinants, and interest in working on social determinants, four communities were selected for more in-depth data collection. These four communities were intended to be representative of the different
communities found within North Carolina, and allowed for an in-depth, multi-sector analysis. Within each community, the public health agency and representatives from each sector identified in the survey were contacted for a key informant interview. Of 31 individuals who were
contacted, 15 participants from four counties consented to the interview process.
Following the interview and verbatim transcription, the content of the interview was coded using NVivo software. I used both the deductive coding approach, based in themes identified through the initial survey, as well as a grounded theory approach to coding, which allowed for the development of codes inductively. A “constant comparison” method was used to continuously compare newly coded language to previously coded language (Glaser & Strauss, 1967). When matches appeared, new language was coded with existing codes and when it did not, new codes were added. These codes were used to develop themes around the barriers and facilitators for public health agencies to engage in affecting SDH. Barbour (2001) pointed out that the degree of agreement between two coders is less important than the discussions that follow about the disagreement. This allowed me and additional coders (fellow University of North Carolina, School of Public health DrPH candidates) to expand perceptions and
CHAPTER 4: QUANTITATIVE RESULTS
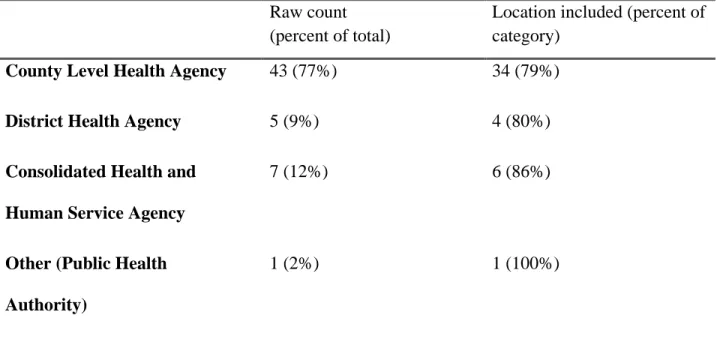
Fifty-seven of North Carolina’s 84 local health directors (68%) responded to the survey. Of those 57, one began the survey but only completed the first question and was therefore removed from the data set. Eleven of the 56 completed some portion of the survey, but did not provide all responses or any location data and were therefore excluded from the analysis that required location information. Forty-five respondents completed the entire survey, representing 52 of North Carolina’s 100 counties. Five of the respondents represented multiple counties.
Table 1. Type of agency responding to the survey (N = 56). Raw count
(percent of total)
Location included (percent of category)
County Level Health Agency 43 (77%) 34 (79%)
District Health Agency 5 (9%) 4 (80%)
Consolidated Health and Human Service Agency
7 (12%) 6 (86%)
Other (Public Health Authority)
1 (2%) 1 (100%)
allotted time frame for non-profit hospital community benefit requirements (within the past three years) and all responded within the allotted time frame for NC Public Health Agency
accreditation (within the past four years).
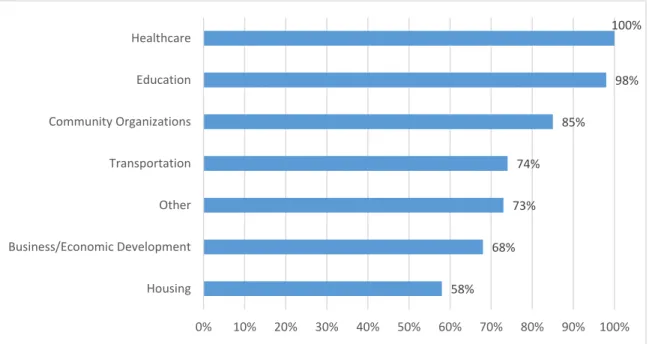
Figures 9–12 use an “N” of 45 or 56, depending on the number of completed responses. Fifty-four of 54 (100%) respondents reported collaborating with at least one other sector (Figure 9) outside of the assessment process. The most popular sectors for collaboration included
education (98%) and health care (100%). Over 80% reported partnering with a community organization, like Big Brothers and Big Sisters, or community associations. In addition, 78% reported partnering with a hospital or hospital system specifically for the CHNA process. This indicates that some agencies who do not partner with hospitals during the CHNA process still partner with the health care sector in some format.
Figure 9. Partnership by sector (N = 56).
Nearly three quarters partnered with transportation, business, and/or economic
development sectors. Though housing had the lowest rate of reported partnership, 58% reported
58% 68%
73% 74%
85%
98% 100%
0% 10% 20% 30% 40% 50% 60% 70% 80% 90% 100%
Housing Business/Economic Development Other Transportation Community Organizations Education Healthcare