NEIGHBORHOOD BUILT ENVIRONMENT CHARACTERISTICS AND COGNITION IN NON-DEMENTED OLDER ADULTS
Lilah M. Besser
A dissertation submitted to the faculty at the University of North Carolina at Chapel Hill in partial fulfillment of the requirements for the degree of Doctor of Philosophy in the Department
of City and Regional Planning.
Chapel Hill 2017
Approved by: Daniel A. Rodríguez
Noreen McDonald Yan Song
ABSTRACT
Lilah M. Besser: Neighborhood Built Environment Characteristics and Cognition in Non- Demented Older Adults
(Under the direction of Daniel A. Rodriguez)
Research suggests that neighborhood built environment (BE) characteristics consistent with increasing urban density may be associated with better cognition in older adults; however, few of these studies have been conducted to date. Focusing on older adults, my study aimed to: 1) systematically review studies on neighborhood social and BE and cognition; 2) examine whether social/walking destination density, intersection density, residential/retail land use, distance to nearest bus/train stop, or population density is associated with cognition; and 3) investigate if BE-cognition associations vary by individual-level characteristics (education, race/ethnicity, sex, apolipoprotein 4 genotype [APOE; genetic risk factor for Alzheimer’s disease], or sedentary behavior).
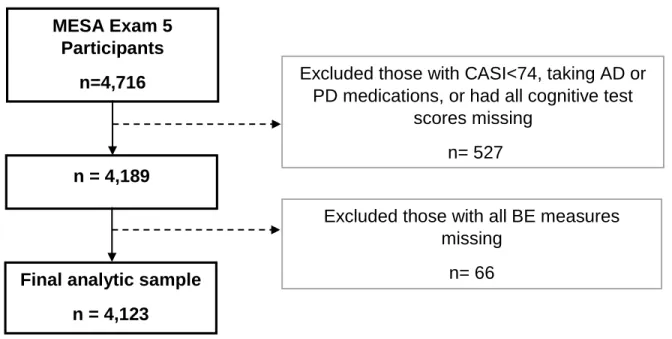
I used cross-sectional, Exam 5 data on 4,123 participants from the Multi-Ethnic Study of Atherosclerosis (MESA), a longitudinal study of subclinical cardiovascular disease that began in 2000. MESA recruited from six US regions (New York, Baltimore, Chicago, Los Angeles, Minneapolis-St. Paul, and Winston Salem) and oversampled minorities (Chinese, African American, and Hispanic).
with better cognition. Additionally, the literature suggested that lower neighborhood
socioeconomic status (SES) is associated with worse cognition, independent of individual-level SES. Aim 2 analyses suggested that increasing population and intersection density are associated with worse cognition, whereas increased land dedicated to retail uses is associated with better cognition. Aim 3 analyses suggested that BE-cognition associations vary significantly by an individual’s education, race/ethnicity, sex, APOE genotype, and sedentary behavior. BE
characteristics consistent with increasing urban density were associated with worse cognition in Hispanics but not Whites and in APOE 4 carriers but not APOE 4 non-carriers.
ACKNOWLEDGEMENTS
Thank you to my dissertation committee for your help and feedback. A special thanks to my dissertation advisor, Daniel Rodriguez, and my work supervisor, Bud Kukull, who supported me in pursuing my PhD through life’s ups and downs. I would also like to thank the
TABLE OF CONTENTS
LIST OF TABLES ... xii
LIST OF FIGURES ... xiii
LIST OF ABBREVIATIONS AND SYMBOLS ... xiv
CHAPTER I: INTRODUCTION ...1
Section 1.1: City planning, the built environment, and public health...1
Section 1.2: The research problem ...3
Section 1.3: Cognition ...5
Section 1.4: Gaps in the literature ...7
Section 1.5: Dissertation study proposal ...9
Section 1.6: Conceptual framework ...11
Section 1.7: Neighborhood built environment measures ...17
Section 1.8: Cognitive measures ...20
Section 1.9: Contributions of dissertation study ...22
CHAPTER II: NEIGHBORHOOD ENVIRONMENT AND COGNITION IN OLDER ADULTS: A SYSTEMATIC REVIEW ...26
Section 2.1: Context ...26
Section 2.2: Evidence acquisition ...28
Section 2.2.1: Search criteria ...28
Section 2.3: Evidence synthesis ...29
Section 2.3.1: Research methods ...30
Section 2.3.2: Neighborhood social characteristics and cognition ...30
Section 2.3.3: Neighborhood built environment and cognition ...31
Section 2.3.4: Effect modification of neighborhood environment-cognition association ...32
Section 2.3.5: Risk of bias ...34
Section 2.4: Discussion ...35
Section 2.4.1: Quality of studies ...38
Section 2.4.2: Limitations of this review ...40
Section 2.4.3: Future directions ...40
CHAPTER III: NEIGHBORHOOD BUILT ENVIRONMENT AND COGNITION IN OLDER ADULTS: THE MULTI-ETHNIC STUDY OF ATHEROSCLEROSIS ...48
Section 3.1: Introduction ...48
Section 3.2: Methods ...50
Section 3.2.1: Sample ...50
Section 3.2.2: Cognitive and built environment measures ...51
Section 3.2.3: Participant characteristics ...52
Section 3.2.4: Statistical methods ...53
Section 3.3: Results ...54
Section 3.4: Discussion ...58
CHAPTER IV. MODERATION OF THE BUILT ENVIRONMENT AND COGNITION ASSOCIATION IN OLDER ADULTS BY
INDIVIDUAL-LEVEL FACTORS: THE MULTI-ETHNIC STUDY OF
ATHEROSCLEROSIS ...73
Section 4.1: Introduction ...73
Section 4.2: Material and Methods ...78
Section 4.2.1: Sample ...78
Section 4.2.2: Cognitive and built environment measures ...78
Section 4.2.3: Participant characteristics ...80
Section 4.2.4: Methods ...80
Section 4.3: Results ...81
Section 4.3.1: Main analyses ...83
Section 4.3.2: Sensitivity analyses for effect modification by sex ...84
Section 4.3.3: Sensitivity analyses for effect modification by APOE genotype ...85
Section 4.3.4: Sensitivity analyses for effect modification by sedentary behavior ...86
Section 4.4: Conclusions ...87
CHAPTER V. OVERALL SUMMARY AND CONCLUSIONS ...98
Section 5.1: Summary of findings ...98
Section 5.2: Study limitations ...106
Section 5.3: Future studies ...108
Section 5.4: Implications for urban planning ...110
Section 5.5: Conclusion ...113
APPENDIX 2.3: RESEARCH METHODS OF THE 25 REVIEWED STUDIES ...120 APPENDIX 2.4: STUDIES EXAMINING ASSOCIATIONS BETWEEN
NEIGHBORHOOD SOCIAL CHARACTERISTICS AND COGNITION...123 APPENDIX 2.5: STUDIES EXAMINING ASSOCIATIONS BETWEEN
NEIGHBORHOOD BUILT ENVIRONMENT AND COGNITION ...127 APPENDIX 2.6: STUDIES EXAMINING EFFECT MODIFICATION
BETWEEN NEIGHBORHOOD SOCIAL AND BUILT ENVIRONMENT
CHARACTERISTICS AND COGNITION ...129 APPENDIX 3.1: PAPER 2 ABSTRACT ...132 APPENDIX 3.2: NEUROPSYCHOLOGICAL TEST SCORES AT EXAM 5 ...134 APPENDIX 3.3: COMPARISON OF EXCLUDED PARTICIPANTS FROM
EXAM 1 AND ANALYTIC SAMPLE ...135 APPENDIX 3.4: COMPARISON OF ANALYTIC SAMPLE AND EXCLUDED
PARTICIPANTS FROM EXAM 5 ...136 APPENDIX 3.5: NEIGHBORHOOD BUILT ENVIRONMENT
CHARACTERISTICS OF OVERALL SAMPLE AND STRATIFIED BY
INDIVIDUAL-LEVEL EDUCATION AND RACE/ETHNICITY ...137 APPENDIX 3.6: CORRELATION BETWEEN BUILT ENVIRONMENT
MEASURES ...139 APPENDIX 3.7. UNADJUSTED ASSOCIATION BETWEEN BUILT
ENVIRONMENT MEASURES AND COGNITIVE TEST SCORES ...140 APPENDIX 3.8. ADJUSTED ASSOCIATION BETWEEN BUILT
ENVIRONMENT MEASURES AND COGNITIVE TEST SCORES, USING
¼-MILE MEASURES ...141 APPENDIX 3.9. ADJUSTED ASSOCIATION BETWEEN BUILT
ENVIRONMENT MEASURES AND COGNITIVE TEST SCORES, USING
1-MILE MEASURES ...142 APPENDIX 3.10. MEDIATION OF ASSOCIATION BETWEEN POPULATION
DENSITY AND COGNITIVE ABILITIES SCREENING INSTRUMENT SCORE ...143 APPENDIX 3.11. MEDIATION OF ASSOCIATION BETWEEN PROPORTION
APPENDIX 3.12. PRIMARY LANGUAGE AND BIRTH COUNTRY BY
RACE/ETHNICITY ...145 APPENDIX 4.1: PAPER 3 ABSTRACT ...146 APPENDIX 4.2. UNADJUSTED ASSOCIATION BETWEEN BUILT
ENVIRONMENT MEASURES AND COGNITION, STRATIFIED BY SEX ...148 APPENDIX 4.3. UNADJUSTED ASSOCIATION BETWEEN BUILT
ENVIRONMENT MEASURES AND COGNITION, STRATIFIED BY APOE
GENOTYPE ...150 APPENDIX 4.4. UNADJUSTED ASSOCIATION BETWEEN BUILT
ENVIRONMENT MEASURES AND COGNITION, STRATIFIED BY
SEDENTARY BEHAVIOR ...152 APPENDIX 4.5. UNADJUSTED ASSOCIATION BETWEEN TOP
THREE PRINCIPLE COMPONENTS OF ANCESTRY AND COGNITIVE
MEASURES ...154 APPENDIX 4.6. UNADJUSTED ASSOCIATION BETWEEN TOP
THREE PRINCIPLE COMPONENTS OF ANCESTRY AND BUILT
ENVIRONMENT MEASURES ...155 APPENDIX 4.7. EFFECT MODIFICATION OF ADJUSTED ASSOCIATION
BETWEEN BUILT ENVIRONMENT AND COGNITION BY SEX USING
¼-MILE AND 1-MILE MEASURES ...156 APPENDIX 4.8. EFFECT MODIFICATION OF ADJUSTED ASSOCIATION
BETWEEN BUILT ENVIRONMENT AND COGNITION BY APOE
GENOTYPE USING ¼-MILE AND 1-MILE MEASURES ...158 APPENDIX 4.9. EFFECT MODIFICATION OF ADJUSTED ASSOCIATION
BETWEEN BUILT ENVIRONMENT AND COGNITION BY SEDENTARY
BEHAVIOR ...160 APPENDIX 4.10. PERCENT MISSING BUILT ENVIRONMENT
MEASURES BY SEX, APOE GENOTYPE, AND SEDENTARY BEHAVIOR ...161 APPENDIX 4.11. PERCENT MISSING COGNITIVE TESTS BY SEX, APOE
LIST OF TABLES
Table 2.1 – Findings for studies examining neighborhood social characteristics
and cognition among older adults ...43 Table 2.2 – Findings for studies examining neighborhood built environment
characteristics and cognition among older adults ...45 Table 2.3 – Potential risk of bias in the 25 reviewed papers ...46 Table 3.1 – Demographics, APOE genotype, and health conditions ...66
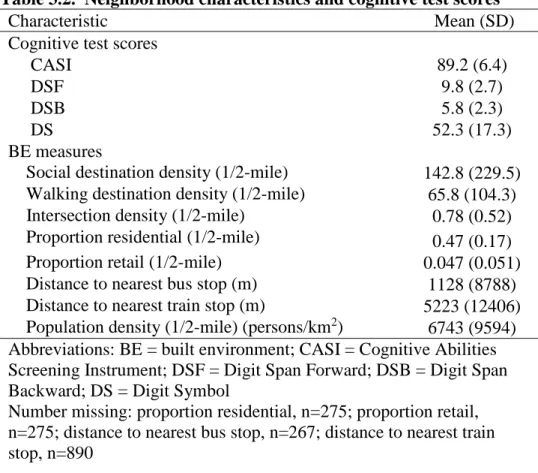
Table 3.2 – Neighborhood characteristics and cognitive test scores ...68 Table 3.3 – Adjusted association between neighborhood built environment
and cognitive test measures ...69 Table 3.4 – Effect modification of association between built environment and
cognition by education ...70 Table 3.5 – Effect modification of association between built environment and
cognition by race/ethnicity ...71 Table 4.1 – Demographics, APOE genotype, and health conditions ...92 Table 4.2 – Mean values for built environment measures by sex, APOE 4
genotype, and sedentary behavior ...93 Table 4.3 – Mean values for cognitive test measures by sex, APOE 4 genotype,
and sedentary behavior ...94 Table 4.4 – Effect modification of adjusted association between built environment
and cognition by sex ...95 Table 4.5 – Effect modification of adjusted association between built environment
and cognition by apolipoprotein 4 genotype ...96 Table 4.6 – Effect modification of adjusted association between built environment
LIST OF FIGURES
Figure 1.1 – Trend in publications on neighborhood characteristics and cognition
in older adults, 2001-2012 ...24 Figure 1.2 – Conceptual model of the causal mechanisms linking the built
LIST OF ABBREVIATIONS AND SYMBOLS
4 Apolipoprotein epsilon 4 allele, Alzheimer’s disease genetic risk factor
AD Alzheimer’s disease
APOE Apolipoprotein E
BE Built environment
CASI Cognitive Abilities Screening Instrument
CES-D Center for Epidemiologic Studies Depression Scale COPD Chronic obstructive pulmonary disease
DS Digit Symbol
DSB Digit Span Backward
DSF Digit Span Forward
FDA Federal Drug Administration
HIA Health impact assessment
KM Kilometer
MCI Mild cognitive impairment
mmHg Millimeter mercury
MESA Multi-Ethnic Study of Atherosclerosis
MESA-SHARE Single Nucleotide Polymorphism (SNP) Health Association Resource
MMSE Mini Mental State Exam
NSES Neighborhood socioeconomic status
PA Physical activity
PC1-PC3 Principle components number 1 through 3
QOL Quality of life
SE Social environment
SEM Socioecological model
SES Socioeconomic status
TICS Telephone Interview for Cognitive Status
UK United Kingdom
US United States
I. INTRODUCTION
1.1. City planning, the built environment, and public health
Beyond exposures, characteristics, and risk factors measured at the level of the
individual, contextual factors such as features of the community environment may have negative and positive effects on health. Increasingly, community level characteristics and exposures, such as the social and physical characteristics of a neighborhood, have been incorporated into public health research1, thereby indirectly exploring the public health consequences of urban planning policies. For example, as a product of planning policies and infrastructure investment, the built environment (BE) has been associated with a range of health-related behaviors and outcomes such as physical activity, depression, and quality of life2-5 in past studies, and thus, there is an intrinsic connection between planning and health.
Historically, city planning efforts were often based on concerns for public health and safety, although the planning and public health fields can seem disparate today.6 For instance, zoning was originally based on the desire to reduce crowding and proximity of undesirable land uses and the associated health problems. Recently, planners have started incorporating
planning timeline in which considerations of health can be incorporated: 1) in providing motivation for planning efforts; 2) in developing partnerships with other agencies; 3) in setting up objectives, policies, and priorities that include health; and 4) in making structural changes to incorporate public health impacts during the decision making process. This latter strategy may include implementation of health impact assessments (HIA), tools that can be used to assess the potential health consequences of policies, projects, or programs. To date, HIAs have been used in a modest number of locales by planners in collaboration with public health professions.8
The academic literature suggests an increase in the amount of interdisciplinary research spanning the planning and health fields, although the differences in the technical vocabulary9, methods, and priorities of the professionals in the two disciplines can be challenging. For instance, while transportation planners may be focused on predicting mode choice (automobile, transit, bicycle, or walking) for comprehensive plans, public health researchers may be
concerned with whether walking or bicycling to places meets daily physical activity
recommendations. The growing interest in examining the connection between urban planning and health relates to evidence that aspects of the BE are associated with health outcomes. For example, one literature review found sufficient evidence to promote physical activity by
implementation of urban planning policies that increase population density, decrease distance to nonresidential places, and increase land use mix.10 While research on the intersection between BE and health has increased in productivity over the years, much work is still needed,
particularly with respect to understanding how the BE influences health in vulnerable populations such as children11, minorities and the economically disadvantaged12, and older adults.13 Ultimately, urban planners and public health professionals need to collaborate to
planners are essential for determining the best means of measuring the BE and for providing their planning expertise to inform these types of studies from inception.
The impact of urban planning decisions on the health of older adults is a salient topic, with planning for aging recognized as an important issue by the American Planning
Association14 and with recent increases in US funding for aging and dementia research15. In 2013, the US population of adults aged 65 years and older was estimated at 45 million,
representing 14% of the population.16 Older adults are expected to grow to over 22% of the US
population and their numbers will approximately double to over 83 million by 2050.16,17 As a result of the projected increase in this population over the next 40 years, the prevalence of health problems associated with older adults can also be expected to greatly increase and pose a
significant public health burden. In addition, approximately 80% of the US population lived in urban areas in 201018 and over 90% of older adults would like to age in place, staying in their
homes and neighborhoods for as long as possible.19 Therefore, urban planning and public health policies developed to preserve health among older adults and allow them to remain in their neighborhoods may help relieve the economic and public health burden associated with the increasingly aging nation.
1.2. The research problem
with limited research on older adults24,25, although the impact of the neighborhood environment on older adults may be intensified by issues such as limited mobility, disability, lack of local social and family ties, cognitive impairment, and a heightened sense of a lack of safety. Given the expected rise in the population of older adults, better information is needed on the
possibilities of aging in place and the neighborhood and BE factors that are associated with positive and negative health outcomes in this population.
The neighborhood increases in importance as older adults spend less time driving and experience shrinking social networks26. The life space of older adults, the area they conduct all of their activities, declines sharply upon driving cessation27, with up to 33% spending little time outside of their neighborhood.28 Some studies suggests that driving cessation is associated with depression and decreased time spent outside of the home, but the evidence to date is limited27,29, and at least one study found that social engagement with neighbors did not decline after driving cessation.30 Although some older adults will spend more time in the neighborhood and in their homes and less time driving due to cognitive or physical difficulties31, the number of healthy older adults spending more of their time in the neighborhood will likely increase with the rising population living in urban areas and desiring to age in place.32
Two health behaviors that are directly influenced by the older adult’s neighborhood environment are their walking and social interactions. Walking in older adults has been
associated with proximity to destinations, street connectivity, and traffic and street conditions.26 In addition, higher levels of social participation have been found among older adults who live closer in proximity to social destinations33 and who live in neighborhoods with higher levels of mixed-used development and walkability34. Neighborhoods with higher levels of walkability are
banks, post offices, retail establishments, and parks; shorter distances to get to nearby
destinations; safe walking environments including sidewalks, walking paths, sufficient lighting, and crosswalk signals; and elements of design that encourage walking such as building setbacks. 1.3. Cognition
The issue of cognitive impairment is of public health importance for a number of reasons, including the high prevalence of dementia (e.g., Alzheimer’s disease dementia) and mild
cognitive impairment (MCI) among older adults. Alzheimer’s disease (AD), one of the major causes of dementia and MCI, affects approximately 5 million older adults in the US. Assuming no treatments have been found to reduce AD incidence, it is projected there will be 13.8 million Americans with AD by 2050.35 Worldwide, approximately 47 million individuals were
diagnosed with dementia in 2015, and that number is expected to rise to 132 million in 2050.36 In addition, MCI is estimated to be present in ≥10% of older adults.37 Before receiving a diagnosis
of AD, many individuals are first diagnosed with mild cognitive impairment (MCI), which is characterized by cognitive symptoms that do not yet significantly affect activities of daily living such as balancing a checkbook or following a recipe.38,39 MCI is often due to AD, but can also be caused by other neurodegenerative diseases or due to systemic illness, stroke, depression, or medications, among other causes.37 Individuals with cognitive impairment not meeting the
diagnostic criteria for dementia are at high risk for developing dementia in the future.40
Consequently, interventions and public health prevention efforts that target the early stages that precede dementia are expected to have the best chance of reducing the incidence and prevalence of dementia.
comorbidities may help delay AD onset. The few FDA approved medications for AD have been shown to improve cognitive symptoms for a few years at most, sometimes offer no relief, and do not halt the progression of the disease pathology but instead simply treat the symptoms.41 Much of the preventive research related to cognitive decline and dementia has been focused on
studying the biological mechanisms that could be targeted via a pharmaceutical treatment. However, some studies have examined how cognition is affected by factors that may not be directly related to the primary pathological cause of the disease, but that may help via mechanisms related to improved vascular health or cognitive reserve. Examples include
interventions such as treating hypertension or increasing physical activity.41 Additionally, studies have found that years of education and a history of mentally demanding jobs were associated with lower risk of dementia or a delay in dementia onset, and that performing mentally
demanding activities such as crossword puzzles was associated with better cognition and may be associated with reducing pathology associated with Alzheimer’s disease dementia.41-43 New
studies are needed to determine whether other non-pharmaceutical mechanisms have some effect on the incidence of cognitive impairment or if they can delay onset.
Urban planning may relate to cognition in older adults in a number of ways. The types of housing that is suitable and available for older adults affects whether they live in urban,
suburban, or rural areas, and consequently, the incidence and prevalence of cognitive impairment and dementia may vary by neighborhood/area depending on the availability of housing.
Similarly, neighborhoods that are more suitable for older adults (e.g., greater proportion of older adults, perceived as safer, less confusing) will likely retain individuals as they age and attract individuals to move there, thereby affecting area-level incidence and prevalence of cognitive impairment. Regions that plan for and accommodate older adults through urban planning policies and infrastructure investments can influence cognition by allowing individuals to age in place. Neighborhood factors that would encourage aging in place include environments that provide safe spaces for walking, that are easier to navigate, and that have suitable housing options. More specifically, urban planning policies may positively influence cognition when they foster the development of neighborhood environments that promote mental, physical and social activity. Examples of BE features that may improve cognition include presence of nearby social and walking destinations and green space. On the other hand, urban planning policies that promote driving may result in neighborhood environments that are not walkable or safe for older adults, and thus could be detrimental to their cognition.
1.4. Gaps in the literature
cognition in older adults, although it seems likely that the neighborhood environment becomes increasingly important to the health of older adults because they drive less and spend more time closer to home as they age.
Some studies have found that the prevalence of dementia and cognitive impairment is higher in rural than urban regions.44,45 Although education or other individual-level differences between urban and rural residents may help explain these findings, the regional differences also may relate to environmental or social factors that are better measured at the level of the
neighborhood. For instance, a previous systematic review on community environment and cognition in older adults (n=14 published studies)46 found that worse neighborhood
socioeconomic status (SES) was associated with worse cognition after controlling for individual-level demographics and SES. Only one of the 14 studies examined BE characteristics47, finding that living in neighborhoods with more institutional resources (e.g., libraries) was associated with better cognition.
Before 2005, little research was conducted on the neighborhood’s influence on cognition in older adults (Figure 1.1), with the bulk of the work published in 2011 and 2012. Additionally, almost all of the research on the topic focused on neighborhood social characteristics. Thus, although it appears that the research interest in neighborhood environment and cognition in older adults in increasing, and previous studies suggests significant associations particularly between neighborhood SES and cognition, there is a large gap in the literature regarding the
1.5. Dissertation study proposal
My dissertation study uses data from the Multi-Ethnic Study of Atherosclerosis
(MESA)48 to examine whether neighborhood BE characteristics are cross-sectionally associated with cognition in non-demented older adults. Additionally, I examine whether the BE-cognition associations vary by individual-level demographics, apolipoprotein E genotype, a genetic risk factor for developing Alzheimer’s disease dementia, or sedentary behavior.
MESA is a population-based, longitudinal cohort study aimed at examining the
characteristics and risk factors for progression of subclinical cardiovascular disease. Since 2000, six exams have been conducted on the 6,814 participants aged 45 to 84 year olds living in six US regions (New York, Baltimore, Chicago, Los Angeles, Minneapolis-St. Paul [Twin Cities
henceforth], and Winston Salem). The study was designed to oversample minorities, resulting in 39% whites, 28% African Americans, 12% Chinese Americans, and 22% Hispanics at baseline. My analyses are restricted to Exam 5 (2010-2012), the most recent exam available to researchers that also has cognitive assessment data.
The findings of the study are written up as three publishable papers:
Paper 1. The first paper is a systematic review of published studies on the neighborhood social and BE and cognition in older adults. As the aim of Paper 1, a comprehensive literature review was not provided in the introduction section of my dissertation.
Paper 2. The second paper is focused on neighborhood BE characteristics and cognition among older adults, and effect modification of the BE-cognition associations by education and race/ethnicity. The first aim cross-sectionally examines whether multiple neighborhood BE characteristics are associated with cognition, with the hypothesis that BE characteristics
investigates if the BE-cognition associations vary based on individual-level education or race/ethnicity. Few published studies can help inform hypotheses on effect modification by individual-level education or ethnicity; however, one study47 found that cognition of non-white participants was negatively impacted by the presence of institutional resources, suggesting that we may find cognition of non-white participants and those of lower education may be affected differentially by the BE compared to participants of white race and higher education.
Paper 3. The third paper examines effect modification of the BE-cognition associations by individual-level sex, APOE genotype, or sedentary behavior. The first aim is to examine whether there are sex-based differences in the associations between neighborhood BE and cognition, with the hypothesis that the association between the BE and cognition will be stronger in women than men. The second aim assesses whether the associations between neighborhood BE and cognition varies by sedentary behavior. The hypothesis is that the BE-cognition associations will be stronger among those with lower levels of television watching in a typical week in the past month. Higher levels of television watching will serve as a proxy for decreased time exposed to the neighborhood environment during a typical week. The third aim investigates if the presence of at least one APOE 4 allele modifies the association between neighborhood BE and cognition, with the hypothesis that the BE-cognition associations will be stronger among those with ≥1 APOE 4 alleles.
1.6. Conceptual framework
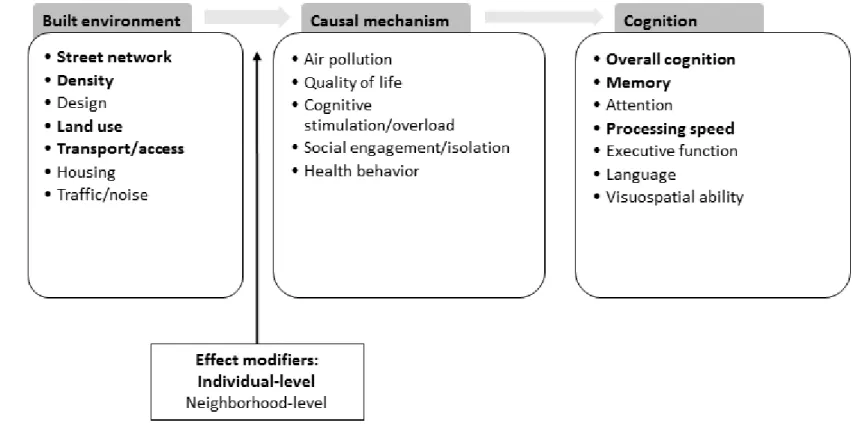
The conceptual framework guiding my dissertation work combines and builds upon previously proposed models. Many aspects of the BE may influence cognition and this may occur through one or more causal mechanisms, as outlined in my conceptual model in Figure 1.2.
The neighborhood BE factors proposed to influence cognition have been grouped into the following major categories: 1) street network, including factors such as intersection density and block size; 2) density, including factors such as population and housing density; 3) land use, including factors such as presence of social destinations and parks; 4) transport and access, including factors such as presence of sidewalks and bike paths; 5) design, including factors such as condition of sidewalks and aesthetics; 6) housing, including factors such as housing types and heights; and 7) environments conducive to traffic and noise, including factors such as tall
buildings and proximity to major roadways.
The BE characteristics outlined above may relate to cognition through a number of causal mechanisms: 1) air pollution exposure; 2) quality of life; 4) cognitive mechanisms; 5) social mechanisms; and 6) health behaviors. Details about each causal mechanism are below.
Air pollution. Urban environments can be associated with increased exposure to vehicular pollutants due to decreased distances to busy roadways.50 Airborne pollutants51 have been
associated with worse cognition in older adults, and therefore, the BE may be associated with cognition by increasing or decreasing risk of exposure to pollutants. If found to be a valid causal mechanism relating the BE and cognition, air pollutant exposures would mediate the association between BE and cognition.
depression. BE characteristics that improve QOL may in turn improve cognition. In past studies, land use mix, parking density, mass transit station density, population density, and neighborhood SES have been associated with differences in QOL20,52-54. In addition, neighborhoods with higher levels of walkability, greater access to transit, and greater density have been associated with lower levels of depression.22,55,56 Traffic and other noise associated with an urban
environment may be associated with greater levels of anxiety57 and increased traffic volume has been associated with greater perceived stress.58 Stress in late-life has been associated with worse
baseline cognition and cognitive decline in older adults59,60 and a decrease in stressors has been associated with improved cognition.61 Thus, evidence suggests that the mental health aspect of QOL is a plausible causal mechanism relating the BE and cognition.
QOL research often measures QOL through a composite measure that incorporates multiple aspects of physical and mental health and wellbeing. These kinds of broader QOL measures have been understudied to date in relation to exposures that may impact cognition.62 Although some studies have investigated changes in QOL in relation to cognitive
functioning63,64, few have examined how QOL affects cognition.62 Similarly, no known studies have examined how the BE may influence cognition by way of improved or worsened QOL. Nonetheless, the complicated and multifaceted nature of the BE seems likely to be associated with QOL, and QOL is a plausible predictor of cognitive functioning. If found to be a valid causal mechanism, measures of QOL, such as anxiety, stress, depression, and composite QOL measures, would mediate the BE-cognition association.
such as working on crossword puzzles, has been associated with improved cognition in older adults.65,66 Similarly, living in a complex neighborhood environment in older age may help delay
onset of cognitive impairment by requiring constant but passive adaptation that serves as a beneficial source of mental stimulation.67 However, the neighborhood BE may serve as a source of cognitive overload68,69 if the neighborhood environment becomes too complex to process and navigate by older adults. While there are no obvious mediators of the BE-cognition association assuming this causal mechanism, measures of brain activity could conceivably suggest that this mechanism is at work.
Social engagement/isolation. Some research suggests that staying social in older age can reduce the risk of dementia.70,71 Neighborhoods with more social opportunities may improve social engagement and consequently maintain or improve cognition. On the other hand, neighborhood psychosocial disorder (e.g., crime, graffiti), fear of falls72, and sensory overload
(e.g., confusing spaces, noise, crowds)73 may increase social isolation74,75 if residents minimize neighborhood-based walking. Increased social isolation may then worsen cognition. Measures of social participation in the neighborhood would be an example of a mediator of the BE-cognition association based on this causal mechanism.
Health-related behaviors. The neighborhood BE may influence health behaviors such as PA or diet, thereby affecting cognition through changes in vascular and endocrine health. PA interventions have been associated with improved cognition in those with normal cognition, mild cognitive impairment, and dementia76-78, and some evidence indicates that certain BE features may be associated with increases in overall PA.20,79 Other health behaviors that may be affected by the BE and that may be associated with cognition include eating habits based on
neighborhood has been associated with increased fast food consumption in younger adults.80 In turn, diabetes, a diet-related health condition, has been associated with cognition and brain atrophy associated with cognitive impairment.81 In addition, the choice of transport modes other than driving has been associated with increases in urban density and land use mix.82,83 Decreases in driving may be associated with less sedentary behavior due to increased walking for transit, but it is also possible that the opposite occurs, in which older adults living in denser
neighborhood environments travel less in general and this lack of cognitive stimulation is
associated with worse cognition. Measures of the health behaviors, such as PA, diet, and driving, would be mediators of the BE-cognition association under this causal mechanism.
Cognition. The BE may affect an individual’s overall cognitive functioning, or possibly only certain cognitive domains, depending on the causal mechanisms at work. Additional details about cognitive domains are discussed further below, but briefly, the domains include memory, attention, processing speed (efficiency of completing tasks), language (e.g., naming everyday objects), executive function (e.g., problem solving), and visual-spatial function. If a particular cognitive domain is affected, this may suggest a region of the brain that is affected by a given environmental exposure such as the BE. For instance, consider visuospatial function, which is one’s ability to perceive and reconstruct the spatial relationship of objects. This cognitive domain seems likely to be affected by the BE, with greater time spent in the neighborhood possibly improving one’s visuospatial abilities through practice of navigating the neighborhood.
increasing age because younger older adults can more easily navigate around parts of the neighborhood that are in worse condition.
In determining plausible effect modifiers, it is useful to consider some of the previously outlined causal mechanisms relating the BE and cognition. For instance, if the BE-cognition association relates to air pollution exposure, effect modifiers could include time spent walking in the neighborhood, distance to the nearest busy road, and home ventilation. Individuals who walk more often in their neighborhoods may have the worst cognitive function because of increased exposure to the air pollution. If the BE-cognition association relates to QOL and mental health, a plausible effect modifier may include a genetic predisposition for depression. BEs that are
associated with increases in depression may be associated with the worst cognitive functioning in those with genetic predisposition to depression. If the BE-cognition association relates to
cognitive stimulation/overload, plausible effect modifiers include having a physical or mental disability that would increase the difficulty of navigating and processing the neighborhood environment. Thus, the association between the BE and cognition may be modified by individual-level characteristics (i.e., “Person-Environment” fit84) and may also depend on the specific BE characteristic being measured. For example, while the association between condition of public spaces and cognition may increase with age, the association between traffic and noise and cognition may be more consistent across age groups.
case, living in neighborhoods in the worst conditions and with the lowest SES levels may be associated with the worse cognitive functioning. Among those in low SES neighborhoods, the presence of better neighborhood conditions may be associated with better cognition compared to those living in worse neighborhood conditions.
Comparison to other conceptual models. Various frameworks have been proposed to link BE exposures to health, including the frequently referenced socioecological model (SEM)85. The SEM is useful for considerations of multiple levels of influence on health outcomes, including the impact of urban planning policies and neighborhood characteristics. The SEM also
conceptualizes how the associations between higher-level factors such as the neighborhood environment and cognition vary by individual-level factors. However the SEM does not provide specific causal mechanisms by which the BE relates to cognition.
Other useful frameworks that include more specific causal mechanisms include those by Wells et al6 and Casserino & Setti67. The Wells et al model focuses on how specific planning decisions (i.e., nature and open space, urban form, food environment, housing) influence
multiple health outcomes. In contrast, the model by Casserino & Setti67 aims to explain potential associations between the physical environment and cognition, via the mechanisms of cognitive stimulation/overload, physical activity, and social engagement. Cassarino & Setti also
specifically discuss potential effect modifiers of the association between the physical environment and cognition. Thus while the Wells et al model is oriented around planning
decisions that influence various health outcomes, the Cassarino & Setti model is oriented around the causal mechanisms linking the environment and cognition.
one focused specifically on the BE and cognition. The BE characteristics that are included are those that are hypothesized to be associated with cognition, and inclusion of the BE
characteristics (e.g., land uses) and not planning decisions (e.g., zoning) orients the conceptual model around environmental exposures that are the result of planning decisions and policies but that can be more immediately measured by public health researchers. This kind of conceptual model can be used by both planners and public health researchers in considering the influence of the BE on cognition. Secondly, additional features are considered only in my conceptual model, such as environments promoting noise, design considerations such as aesthetics and condition of public spaces, and facilities for walking and bicycling. Thirdly, my model considers multiple aspects of cognition that may be affected by the BE, such as attention or visuospatial function. Fourthly, my model considers causal mechanisms beyond those included by Cassarino & Setti, specifically, air pollution exposure and quality of life. Lastly, my model denotes the importance of considering individual- and neighborhood-level effect modifiers of the BE-cognition
association.
1.7. Neighborhood built environment measures
Neighborhood features can be divided into either physical or social characteristics. Social characteristics include measures such as neighborhood demographics (e.g., age, race/ethnicity, SES), social connectedness of neighborhood residents, violence, safety, crime, and social disorder (e.g., graffiti and broken windows). Physical characteristics can include measures such as features of the pedestrian environment, aesthetics, availability of healthy food options, land use, and population density.
use in other MESA neighborhood studies by Ana Diez Roux and colleagues. The measures include proportion land dedicated to retail uses, proportion land dedicated to residential uses, intersection density, population density, density of social and walking destinations, and distance to nearest to bus and train stop.
Population density. Population density was calculated for ¼-mile, ½-mile, and 1-mile as-the-crow-flies buffers around the participants’ homes based on the 2000 and 2010 Census population density at the census block level. Assuming an equal distribution of the population per block, the population was calculated for each buffer zone. For my study, population density was measured as the number of persons per square kilometer in 2010 in a ½ mile radius around the participant’s home. The ¼ and 1-mile buffers were used in sensitivity analyses.
Proportion of land dedicated to retail uses. I used the proportion of the ½ mile buffer around the participants’ homes that is dedicated to retail. Land parcels for each of the study sites were classified as residential, retail, or commercial. Parcels dedicated to retail use were defined to include shopping centers, food stores, convenient stores, restaurants, bars/night clubs, clothing stores, mixed use buildings. The proportion of the area that is retail was calculated by dividing the retail area in meters square by the total area of the buffer in meters square. The ¼ and 1-mile buffers were used in sensitivity analyses. This measure was derived from administrative land use data at the city/county level.
area (in square meters) by the total area of the buffer (also in square meters). The ¼ and 1-mile buffers were used in sensitivity analyses. This measure was derived from administrative land use data at the city/county level. Because buildings can be more than one story, the area built may be greater than the buffer area and this measure can exceed 100%.
Distance to nearest bus line and train stop. The straight line distance to the nearest bus line and to the nearest train stop were calculated for MESA participants in which land use and public transit files were available.
Intersection density. Intersection density served as a measure of the connectivity of streets and was calculated by dividing intersection counts (all types [e.g., 3-way, 4-way] but excluding culs-de-sac and dead ends) in the buffer area by the total area of the buffer. The ½-mile buffer measure was used in the primary analysis and the ¼-½-mile and 1-½-mile buffers were used in sensitivity analyses. This measure was derived using StreetMap Premium 2012 data.
Density of social and walking destinations. The ½-mile density of social engagement destinations included the density per square mile of the following destinations divided by the buffer area: beauty shops and barbers, performance-based entertainment, participatory
Neighborhood SES. Neighborhood SES has been shown in some studies to be related to worse cognition, and is likely related to the physical characteristics of the neighborhood;
therefore it was controlled for in the analyses. A principal components analysis was conducted to derive a single measure of neighborhood SES, which was based on the percent of neighborhood residents with a bachelor’s degree, a high school degree, a managerial occupation, and an annual household income >$50,000, as well as the median home value, median household value, and percent rental income of the neighborhood. The neighborhood SES measure was based on the participant’s US census tract.
1.8. Cognitive measures
Neuropsychological tests are one means of evaluating cognitive functioning and decline, and are designed to measure global cognition as well as various cognitive domains.
Neuropathology of the brain, which can cause mild cognitive impairment and dementia, has been associated with patterns of cognitive impairment as detected by neuropsychological tests86, such as those used in MESA.
if a subject scores lower than a pre-established cutpoint, the subject would undergo further cognitive testing of affected cognitive domains, in addition to a more thorough clinical evaluation.
Measuring cognitive domains. More detailed cognitive evaluations assess whether there are impairments in specific cognitive domains, such as memory, language, attention, executive function, and visuospatial function. Clinicians can use information on affected cognitive domains to try to understand the underlying etiology of the cognitive impairment. For instance, knowing that a subject is impaired in the language domain and has no impairment in any other domains may help the clinician diagnose Primary Progressive Aphasia.
Over the years numerous tests have been developed to detect cognitive impairment.87 Typically, a subject’s score on a neuropsychological test would be compared to norms, which are expected test scores for subjects with normal cognition that are derived from testing a large sample of cognitively normal individuals. However, some studies use neuropsychological test scores to characterize individuals with a particular clinical or neuropathological diagnoses, or to compare individuals who differ in some key characteristic, such as age, sex, race, or an
environmental exposure (e.g., air pollution).
is a measure of processing speed. The Digit Span Test, a subtest of WAIS-III),89 is a measure of short term and working memory.
1.9. Contributions of dissertation study
As evidenced by the literature review by Wu et al, my dissertation study fills a large gap in the literature regarding associations between the neighborhood BE and cognition and whether the BE-cognition associations vary by individual-level factors. The Wu et al review article revealed only a single study by Clarke et al47 that examined neighborhood BE and cognition in
older adults. The Clarke et al study investigated whether the presence of recreational centers, institutions, and park area were associated with cognition as measured via the Modified Telephone Interview for Cognitive Status (TICS), a brief cognitive test. This same study
examined whether the association between the presence of institutional resources and cognition varied by individual-level race. The first aim of my dissertation study was to conduct a
systematic literature review to identify whether any additional studies beyond the Clarke et al article have examined the BE and cognition, as the BE was not a specific keyword searched in the Wu et al article. My literature review revealed five additional studies published on the neighborhood BE. In comparison to the six previously published studies, the second and third aims of my study examine associations between previously unexplored BE measures (i.e., intersection density, distance to the nearest bus/train stop, proportion land dedicated to retail or residential uses, social and walking destination density) and previously unexplored cognitive measures (i.e., CASI, Digit Span Forward and Backward, and Digit Symbol). In addition, my literature review revealed that one additional study by Magaziner et al examined effect
modifiers in my study have not been assessed in previous studies. Considering the extant literature to date, my study will uniquely contribute to the newly burgeoning research on the neighborhood BE and cognition in older adults.
Compared to the few similar studies conducted to date, my dissertation study is unique in a number of other ways. I am using a sample of diverse races/ethnicities, which allows for the consideration of how the BE affects vulnerable populations with a sufficient sample size of non-white races/ethnicities to detect significant associations. The MESA data originate from six US geographic sites, which provides evidence that BE-cognition associations are observed outside of the regions included in previous studies of the BE and cognition. Additionally, the MESA
Figure 1.1. Trend in publications on neighborhood characteristics and cognition in older adults, 2001-2012
0 1 2 3 4 5 6 7 8
2001-02 2003-04 2005-06 2007-08 2009-10 2011-12
Num
b
e
r
o
f
p
u
b
lica
tio
n
s
Year of publication
Figure 1.2. Conceptual model of the causal mechanisms linking the built environment and cognition
Bolded items are addressed in dissertation study
II. NEIGHBORHOOD ENVIRONMENT AND COGNITION IN OLDER ADULTS: A SYSTEMATIC REVIEW
2.1. Context
At least 10% of older adults (≥65 years) have mild cognitive impairment37 and
approximately 5 million Americans have Alzheimer’s disease dementia (AD)35, conditions that
will increase in incidence with the projected rise in population of older adults.16,17 To date, no
effective treatments are available to ameliorate or cure AD, the most common neurodegenerative cause of cognitive impairment. However, some research suggests that treating vascular risk factors and performing cognitively-stimulating activities may delay the onset of cognitive impairment41 and reduce AD pathology.42 Exposure to complex, stimulating neighborhood environments may be one mechanism that delays cognitive impairment.67
Recently, studies have started examining how the neighborhood social environment (SE) and built environment (BE) may affect cognition in older adults. The BE encompasses the physical aspects of living and work environments, including the placement and configuration of roads, homes, commercial buildings, and public spaces; whereas, the SE includes
human-centered characteristics, such as demographics, socioeconomic status (SES), social disorder, and social climate. A literature review of neighborhood environment and health in older adults91 found that neighborhood SES (NSES) was more frequently associated with health than
focused on community environment and cognition in older adults46, the authors also found that lower community SES was frequently associated with worse cognition.
The same mechanisms that link the neighborhood environment and physical activity, blood pressure, obesity, depression and quality of life4,20-23 may explain associations between the neighborhood environment and cognition. The mechanisms may relate to the neighborhood’s impact on personal mobility, one’s sense of security and safety, potential for chance interactions, exercise and social engagement, access to healthy foods and green space, and exposure to
pollution, crime, and social deprivation. For older adults, the neighborhood may become more important with increasingly less time in motorized transportation and more time in the
neighborhood.31 The neighborhood environment’s impact on health may be intensified by physical disability or difficulty navigating and interacting in the neighborhood due to normal cognitive aging.67 Additionally, the neighborhood may play a strong role in determining the
social ties and social participation among older adults74,75, which can affect psychological health and well-being.
Approximately 80% of the US population lived in urban areas in 201018 and over 90% of older adults would like to age in place, staying in their homes and neighborhoods for as long as possible.19 Compared to the SE, the BE is more directly targeted by urban planning efforts and
2.2. Evidence Acquisition
Neighborhoods were defined as geographic areas smaller than towns, cities, or counties and were delineated using administrative boundaries, circumscribed areas (e.g., ½-mile around home), or perceived geographic boundaries. The environment surrounding the home was chosen to represent the social and physical exposures likely to affect older adults frequently.
Neuropsychological tests are one means of evaluating cognitive functioning, and have been designed to measure global cognition as well as various cognitive domains (e.g., memory, language).86 In this review, cognition could have been determined by a clinician or assessed using brief cognitive measures such as the Mini Mental State Exam (MMSE) or domain-specific neuropsychological tests.
2.2.1. Search Criteria
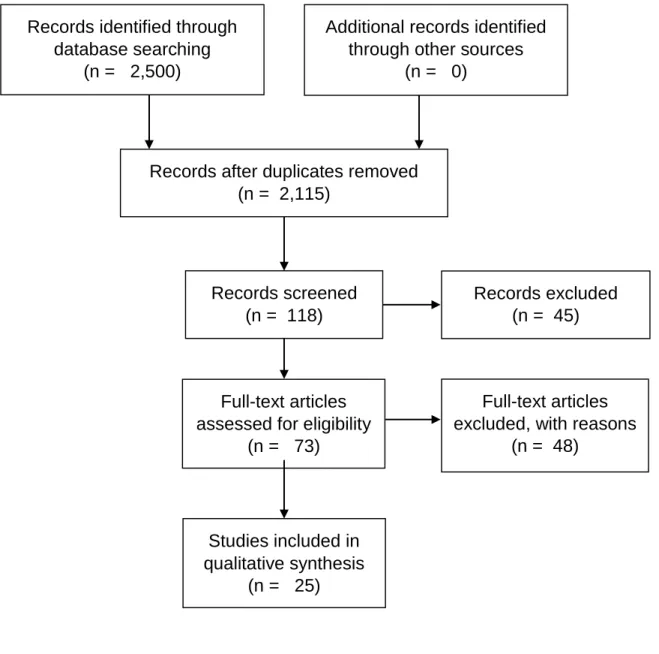
PubMed, Web of Science (all databases), and ProQuest Dissertation and Theses Global database were systematically reviewed for papers and dissertations published through March 5, 2016 (resulted in publications from February 1, 1989). The following keywords were searched: (built environment or neighborhood environment or neighborhood level or walkability) AND (cognition or cognitive function or cognitive decline or cognitive impairment or dementia or Alzheimer or Alzheimer’s or demented or cognitive or memory). Given these search criteria, results were likely to include studies of the BE, SE, or both. Papers were excluded if they were: not in English, not quantitative, or not focused on community-dwelling adults aged ≥45 years, neighborhood-level characteristics, and the neighborhood–cognition association.
2.2.2. Methods
support). The BE findings were grouped according to the ‘5Ds’ previously proposed to influence travel behavior93: Density (e.g., population density, density of social destinations), Diversity
(e.g., land use mix), Design (e.g., intersection density, presence of sidewalks), Destination accessibility (e.g., distance to nearest store), and Distance to transit (e.g., nearest bus stop). The ‘5D’ categories allow for a synthesis using terminology that is frequently used in neighborhood research and relatable to city planners. Data were synthesized between May 3, 2015 and October 7, 2016.
The studies were too disparate to evaluate whether they met the epidemiological criteria for causality. Instead, the risk of bias by participant selection, confounding of the neighborhood-cognition association, and missing data (all variables) was determined using the ROBINS-I tool94-96, which helped assess the strength of evidence to date. Additionally, six criteria were developed to evaluate the neighborhood measures (1. Did not provide validity/reliability; 2. Used ≥1 perceived measure; 3. Used ≥1 composite measure) and cognitive measures (1. Did not provide validity/reliability; 2. Used ≥1 composite measure; 3. No longitudinal measure used). Bias can occur if perceived measures of the neighborhood relate to cognition97 or if the neighborhood or cognitive measures are associated with measurement error98,99 (e.g., invalid measures100, composite measure101). Each domain (e.g., selection) was evaluated for risk of bias
(Low=1, Moderate=2, Serious=3, Critical=4), and overall risk of bias was calculated by a simple average of the domain scores.
2.3. Evidence Synthesis
≥65-year-olds (36% included <65-≥65-year-olds) and 80% included minorities. Appendices 2.2–2.6 outline study details.
2.3.1. Research Methods
Sixty-eight percent of samples originated from cohort studies, with the remaining based on clinical trials or other observational studies. Seventy-six percent of samples were population-based or randomly sampled. Eleven90,102,106,107,114,116,118-122 studies used the MMSE,
five47,74,92,109,112 used the Telephone Interview for Cognitive Status (TICS), five used
domain-specific cognitive measures108,111,113,117,120, and four used composite cognitive measures.103-105,110 Eighty-four percent of studies used continuous measures of cognition instead of
categorical/dichotomous measures, and 10 studies used longitudinal cognitive measures.103,105,109,112-116,120,121
Most studies focused on objective neighborhood measures, with only four90,103,104,114
including perceived measures (i.e., neighborhood social disorder, neighborhood climate, number of friendly neighbors, neighborhood homogeneity, distance to community resources). Almost half of the studies (n=12) used US Census tracts to define neighborhoods, with the remaining using US Census block groups, neighborhood perceptions, alternative definitions such as city-defined boundaries, or other regional definitions (e.g., UK enumeration district).
2.3.2. Neighborhood Social Characteristics and Cognition
Twenty-two studies examined the association between neighborhood SE and cognition.47,74,90,92,102-104,107-119,121,122
based on components such as the proportion with no high school degree or living in poverty. All SES measures were based on objective data sources such as the US Census.
Neighborhood demographics. Four of eight studies found that neighborhood demographics were associated with cognition (Table 2.1). Living in a neighborhood with a greater percent of 65+ year olds47 and fewer Hispanics107 or African Americans112 was associated with better cognition. Conversely, a greater percent of Mexican-Americans was associated with decreased odds of cognitive decline.116 Two112,116 of four longitudinal studies of neighborhood
race (African American, Hispanic, or minority) found a significant association with cognition. Perceived homogeneity of neighbor characteristics was not associated with cognitive decline in a Japanese sample.114
Psychosocial Disorder and Social Climate. Two103,111 of five studies (one cross-sectional, one longitudinal) found that greater psychosocial disorder was associated with worse cognition (Table 2.1). In two cross-sectional studies on social climate, positive acts of neighboring was associated with better cognition104, but perceptions of friendly neighbors or the number of children, relatives, and friends in the neighborhood was not associated with cognition.90 2.3.3. Neighborhood Built Environment and Cognition
Six studies examined neighborhood BE and cognition47,90,105,112,120,122, using a wide
variety of neighborhood definitions (i.e., city block, US Census tract, US Census block group, perceived neighborhood, ½ mile radius around home, UK Lower-layer Super Output Area) and data sources (i.e., block observations, city-based geographic data, audit, participant report, US Census, map data, United Kingdom neighborhood statistics).
Density. One122 of three cross-sectional studies examining density found an association
population density) was associated with worse cognition in an English sample122; however, increased neighborhood park area was not associated with cognition in a US-based sample.47 The
single study examining population density and cognition found no association.112
Design. Both studies of neighborhood design found an association with longitudinal measures of cognition (Table 2.2). Neighborhoods in poor condition (deterioration of public spaces) but not those lacking pedestrian facilities were associated with accelerated cognitive decline.105 Additionally, greater street connectivity was associated with faster cognitive decline
using one measure (fewer turns needed to reach all other streets in network) but slower cognitive decline using another (greater paths/streets connected to each street).120
Destination accessibility. Three studies (two cross-sectional, one longitudinal) examined the association between neighborhood destination accessibility and cognition (Table 2.2). An increased distance to community resources90 and presence of a community center105, but not
presence of recreational centers and institutions (e.g., schools)47, were associated with better cognition.
Diversityof Land Usesand Distance to Transit. Neighborhood diversity of land uses was associated with lower odds of dementia122, and the presence of a neighborhood transit stop was associated with slower cognitive decline105 (Table 2.2).
2.3.4. Effect Modification of Neighborhood Environment-Cognition Association Thirteen studies investigated effect modification47,74,90,92,102-104,106,108-111,118 of the association between neighborhood characteristics and cognition.
Four of five cross-sectional studies found that individual-level SES modified the
association between neighborhood SE and cognition.74,92,102,106,118 Having low personal SES and
contrast, two studies found that the association between NSES and cognition was strongest when personal SES did not match NSES (i.e., low personal SES, high NSES; high personal SES, low NSES).102,106 In addition, a higher percent of African Americans was cross-sectionally associated with worse cognition in those with lower education and better cognition in those with higher education.74
Three of six studies of the neighborhood SE and one study of the neighborhood BE found effect modification by individual-level demographics.47,74,104,109,110,118 Individual-level race was
not an effect modifier of the longitudinal association between neighborhood racial composition and cognition109 or the cross-sectional association between NSES and cognition.118 Sex did not modify the association between neighborhood social climate (e.g., social ties) and cognition.104 However, higher NSES was associated with better cognition among younger participants118 and in all but <70 year-old men110 in two cross-sectional studies. Finally, the presence of
institutional resources (e.g., community center) was cross-sectionally associated with better cognition among whites but worse cognition among African Americans.47
Both studies examining effect modification by apolipoprotein 4 carrier status (APOE 4; risk factor for AD) found significant associations.103,111 The first found that while APOE 4
genotype was associated with faster cognitive decline, the association was strongest when psychosocial disorder was low.103 The second, cross-sectional study found that APOE 4 carriers in the least psychosocially-hazardous neighborhoods had cognitive levels similar to APOE 4 non-carriers, and APOE 4 carriers in the most psychosocially hazardous
Three studies examined effect modification by other individual-level factors.47,90,108 Neighborhoods with a higher percent of older adults were associated with better cognition
among those living 6-10 years in their neighborhood but worse cognition among those living >10 years in their neighborhood.47 The association between community resources (e.g., number of children in neighborhood) and cognition did not differ among those who lived with others versus lived alone.90 Finally, the association between higher tibia lead levels and worse cognition was stronger in those with higher versus lower neighborhood psychosocial disorder.108
2.3.5. Risk of bias
Selection bias. Eight studies used sampling weights or propensity scores to reduce the risk of selection bias47,74,92,103,109-112, and 11 studies demonstrated a lack of overlap (by >2 years) between the dates in which the neighborhood and cognitive measures were
collected.74,92,103,105,107,108,110,112,115,116,121 Based on the ROBINS-I evaluation criteria, 19 studies
had a moderate risk and 6 studies had a moderate to serious risk of selection bias (Table 2.3).
Confounding. Ten studies controlled for covariates (i.e., age, sex, race/ethnicity, income, education, married) hypothesized to be related to neighborhood characteristics and cognitive measures, and therefore were determined to have a moderate risk of residual confounding (Table 2.3).47,74,92,105,109,111,112,116,118,119 The study with a critical risk for residual confounding did not
adjust for any covariates, and the 14 remaining studies with moderate-serious to serious risk did not adjust for at least one covariate.
Missing data. Twenty studies failed to delineate missing data on the neighborhood characteristics, cognitive measures, or covariates, and therefore were not assessed for risk due to missing data. Five studies92,102,116,118,121 used statistical methods or sensitivity analyses to account
few data were missing102 (Table 2.3). Three studies were determined to have low-moderate risk because some evidence suggested that the results were not robust to missing data.92,116,118 The
fifth study showed that the results were not robust to missing data, and was categorized as moderate risk.121
Neighborhood measures. Eight studies met ≤1 of the criteria developed to evaluate the
neighborhood measures (low risk of bias due to the neighborhood measure), 16 met two criteria (moderate risk), and one90 met all three criteria (serious risk) (Table 2.3).
Cognitive measures. Eleven papers met ≤1 of the criteria developed to evaluate the
cognitive measures (low risk of bias due to the cognition measure), 12 met two criteria (moderate risk), and two 110,111 met all three criteria (serious risk).
2.4. Discussion
Over half of the 25 reviewed studies found associations between neighborhood
associations that increased the chance of a statistically significant finding. Additionally, the combinations of neighborhood measures examined were inconsistent across the studies, and thus did not allow for a more thorough critique. Therefore, the evidence for an association between neighborhood characteristics and cognition is modest to date.
Lower NSES was associated with worse cognition after controlling for personal SES, a strong predictor of mortality and AD risk.123,124 NSES has been associated with multiple health outcomes125-127 and may be independently associated with cognition by affecting an individual’s
social interactions and level of social isolation128,129, which indirectly affect health. Few longitudinal studies found significant associations; thus, it is possible that NSES is associated with life-long disparities in cognition but not late-life differences in cognitive decline.
Nonetheless, social isolation is a plausible mechanism for the observed associations between lower NSES and worse cognition, and should be examined as a potential mediator in future studies.
Controlling for individual- and neighborhood-level SES and race may not fully account for the psychosocial impact of racism and segregation that can influence health.74,130 Only 27% of the reviewed studies examining NSES controlled for neighborhood racial composition, and therefore, future studies will need to develop valid measures of and control for segregation, which may be independently associated with worse cognition.
Having lower personal SES and living in higher SES neighborhoods may cause social isolation, leading to poorer well-being and health consistent with the ‘local social inequality model’106,131. In contrast, low SES individuals who have better cognition when living in higher
model’74,92 and two supported the ‘local social inequality model’102,106; thus, there is insufficient
evidence to conclude if either of these models are at play, and additional research is needed on the interaction between individual- and neighborhood-level SES.
The reviewed studies demonstrated inconsistent associations between neighborhood psychosocial hazards and cognition. The only longitudinal study found a significant association with cognitive decline, but it used perceived measures to construct a composite measure of neighborhood psychosocial hazards. Perceived measures represent individual-based assessments that may be laden with other subjective influences, and composite measures can be associated with measurement error and lack specificity, which hinders the ability to pinpoint the causal mechanisms. The remaining studies were cross-sectional and used different objective measures of neighborhood psychosocial hazards. Overall, future studies of psychosocial hazards and cognition would benefit from using longitudinal measures of cognition and psychosocial hazard measures that are objective and measured individually. Additionally, future studies could
examine potential mediators such as social engagement, isolation, well-being, and mental health, which would help support a mechanism by which any observed associations can be explained by social engagement/isolation.
association between neighborhood design and destination accessibility and cognition. However, given this nascent field of research, new studies are needed to refine the BE and neighborhood measures, examine longitudinal measures of cognition, examine potential mediators and moderators, and elucidate the associated causal mechanisms.
2.4.1. Quality of studies
The majority of studies were at moderate to serious risk of bias due to selection, residual confounding, and missing data. New studies should use methods such as sampling weights or propensity scores to reduce selection bias and use techniques such as multiple imputation to address bias due to missing data. Additionally, future studies should effectively measure and control for individual characteristics that are likely associated with the neighborhood
characteristics and cognition to reduce the possibility of residual confounding, which may help explain the studies finding associations in unexpected directions.
Most of the studies defined neighborhoods using administrative boundaries set by national or local governments (e.g., US Census tracts). Although this may allow for more consistent neighborhood definitions across studies, Census tracts are typically employed out of convenience, which ignores the potential that different neighborhood definitions may be more appropriate based on the neighborhood measure of interest and the proposed biological