COMBINED EFFECTS OF OCEAN ACIDIFICATION AND WARMING ON
CALCIFICATION RATE AND SKELETAL MORPHOLOGY OF THE CARIBBEAN REEF-BUILDING CORAL SIDERASTREA SIDEREA
Kimmaree Menéndez Horvath
A thesis submitted to the faculty of the University of North Carolina at Chapel Hill in partial fulfillment of the requirements for the degree of Master of Science in the Department of Marine
Sciences.
Chapel Hill 2014
ii © 2014
iii ABSTRACT
Kimmaree Menéndez Horvath: Combined effects of ocean acidification and warming on calcification rate and skeletal morphology of the Caribbean reef-building coral Siderastrea
siderea
(Under the direction of Justin Ries)
Atmospheric pCO2 is predicted to rise from 400 to 900 ppm by year 2100, causing
seawater temperatures to increase by 1-4 °C and pH to decrease by 0.1-0.3. Sixty-day experiments were conducted to investigate the independent and combined impacts of
acidification (pCO2=425/915 ppm) and warming (T=28/32 °C) on calcification rate and skeletal
iv
ACKNOWLEDGEMENTS
This work was support by the NSF Graduate Research Fellowship DGE-1144081, NOAA awards NA11OAR431016 and NA13OAR4310186, and NSF awards 1031995 and OCE-1357665.
Pualani Armstrong is acknowledged for assistance with microscopic imaging of coral skeletons. Travis Courtney is acknowledged for assistance with statistical analyses. Isaac Westfield and Brian Connolly are acknowledged for assistance with analysis of water chemistry. Maite Ghazaleh, Elaine Chow, Kruti Patel, and Blake Elder are acknowledged for assistance with the coral culturing experiments.
To my committee, Justin Ries, Karl Castillo and Adrian Marchetti: I am indebted to you for your guidance and trust in me as a graduate student and scientist. I am truly fortunate to have had the opportunity to learn from you all.
To my family, Chris, Alexander, and Amelia: life as a wife, a mother, and a graduate student is anything but easy. It would not have been possible without your unconditional support, boundless love, and unwavering belief in my dreams. I hope to provide the same in helping you all to follow your own.
v
TABLE OF CONTENTS
LIST OF FIGURES ... vii
LIST OF TABLES ... viii
1. INTRODUCTION ...1
2. MATERIALS AND METHODS ...7
2.1 Collection and acclimation ...7
2.2 Aquarium conditions ...7
2.3 Experimental conditions ...9
2.4 Measured parameters ...9
2.5 Calculated parameters ...10
2.6 Estimation of coral bleaching ...10
2.7 Estimation of coral calcification rate ...11
2.8 Photomicroscopic sample preparation...12
2.9 Measurement of corallite height ...12
2.10 Measurement of septal infilling of the corallite ...13
2.11 Statistical analysis ...14
3. EFFECT OF TEMPERATURE AND pCO2 ON CALCIFICATION RATE ...16
3.1 Results ...16
3.1.1 Effect of temperature on calcification rate ...16
3.1.2 Effect of pCO2 on calcification rate ...16
vi
3.1.4 Effects of temperature and pCO2 on calcification rate ...17
3.1.5 Model building ...18
3.2 Discussion ...18
4. EFFECT OF EXPERIMENTAL DURATION ON CALCIFICATION RESPONSE TO TEMPERATURE AND pCO2 ...23
4.1 Results ...23
4.1.1 Effect of exposure duration ...23
4.1.2 Model building ...23
4.2 Discussion ...24
5. EFFECT OF TEMPERATURE AND pCO2 ON CORALLITE MORPHOLOGY ...28
5.1 Results ...28
5.1.1 Impact of temperature on corallite height ...28
5.1.2 Impact of pCO2 on corallite height ...28
5.1.3 Impact of temperature on corallite infilling...29
5.1.4 Impact of pCO2 on corallite infilling ...29
5.1.5 Model building ...30
5.2 Discussion ...30
6. CONCLUSION ...34
FIGURES ...38
TABLES ...51
vii
LIST OF FIGURES
1: Plot of final buoyant weight vs. final dry weight for experimental S. siderea corals ...38
2: Manipulation of S. siderea corallite photomicrographs in ImageJ for evaluation of septal infilling ...39
3: Average calcification rates for S. siderea at four crossed temperature-pCO2 treatments ...40
4: Average calcification rates of S. siderea coral specimens by reefzone ...41
5: Final saturation and brightness values for S. siderea specimens at four crossed temperature-pCO2 treatments...43
6: Average calcification rate for bleached and unbleached specimens of S. siderea ...44
7: Percent-decrease in calcification rates amongst S. siderea coral ...45
8: Average calcification rates for S. siderea coral by growth interval ...46
9: Average corallite heights for S. siderea corals at four crossed temperature-pCO2 treatments...47
10: Percent-corallite infilling for S. siderea corals at four crossed temperature-pCO2 treatments ...48
11: Structure of a corallite ...49
viii
LIST OF TABLES
1: Summary of recent studies investigating the effects of ocean acidification on
scleractinian coral calcification ...51
2: Summary of average calculated and measured parameters for the temperature and pCO2 treatments ...51
3: Detailed weight and surface area data for S. siderea ...53
4: Detailed average corallite height measurements for selected S. siderea ...58
5: Summary of hierarchical linear mixed effects models ...59
6: Summary of p-values and AIC output for each of the 20 hierarchical linear mixed effects models evaluated ...61
1
1. INTRODUCTION
In May of 2013, the observatory at Mauna Loa recorded a weekly average atmospheric pCO2 of 400.01 ppm-v (Tans and Keeling, 2013) – the highest recorded pCO2 in human history.
This represents a 43% increase in atmospheric pCO2 since preindustrial time, where levels were
ca. 270-280 ppm-v (Keeling, 1960; Neftel et al., 1985; Rahmstorf et al., 2007; Keeling et al., 2009; Etheridge et al., 2012). This increase is primarily the result of the anthropogenic combustion of fossil fuels, deforestation, and cement production (Keeling, 1960; Neftel et al., 1985; Worrell et al., 2001; IPCC, 2007; Rahmstorf et al., 2007; Keeling et al., 2009). The current pCO2 level is the highest that the Earth has experienced in the last 800,000 years (Luthi
et al., 2008; Kump et al., 2009).
The Intergovernmental Panel on Climate Change (IPCC) predicts that atmospheric pCO2
will continue to increase to between 550 and 950 ppm-v by the end of the 21st century. This is projected to cause sea surface temperatures to rise by 1 to 4 °C (IPCC, 2007b; Eakin et al., 2008; Donner, 2009). The relationship between seawater temperature and calcification rates of
scleractinian corals is relatively well established. Rates generally increase up to a coral’s thermal optimum, which typically coincides with the coral’s average summertime seawater temperature (Coles and Jokiel, 1977). Above this optimum, rates begin to decline due to bleaching (Hoegh-Guldberg, 1999; Hoegh-Guldberg et al., 2007; Castillo et al., 2014).
2
temperature of 32 °C, and that continued exposure to a temperature of just 30 °C caused
bleaching, reduced coral calcification rates, and increased coral mortality. A similar experiment by Glynn and D’Croz (1990) showed that colonies of Pocillopora damicornis exposed to temperatures above 30 °C resulted in decreased coral fitness and eventual death. As tropical corals are already encroaching upon the thermal limit during the warmest summer months, the rise in surface seawater temperature that is predicted for the end of this century could result in more frequent bleaching events and subsequent reductions in rates of coral calcification.
This conclusion is supported by the results of several coral-coring studies, such as the one by Tanzil et al. (2009) which found that the skeletal extension of Porites lutea has declined by approximately 23.5% from 1984 to 2005 and that linear extension rate was inversely correlated with seawater temperature. Additional coring studies report that coral growth declines with increasing seawater temperature (Dodge and Lang, 1983; Cooper et al., 2007; De’ath et al., 2009; Cantin et al., 2010). Castillo et al. (2012) determined that linear extension rates of
forereef colonies of S. siderea on southern portions of the Belize Barrier Reef have declined with the past ca. 30 years of warming, while colonies from backreef and nearshore environments of the reef have remained stable. Carilli et al. (2009) showed that the negative impact of thermal stress on rates of skeletal growth for corals off the coasts of Belize and Honduras is exacerbated by local anthropogenic stressors, such as over-fishing, pollution, and coastal development.
3
Rising atmospheric pCO2 has also caused a 0.1 unit decline in seawater pH since the
Industrial Revolution, with an additional 0.1-0.3 unit decrease predicted for the end of this century (Caldera and Wickett, 2003; Orr et al., 2005; Raven et al., 2005). As atmospheric CO2
dissolves in seawater, it forms carbonic acid (H2CO3), which dissociates into bicarbonate (HCO3
-) and hydrogen ions (H+), resulting in a decrease in seawater pH and available carbonate ions (CO32-) (Zeebe & Wolf-Gladrow, 2001). The decreased CO32-concentration ([CO32-]) causes a
reduction in the saturation state of seawater with respect to the aragonite mineral (ΩA) from
which corals build their skeletons. In many cases, this has been shown to impair the ability of scleractinian corals (Gattuso et al., 1998; Leclercq et al., 2002; Langdon and Atkinson, 2005; Schneider and Erez, 2006; Jokiel et al., 2008; Ries et al., 2010; Crook et al., 2013; Castillo et al., 2014) as well as other types of marine calcifiers (e.g., Langdon, 2002; Kleypas et al.,2006; Hoegh-Guldberg et al., 2007; Fabry et al., 2008; Doney et al., 2009; Ries et al., 2009) to form their calcareous skeletons.
The effect of ocean acidification on scleractinian coral calcification has been explored in a number of recent studies, with results varying by species as well as by experimental design (Table 1). In a controlled laboratory, Krief et al. (2010) showed that although the calcification rate of massive Porites sp. and Stylophora pistillata declined with decreasing seawater pH, specimens in all treatments survived and continued to accrete new skeleton. Ries et al. (2010) found that the temperate coral, Oculina arbuscula, exhibited a non-linear negative response to elevated pCO2, with no change in either rate of net calcification or linear extension from 409
ppm-v to 903 ppm-v, but a severe decline in both at 2,856 ppm-v—the only treatment that was undersaturated with respect to aragonite (ΩA < 1). Nevertheless, corals were able to continue
4
ppm-v). Similarly, an experimental study by Castillo et al. (2014) exposed the tropical scleractinian coral, Siderastrea siderea (same species investigated in the present study) to pre-industrial (324 ppm-v), near-present-day (477 ppm-v), elevated (604 ppm-v), and extremely elevated (2553 ppm-v) levels of pCO2. They found that the response of S. siderea to CO2
-induced ocean acidification was parabolic in shape, with moderate elevations in pCO2 (324-604
ppm-v) causing an increase in calcification rates and extreme elevations (604-2553 ppm-v) causing a decrease in calcification rates. As with Krief et al. (2010) and Ries et al. (2010), Castillo et al. (2014) found that even in seawater that was undersaturated with respect to the aragonite mineral (ΩA < 1), corals were able to continue accreting new skeletal material
throughout the 95-day experiment.
In contrast, a field experiment conducted by Crook et al. (2013) concluded that the Caribbean reef-building coral, Porites astreoides, was unable to acclimate to reduced ΩA. They
predicted that by the year 2065, calcification rates of P. astreoides will have declined by ca. 15% since the Industrial Revolution. Their findings are consistent with a 4-year mesocosm study that showed a reef-wide linear decrease in calcification rate with decreasing saturation state (Langdon et al., 2000).
Although the impacts of ocean acidification and warming on reef-building corals have been explored, few studies have investigated the combined effects of these stressors on tropical scleractinian coral calcification. Muehllehner and Edmunds (2008) investigated the interactive effects of increased sea surface temperature and pCO2 on two species of tropical scleractinian
5
pH of 7.8 and elevated temperature (29 °C) remained largely unchanged. The authors
acknowledged, however, that the elevated temperature achieved in the study may not have been high enough to exceed the thermal maximum for these species. In a combined field and
laboratory experiment, Rodolfo-Metalpa et al. (2011) observed that corals lost the ability to calcify on a net basis in waters undersaturated with respect to ΩA under elevated temperatures
(28.5 °C). As both ocean warming and acidification are predicted for the coming centuries, it is important to constrain the combined effects of these two CO2-induced stressors on coral
calcification.
Equally important to understanding the effect of ocean acidification and increased sea surface temperatures on calcification rate is the impact that these stressors will have on coral skeletal development. Although many studies have investigated the rate of calcification for scleractinian corals under elevated temperature and reduced pH, few have quantified the morphological impact that these individual stressors have on coral skeletal morphology. None have investigated the combined effects of warming and acidification on coral morphology.
One such study by Cohen et al. (2009) assessed microscopic scale changes to aragonite crystal formation in new recruits of Favium fragum in response to elevated seawater pCO2.
Researchers found that juvenile coral exposed to reduced ΩA caused by a reduction in seawater
pH experienced delayed onset of skeletal development and decreased rates of calcification. Systematic changes to the primary morphology of the precipitated aragonite crystals was also observed: the long, thin blades of densely packed aragonite crystals precipitated under normal conditions were replaced by shorter and thicker crystals arranged in loose bundles formed in waters undersaturated in respect to ΩA. Their findings were consistent with the results of a study
6
aragonites precipitated in artificial seawater of differing pH. This study found that both the micro- and nano-scale morphology of the crystals changed systematically according to the saturation state and pH of the fluid in which they grew. At normal pH, fine, closed spherulites composed of densely packed bundles of long and blade-like crystals formed, while open and coarse spherulites comprised of short and wide aragonite crystals precipitated at low pH. The present study differs from the Cohen study (2009) investigating the effects of seawater pH on skeletal morphology in that the present study (1) investigates the combined effects of increased pCO2 and temperature on coral skeletal morphology, (2) assesses impacts on the corallites of
adult coral polyps, and (3) is conducted over relatively long timescales (60 d) that permit evaluation of potential acclimatization to the prescribed stressors.
Here, we present the results of 60-day experiments designed to assess the individual and combined effects of IPCC-predicted end-of-century ocean acidification (pCO2 = 425, 915
ppm-v) and warming (28, 32 °C) on the calcification rate and skeletal morphology of the tropical reef-building scleractinian coral Siderastrea siderea–an abundant and widespread reef-builder
7
2. Materials and Methods
2.1 Collection and acclimation
Eighteen colonies of S. siderea were collected via SCUBA along the Mesoamerican Barrier Reef System (MBRS), approximately 40 km west of the Belize coast, within the Sapodilla Cayes Marine Reserve (16° 06′ 09′′ N–88° 16′ 20′′ W and 16° 07′ 00′′ N– 88° 16′ 01′′ W) in June 2011, in accordance with local, federal, and international regulations. Large (20-30 yr.) S. siderea colonies were selected randomly from 4-5 m deep waters of the nearshore (NS), backreef (BR) and forereef (FR) environments of the MBRS. Colonies were collected at a minimum of 0.5 km apart in order to maximize genotypic variability.
Siderastrea siderea colonies were wrapped in sea-water-moistened paper towels and transported by airplane to the University of North Carolina at Chapel Hill, where they were cut into ca. 2 cm x 2 cm fragments with a seawater-cooled petrographic trim saw. Individual coral fragments were affixed with cyanoacrylate to acrylic slides and given a unique ID. Fragments were then placed in a 500 L saltwater aquarium system for 30 days to allow for recovery and acclimation to laboratory conditions prior to the start of the experiment.
2.2 Aquarium conditions
Four experimental treatments of two seawater temperatures (ca. 28, 32 °C) crossed with two pCO2 levels(ca. 425 ppm-v, 915 ppm-v) were established. The two temperatures were
8
ppm-v) and a predicted end-of-century level (ca. 915 ppm-v). Each of the four treatments was maintained in triplicate 38 L glass aquaria (12 total).
Twelve similarly sized S. siderea fragments obtained from coral colonies equitably distributed amongst the three reef zones were transferred to each of the 12 aquaria (144 total fragments). Corals were acclimatized to experimental growth conditions for fourteen days. The temperature of the seawater in the nominal 32°C treatments was incrementally adjusted from 28 °C to 32 °C over the 14 day period to minimize thermal shock to the corals.
Corals were reared in experimental seawater prepared from deionized water and Instant Ocean Sea Salt at a salinity of 35.10 ±0.02. Although the trace elemental composition of Instant Ocean Sea Salt differs subtly from that of natural seawater, its major and minor elemental composition, as well as its carbonate chemistry, was the most similar to that of natural seawater when compared with eight other commercial sea salt mixes (Atkinson and Bingman, 1998). Seventy percent water changes were performed approximately every 10 days with ca. 35 ppt artificial seawater,and deionized water was added as needed to replenish water lost through evaporation. Water changes for all tanks were performed from a 2000 liter batch of artificial seawater to normalize any potential differences in the composition of the artificial sea salt batches.
9
Aquaria were illuminated with a timer-controlled 4-stage daily light cycle in order to mimic reef-conditions: 12 hours dark (no light) – 1.5 hours dawn (ultra-actinic-blue light) – 10 hours daylight (ultra-actinic-blue light + 96 Watt 10,000K white light + 32 Watt 6500K
fluorescent light) – 1.5 hours dusk (ultra-actinic-blue light). The maximum photosynthetically active radiation (PAR) of the daily light cycles was ca. 250 µmol photons m-2 s-1. Each coral fragment was fed approximately 1.25 g (wet-weight) Artemia sp. twice weekly via a 1-ml graduated transfer pipette. Artemia sp. were evenly distributed across the surface of each coral fragment.
2.3 Experimental conditions
Seawater temperatures (28.1 ± 0.1 °C and 31.9 ±0.1 °C at ca. 425 ppm-v pCO2; 28.0 ±0.1
°C and 31.8 ±0.1 °C at ca. 915ppm-v pCO2) were maintained with 50 W submersible aquarium
heaters affixed to the side of each aquarium, which were calibrated with NIST-traceable glass thermometers.
Aalborg digital solenoid-valve mass flow controllers were used to blend compressed CO2
gas with compressed air to achieve gas mixtures with pCO2 levels consistent with the beginning
and predicted-end of the 21st century (IPCC, 2007): 426 ±11 ppm-v and 888 ±14 ppm-v at ca. 28 °C; 424 ±10 ppm-v and 940 ±10 at ca. 32 °C (Table 2). These gas mixtures were delivered to the aquaria via micro-porous ceramic gas bubblers.
2.4 Measured parameters
10
calibrated with seawater standards of known salinity supplied by the laboratory of Prof. A. Dickson of Scripps Institute of Oceanography. Aquaria pH readings were taken with an Orion benchtop pH meter and an Orion Ross pH electrode calibrated with 7.00 and 10.01 certified NBS buffers traceable to NIST standard reference material (for slope of the calibration curve) and with seawater standards of known pH provided by the laboratory of Prof. A. Dickson of Scripps Institute of Oceanography (for y-intercept of the calibration curve).
Approximately 250 ml seawater samples were collected weekly from experimental aquaria in accordance with accepted best practices (Riebesell et al., 2010). These samples were analyzed for dissolved inorganic carbon (DIC) and total alkalinity (TA) on a MARIANDA corporation VINDTA 3C. Seawater DIC was measured via coulometry (UIC 5400) and TA was measured via closed-cell potentiometric titration (Table 2).
2.5 Calculated parameters
Seawater pCO2, pH, carbonate ion concentration ([CO32-]), bicarbonate ion concentration
([HCO3-]), aqueous CO2, and aragonite saturation state (ΩA) were calculated with the program
CO2SYS (Lewis & Wallace, 1998), using Roy et al. (1993){Roy, 1993 #125} values for the K1
and K2 carbonic acid constants, the Mucci (1983){Mucci, 1983 #126} value for the
stoichiometric aragonite solubility product, and an atmospheric pressure of 1.015 atm (Table 2). 2.6 Estimation of coral bleaching
11
to a stand, with identical illumination levels, camera settings, and working distances. An observer based reference card (Coral Watch Coral Health Chart, University of Queensland) was used to determine the hue and saturation/brightness value of each specimen by visual comparison of the specimen to the chart. Saturation/brightness values ranged from 6 (maximum
saturation/brightness) to 1 (complete loss of pigmentation) on the reference card. The occurrence of bleaching in a given specimen was assessed by comparing the specimen’s
observed saturation/brightness value between the beginning and end of the experiment (Siebeck et al., 2006). Bleaching was considered to have occurred when a decrease in
saturation/brightness value of two or more units was observed. 2.7 Estimation of coral calcification rate
Rate of coral calcification was estimated via the buoyant weight method (see detailed methods in the online supplement to Ries et al., 2009). Weights were recorded at the beginning, middle, and end of the experiment by suspending coral fragments from an aluminum wire affixed to a Cole Parmer bottom-loading scale at a depth of ca. 10 cm in experimental seawater maintained at 25 °C and 33 ppt (Table 3). An object of known weight was intermittently weighed to verify consistency of the buoyant weighing method throughout the duration of the experiment.
The buoyant weight-dry weight relationship for the coral S. siderea was empirically derived by plotting the final dry weights against the final buoyant weights of all coral specimens (Fig. 1 a-b). Final buoyant and dry weights of coral specimens from each of the two sets of pCO2 treatments (pCO2 = 425 ppm-v at 28 and 32 ºC; pCO2 = 915 ppm-v at 28 and 32 ºC) were
12
indicating that linear equations could be used to convert buoyant weight to dry weight for the purposes of estimating calcification rates:
425 ppm-v: Dry weight (mg) = 1579.7 (Buoyant weight) + 917.8 915 ppm-v: Dry weight (mg) = 1606.7 (Buoyant weight) + 528.0 Net calcification rates were normalized to coral fragment surface area (Table 3) and observational interval and expressed as mg (dry weight) cm-2 d-1.
2.8 Photomicroscopic sample preparation
Representative numbers of coral specimens from all replicates of the four treatments were chosen to be cut and bleached in preparation for morphological analysis via photomicroscopy. Specimens with a minimum of ten suitable corallites were selected and sawed in half with an ethanol-cooled petrographic trim saw. Cut halves were then rinsed in ethanol and air dried. Once dry, one half from each cut specimen was stored for subsequent analysis. The remaining half was then soaked for three hours in an 8.25% sodium hypochlorite solution to remove any organic residue that could obscure corallite morphology. Samples were given a final rinse with ethanol and air dried.
2.9 Measurement of corallite height
13
corallites per specimen, 7 specimens per replicate, and 21 specimens per treatment were needed to obtain a normal distribution of data.
2.10 Measurement of septal infilling of the corallite
The percentage of septal infilling of the corallite was quantified via automated gray-scale image analysis of fully-focused top-down images of single corallites. Fully focused images of the corallites were obtained using a Nikon SMZ1500 microscope fit with an automated z-stage system, a Nikon Digital Sight DS-Ri1 camera, and NIS Elements image processing software. Images were captured using auto exposure (AE) and Auto White Balance (AWB) acquisition settings. Stage and room illumination were kept constant. The imaging software then aligned the focused portions of the separate images into a single fully focused image (Fig. 2a). This fully focused image was then imported into the image processing software program ImageJ and
14 2.11 Statistical analyses
Hierarchical linear mixed-effects models were utilized to fit this two-way factorial experiment with split-plot design to assess the additive and interactive effects of pCO2 and
temperature on the calcification rate, corallite height, and corallite infilling of S. siderea over the ca. 60-day experiment. Tanks represent plots, temperature and pCO2 represent whole-plot
treatments, and reef zones and coral colonies represent split-plot treatments. Random effects at the colony level were employed to account for variable coral specimen genotype, and random effects at the tank level were utilized to assess potential ‘tank- effects’ on the calcification response of each coral specimen. In this design, the random effects of tank and colony were therefore crossed and nested within the fixed effects of temperature, pCO2, and reef zone. Five
fixed effects models testing the additive and interactive effects of temperature, pCO2, and reef
zone were examined with the crossed random effects of tank and colony randomized at different levels of the model for a total of 20 models (Table 5).
15
16
3. EFFECT OF TEMPERATURE AND pCO2 ON CALCIFICATION RATE
3.1 Results
3.1.1 Effect of temperature on calcification rate
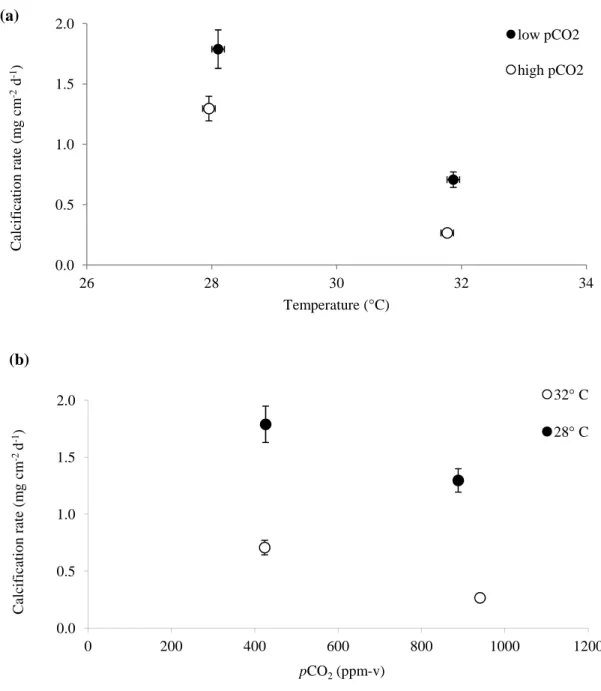
Coral specimens under all temperature treatments continued to calcify on a net basis throughout the experiment, with calcification rates declining from the 28 °C to 32 °C treatments under both the normal and elevated pCO2 conditions (Fig. 3a). In the low pCO2 treatments,
average calcification rates (±SE) decreased from 1.79 mg cm-2 d-1 (±0.16) to 0.71 mg cm-2 d-1 (±0.06) in the 28.1 °C (426 ppm-v) and 31.9 °C (424 ppm-v) treatments, respectively. In the high pCO2 treatments, average calcification rates (±SE) decreased from 1.30 mg cm-2 d-1 (±0.10)
to 0.27 mg cm-2 d-1 (±0.02) in the 28.0 °C (888 ppm-v) and 31.8 °C (940 ppm-v) treatments, respectively. Linear mixed effects modelling (Tables 5, 6) that controlled for the random effects of tank and colony revealed that temperature was a significant (p = 0.0008) predictor of
calcification rate over the 60-day duration of the experiment (Table 7). 3.1.2 Effect of pCO2 on calcification rate
Coral specimens under all pCO2 treatments continued to calcify on a net basis throughout
the experiment, with calcification rates declining from the control to the elevated pCO2
17
mixed effects modelling (Tables 5, 6) that controlled for the random effects of tank and colony revealed that pCO2 was a significant (p = 0.04) predictor of calcification rate over the 60-day
duration of the experiment (Table 7).
3.1.3 Effect of reef zone on calcification response to temperature and pCO2
Calcification rates of the experimental corals were evaluated from the three reef zones (nearshore, backreef, forereef) within each of the temperature-pCO2 treatments (Fig. 4). The
nearshore corals calcified faster than the forereef corals in the high pCO2/28 °C treatment (p <
0.008; Fig. 4c). Those for the other reef zone/temperature/pCO2 comparisons were not
statistically significantly different (p > 0.05; Figs. 4a, b, d). Across all treatments, linear mixed effects modelling (Tables 5, 6) that controlled for the random effects of tank and colony revealed that reef zone was not a significant (p > 0.05) predictor of calcification rate over the 60-day duration of the experiment.
3.1.4 Effects of temperature and pCO2 on bleaching
Coral bleaching, estimated here as a decrease in coral brightness and saturation (Siebeck et al.¸ 2006), was observed in the high temperature treatments (ca. 32 °C) at both 425 ppm-v and 915 ppm-v pCO2 (Fig. 5). Sixty-four percent of corals reared at elevated temperature and normal
pCO2 exhibited some degree of bleaching, with 25% of specimens bleaching completely.
Seventy-five percent of the specimens showed evidence of decreased brightness and saturation in the elevated temperature and elevated pCO2 treatment, with 28% displaying a total loss of
pigment. No bleaching was observed in corals exposed to average summertime temperatures (ca. 28 °C) for both the control and elevated pCO2 treatments (Fig. 5).
18
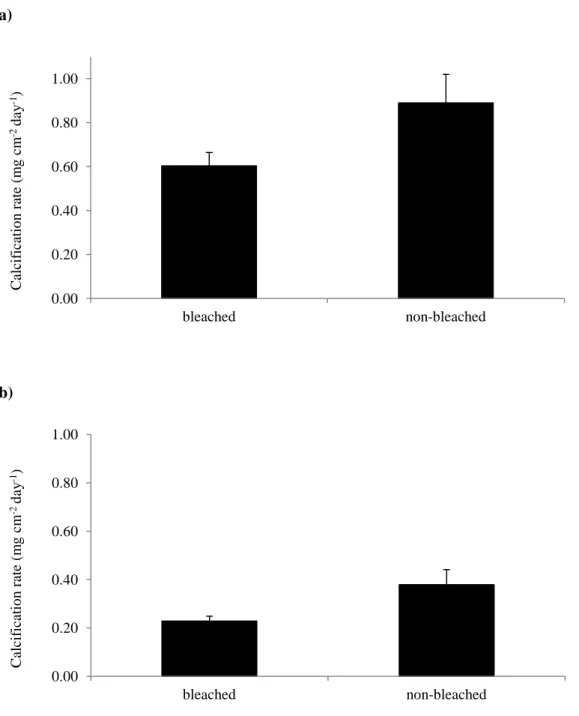
bleached specimens under both the near-present-day and end of century pCO2 treatments.
Average calcification rates (±SE) decreased from 0.89 mg cm-2 d-1 (±0.13) to 0.60 mg cm-2 d-1 (±0.06) in the 424 ppm-v (31.9 °C) treatment and from 0.38 mg cm-2 d-1 (±0.06) to 0.23 mg cm-2 d-1 (±0.02) in the 940 ppm-v (31.8 °C) treatments (Fig. 6).
3.1.5 Model building
Linear mixed effects modelling (Tables 5, 6) that controlled for the random effects of tank and colony identified the temperature and pCO2 model with random slopes for tank and
colony (model 16; Table 7) to be the AIC-best fit model with the greatest number of significant predictors of calcification rate. The interactive effects of temperature and pCO2 were not found
to be significant, nor were the effects of reef-zone.
The following predictive equations were generated from the coefficients and intercepts of the best-fit linear mixed effects models identified in Table 7:
Calcification rate (0-60 d; mg cm-2 d-1) = -0.27(±0.06) * T(°C) – 0.001(±0.0004) * pCO2(ppm-v)
+ 9.73(±1.63) 3.2 Discussion
Coral calcification rates were significantly (p < 0.05) lower in the 32 °C treatments than in the 28 °C treatments for both the near-present-day and the high-pCO2 treatments (Fig. 3a) and
19
(Barnes and Hughes, 1999; Donner, 2009). Coral calcification is an energy intensive process (Cohen and McConnaughey, 2003; Ries, 2011) that requires energy provided by these symbiotic zooxanthellae in the form of translocated photosynthate. Thus, a decline in zooxanthellate abundance in the coral tissue should translate to a decline in available energy and thus a decline in calcification rate. Notably, coral bleaching resulted in significant (p < 0.05) decrease in average calcification rates within the high temperature treatments. Coral fragments reared at 32 °C under the near-present-day pCO2 treatments that bleached experienced a thirty-two percent
decline in average calcification rate as compared to those that did not (Fig. 6a). At high temperature and elevated pCO2, the average calcification rate of bleached corals dropped by
forty percent (Fig. 6b). The decline in coral calcification rate under the high-temperature conditions likely resulted from the bleaching that occurred under these conditions (Fig. 3a).
Coral calcification rates were also significantly lower (p < 0.05) in the high, predicted-end-of-century pCO2 treatments, as compared to the near-present-day pCO2 treatments, for both
the 28 and 32° C treatments (Fig. 3b.) These results suggest that calcification within the scleractinian coral S. siderea will be impaired by CO2-induced ocean acidification that is
predicted for year 2100 (IPCC, 2007). These results are consistent with some studies
investigating the impact of CO2-induced ocean acidification on tropical corals (e.g., Langdon et
al., 2000; Crook et al., 2013), but are not consistent with other studies on both tropical (e.g., Reynaud et al., 2003; Jury et al., 2009),temperate (e.g., Ries et al., 2010; Holcomb et al., 2010; Rodolfo-Metalpa et al., 2010, 2011) and cold water (Maier et al., 2011, 2013) scleractinian corals whose calcification rates were not impaired by comparable CO2-induced ocean
20
corals to ocean acidification is highly variable and complex (see Ries et al., 2010, for detailed discussion).
Notably, the coefficient of the temperature effect on calcification (-0.270; Table 7) was substantially greater than the coefficient of the pCO2 effect on calcification (-0.001), suggesting
that the investigated change in temperature exerts a relatively stronger effect than the
investigated change in pCO2 on calcification rates of this coral species. This is supported by the
observation that the linear mixed effect modelling identified temperature as a significant (p < 0.05) stand-alone predictor of calcification rate over the 0-60 day duration of the experiment, while pCO2 was not identified as a significant stand-alone predictor of calcification rate (Table
6). Indeed, pCO2 only became a significant predictor of calcification rate when it was combined
with temperature in the additive model (Tables 6, 7). These results are consistent with a previous study (Castillo et al., 2014) that showed that the isolated effects of predicted end-of-century warming on S. siderea calcification are more severe than the isolated effects of predicted end-of-century acidification.
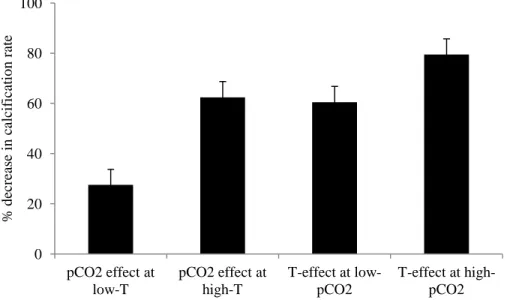
However, the primary objective of the present study was to investigate the combined effects of ocean warming and acidification on tropical coral calcification, as these stressors should co-occur over the 21st century and beyond (IPCC, 2007b). Calcification rates for S. siderea between near-present-day pCO2 (ca. 425 ppm-v) and predicted end-of-century pCO2 (ca.
915 ppm-v; Fig. 7) declined by 27.5% at 28 °C and by 62.4% at 32 °C (Fig. 7). At near-present-day pCO2 (ca. 425 ppm-v), calcification rates for S. siderea declined by 60.5% between 28 and
32 °C, while at predicted end-of-century levels (ca. 915 ppm-v), calcification rates declined by 79.5% with the same increase in temperature (Fig. 7). Thus, it was the elevated
21
cm-2 d-1 (±0.02)] of the four treatments. Notably, this was also the only treatment to yield negative calcification rates (i.e., net dissolution) for some individual coral specimens, although the mean calcification rate for that treatment was positive (Table 3). Thus, although predicted end-of-century ocean warming appears to have a more deleterious impact on coral calcification rate than predicted end-of-century acidification (Castillo et al., 2014), it is the combination of ocean warming and acidification that yields the worst outcome for calcification within this coral species. Nevertheless, the observation that the interactive effects of pCO2 and temperature on
calcification rate were not significant (Table 6) suggests that temperature and pCO2 function
additively, rather than synergistically (with synergistic effects defined as > additive effects), in their impact on the calcification rate of this species.
Castillo et al. (2012) used coral core data (ca. 1980-2010) to show that S. siderea from backreef and nearshore environments were not as negatively impacted by recent warming as S. siderea from forereef environments. They concluded from these observations that that exposure of backreef and nearshore colonies of S. siderea to historically greater baseline seasonal and diurnal thermal stress has increased their resistance/resilience to anthropogenic warming relative to forereef colonies, which have experienced more stable seawater temperatures throughout their evolutionary history. In the present experiment, calcification rates of S. siderea colonies were compared amongst reef zones to empirically evaluate Castillo et al.’s (2012) core-based observation that forereef colonies of S. siderea have been more vulnerable to warming than backreef and forereef colonies over the interval 1980-2010. Although forereef corals did exhibit lower average rates of calcification than those of backreef and nearshore corals in each of the treatments (Fig. 4a-d), it was only in the high-pCO2/low-temperature treatment that calcification
22
(Fig. 4c). Across treatments, linear mixed effects modelling revealed that reef zone was not a significant predictor of calcification rate (Table 6).
23
4. EFFECT OF EXPERIMENTAL DURATION ON CALCIFICATION RESPONSE TO
TEMPERATURE AND pCO2
4.1 Results
4.1.1 Effect of exposure duration
Calcification rates were also evaluated over 0-30 and 30-60 day intervals (Fig. 8) to assess the impact of duration of exposure to elevated temperature and pCO2 on coral calcification
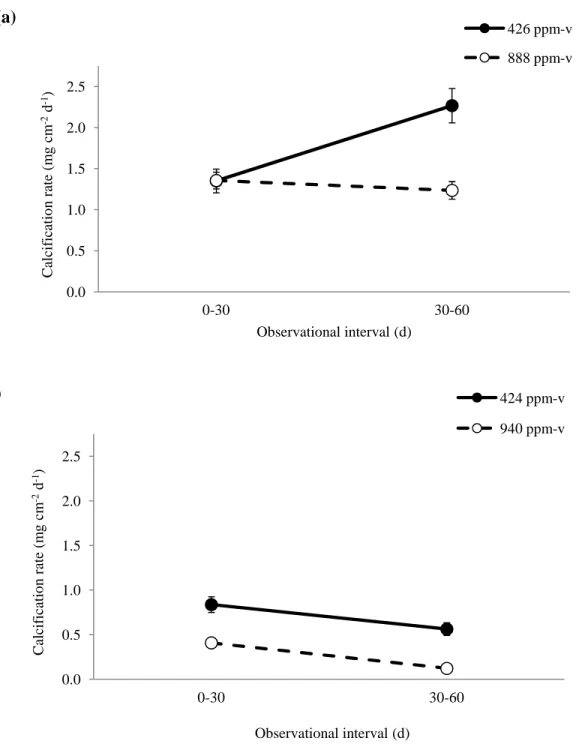
rate. For the ca. 28 °C treatments, calcification rates increased between the 0-30 d and 30-60 d observational intervals at 426 ppm-v, but remained largely unchanged between the 0-30 d and 30-60 d observational intervals at 888 ppm-v (Fig. 8a). For the ca. 32°C treatments, calcification rates decreased between the 0-30 d and 30-60 d observational intervals under both the low and high pCO2 treatments (Fig. 8b). Linear mixed effects modelling (Tables 5, 6) that controlled for
the random effects of tank and colony revealed that temperature (p = 0.001), but not pCO2, was a
significant predictor of calcification rate over the 0-30 d observational interval, while both temperature (p = 0.001) and pCO2 (p = 0.03) were significant predictors of calcification rate over
the 30-60 d observational interval (Table 7). 4.1.2 Model building
Linear mixed effects modelling that controlled for the random effects of tank and colony identified the temperature-only model (model 12; Table 6) and the temperature and pCO2 model
24
temperature and pCO2 were not found to be significant for either observational interval, nor were
the effects of reef-zone.
The following predictive equations were generated from the coefficients and intercepts of the best-fit linear mixed effects models of calcification rates for the 0-30 day and 30-60 day observational intervals presented in Table 7:
Calcification rate (0-30 day; mg cm-2 d-1) = -0.189(±0.043) * T(C°) + 6.624(±1.282) Calcification rate (30-60 day; mg cm-2 d-1) = -0.359(±0.080) * T(C°) – 0.002 (±0.001) *
pCO2(ppm-v) + 12.848(±2.400) 4.2 Discussion
Buoyant weights obtained at thirty-day intervals throughout the experiment revealed that for the ca. 28 °C treatments, the deleterious effect of increased pCO2 on calcification rate was
not observed until the second observational interval (30-60 d), with corals reared at near-present-day carbon dioxide levels calcifying at the rate of 2.27 ±0.21 mg cm-2 d-1 versus the rate of 1.24 ±0.11 mg cm-2 d-1 under the high pCO2 treatment. This delayed response may result from
progressive depletion of the coral’s energy (lipid) reserves (e.g., Anthony et al., 2007, 2009; Cohen and Holcomb, 2009; Castillo et al., 2014), culminating during the second observational interval of the experiment.
25
calcification rates of S. siderea corals reared under the 28 °C are not observed until the 30-60 day observational interval is because it took more than 30-days for the coral’s lipids energy reserves to become depleted by the increased energetic demands of transporting protons across a stronger proton gradient under the higher pCO2-conditions.
In contrast, the reason that the deleterious effects of elevated pCO2 on calcification were
observed in both the first and second observational intervals of the high temperature treatments (ca. 32 °C treatments) may be because the combined stress of warming and acidification caused the corals’ lipid energy reserves to become depleted in fewer than 30 days (i.e., during the first observational interval), with further declines observed during the second observational interval (Fig. 8b). Specifically, the depletion of energy reserves may have been accelerated by the combination of producing less photosynthate and/or lipid (due to thermally induced bleaching) and consuming photosynthate and/or lipids at a faster rate (due to enhanced proton-pumping under more acidic conditions).
This depletion of coral lipid reserves via ocean acidification was previously investigated by Schoepf et al. (2013). Four different species of tropical coral were reared in two temperatures and three pCO2 levels for thirty days. They found mixed calcification rate responses among
species to increased pCO2, but determined that lipid reserves were largely unaffected. The study
concluded that coral energy reserves were not used to maintain calcification levels in response to increased levels of carbon dioxide. This study, however, was only run for 30 days at a maximum temperature of 29 °C. Results of the present study on S. siderea suggest that this observational interval and temperature may not be sufficient to observe a material depletion in coral lipid reserves. The study findings also reveal that over short intervals (< 30 d), CO2-induced ocean
26
calcification rate of the coral S. siderea (Fig. 8a; Table 7). This is consistent with the conceptual framework that corals possess the ability to maintain calcification rates in the short term by manipulating the carbonate chemistry of their calcifying medium (e.g., Ries et al., 2009; Kreif et al., 2010; Ries, 2010, 2011; Trotter et al., 2011; Anagnostou et al., 2012; McCulloch et al., 2012; Venn et al., 2012; Castillo et al., 2014). Over longer intervals (i.e., > 30 d), it appears that ability of S. siderea to continue manipulating the carbonate chemistry of their calcifying medium is cumulatively impaired, such as through the progressive depletion of the corals’ lipid energy reserves as discussed above.
The delayed effects of seawater warming and acidification on coral calcification rate may explain some of the variation in magnitude, and even direction, of calcification responses to warming and acidification observed in prior experiments on tropical corals that were conducted over varying durations (e.g., Marubini et al., 2001, 2003; Comeau et al., 2003; Langdon and Atkinson, 2005; Kleypas et al., 2006; Schneider and Erez, 2006; Doney et al., 2009; Krief et al., 2010). Had the present experiment on S. siderea terminated at thirty days, no change in
calcification rate would have been observed at 28 °C between low and high pCO2. The
experiment required an additional thirty days of observation for the accumulated stress of acidification to impact the corals’ rate of calcification. Likewise, had the experiment been extended beyond 60 days, the negative response to CO2-induced acidification may have become
27
30-60 day observational intervals. And the observation that the deleterious effects of CO2
-induced ocean acidification on calcification rate were observed earlier in the high temperature treatments than in the low temperature treatments supports this assertion. However, the observation that the interactive effects of pCO2 and temperature on calcification rate were not
significant across either observational interval (Table 6) supports the assertion that temperature and pCO2 function additively, rather than synergistically, in their impact on the calcification rate
28
5. EFFECT OF TEMPERATURE AND pCO2 ON CORALLITE MORPHOLOGY
5.1 Results
5.1.1 Impact of temperature on corallite height
Corallite height is defined here as the distance between the base and top of a single corallite—the cavity onto which the individual coral polyp is anchored and retracts into when threatened. Corallite heights were not significantly different (p > 0.05) between the 28 °C and 32 °C treatments under both the control and elevated pCO2 conditions (Fig. 9a). There was no
significant difference in average corallite heights between the low and high temperature
treatments under near-present-day pCO2 (28.1 °C/426 ppm-v: 1386.14 ±41.94 µm; 31.9 °C/424
ppm-v: 1305.53 ±56.07 µm), nor between the low and high temperature treatments under elevated pCO2 (28.0 °C/888 ppm-v: 1199.03 ±52.36 µm; 31.8 °C/940 ppm-v: 1158.21 ±31.22 µm). Linear mixed effects modelling (Tables 5, 6) that controlled for the random effects of tank and colony confirmed that temperature was not a significant predictor of corallite height over the duration of the experiment.
5.1.2 Impact of pCO2 on corallite height
Average corallite heights significantly (p < 0.05) declined from the control to the elevated pCO2 treatments under both the low and high temperature conditions (Fig. 9b). For the
29
effects modelling (Tables 5, 6) that controlled for the random effects of tank and colony
confirmed that pCO2 was a significant (p = 0.003) predictor of corallite height over the duration
of the experiment (Table 7).
5.1.3 Impact of temperature on corallite infilling
Corallite infilling, defined as the percent of the corallite occupied by septal skeleton in plan view. There was no significant difference in average corallite infilling between the low and high temperature treatments under near-present-day pCO2 (28.1 °C/426 ppm-v: 91 ±1%; 31.9
°C/424 ppm-v: 92 ±1%), nor between the low and high temperature treatments under elevated pCO2 (28.0 °C/888 ppm-v: 85 ±1%; 31.8 °C/940 ppm-v: 86 ±1%) (Fig. 10a). Linear mixed
effects modelling (Tables 5, 6) that controlled for the random effects of tank and colony
confirmed that temperature was not a significant predictor of corallite infilling over the duration of the experiment.
5.1.4 Impact of pCO2 on corallite infilling
Average corallite infilling significantly (p < 0.05) declined from the control to the elevated pCO2 treatments under both the low and high temperature treatments (Fig. 10b). For
the 28 °C treatments, average corallite infilling (±SE) increased from 85 ±1% to 91 ±1% from the 888 ppm-v (28.0 °C) to the 426 ppm-v (28.1 °C) treatments. For the 32 °C treatments, average corallite infilling increased from 86 ±1% to 92 ±1% from the 940 ppm-v (31.8 °C) to the 424 ppm-v (31.9 °C) treatments. Linear mixed effects modelling (Tables 5, 6) that controlled for the random effects of tank and colony confirmed that pCO2 was a significant (p = 0.0003)
predictor of corallite height over the duration of the experiment (Table 7).
30
corallites amongst the various treatments. The average number of septa per corallite (±SE) was found to be 46 ±2, 46 ±2, 45 ±1, and 47 ±1 for the 28.1 °C/426 ppm-v, 31.9 °C/424 ppm-v, 28.0 °C/888 ppm-v, and 31.8 °C/940 ppm-v treatments, respectively. These results indicate that the observed variation in corallite infilling resulted from CO2-induced changes in the thickness of
the coral septae in plan view, rather than from CO2-induced changes in the number of septae
within each corallite. 5.1.5 Model building
Linear mixed effects modelling (Tables 5, 6) that controlled for the random effects of tank and colony identified the pCO2-only model with random slopes for tank and colony (model
20; Table 6) as the AIC-best fit model with the greatest number of significant predictors for both corallite height and corallite infilling. The interactive effects of temperature and pCO2 were not
found to be significant predictors of either corallite height or corallite infilling, nor were the effects of reef-zone (Table 6).
The following predictive equations were generated from the coefficients and intercepts of the best-fit linear mixed effects models of corallite height and corallite infilling presented in Table 7:
Corallite height (µm) = -0.357(±0.090) * pCO2(ppm-v) + 1511.045(±72.394)
%-Corallite infilling = -0.000119(±0.0000210) * pCO2(ppm-v) + 0.965(±0.0161) 5.2 Discussion
The coral skeleton begins with a structure known as the basal plate. This plate forms the template upon which the corallite of a young polyp will be built. Layers of aragonite are
31
(radial partitions). The dissepiments form the base of the corallite and give it stability. The interior of the corallite (i.e., the calix) is divided by vertical plates (septae) radiating from the center. The columnella is found at the center of the corallite and is composed of the intertwining ends of the individual septa. These septae form the uppermost structure an individual corallite (Cohen and McConnaughey, 2003; Fig. 11).
Corallite height and %-corallite infilling were significantly lower (p < 0.05) in the high pCO2 treatments than in the near-present-day pCO2 treatments for both the 28 and 32 °C
treatments (Figs. 9b and 10b) The observed reductions in corallite height and infilling under elevated pCO2 are consistent with the observed reductions in net calcification rate under elevated
pCO2 (Fig. 3b; Table 7) and may define the mechanism—at least in part—by which CO2
-induced ocean acidification impairs calcification within this coral species. Conversely, since temperature did not appear to impact corallite geometry, but was observed to negatively impact coral calcification rate, temperature may impair calcification rates within this coral species simply by reducing the rate of vertical progradation of the entire corallite structure.
The observed reduction in corallite infilling under elevated pCO2 is also consistent with
the results of an 8-day experiment conducted at 25 °C by Cohen et al. (2009) that found that the cross-sectional skeletal area of new recruits of the tropical scleractinian coral Favia fragum was 75% lower under reduced ΩA relative to the control treatment.
As measurements of corallite height and infilling reflect vertical and lateral accretion, respectively, of the corallite’s septae, it is possible that CO2-induced changes in the arrangement
32
Aragonite crystal habit becomes progressively more acicular with increasing rates of precipitation (i.e., more deviant from equilibrium conditions). Conversely, the equant crystal habit of aragonite is associated with slow growth in abiotic systems under conditions close to equilibrium (Cohen and McConnaughey, 2003; Holcomb et al., 2009). Thus, a CO2-induced
decrease in ΩA could alter the habit of aragonite crystals comprising the coral skeleton (Cohen
and McConnaughey, 2003). Indeed, Cohen et al. (2009) observed that aragonite needles comprising the sclerodermites (i.e., the aragonitic spherulites that represent the next highest structural unit of the coral skeleton above that of individual aragonite needles) of new recruits of F. fragum became shorter, wider and less organized with decreasing seawater pH. This decrease in the aspect ratio of coral aragonite under lower pH (Cohen et al., 2009) could explain the observed decrease in both corallite height and infilling within S. siderea corals reared under elevated pCO2.
Although a trend towards lower corallite heights under the higher temperature treatments was noted (Fig. 9a), it was not significant (p > 0.05). Hierarchical mixed effects modelling confirmed that pCO2 was the only significant predictor of both corallite height and infilling
(Table 6).
The results of the present study suggest that atmospheric pCO2 predicted for the end of
this century will alter the corallite geometry of S. siderea by reducing corallite height and degree of corallite infilling (Fig. 12). CO2-induced reductions in corallite height would reduce the
volume of the calyx into which the coral polyp can retreat when threatened, thus increasing the polyp’s vulnerability to predation. CO2-induced reductions in corallite infilling would reduce the
33
34
6. CONCLUSION
The present study investigated the independent and combined effects of pCO2 and
temperature on the calcification rate and corallite morphology (corallite height and infilling) of the tropical reef-building coral S. siderea. Hierarchical linear mixed effect modelling of the results allowed the independent, additive, and interactive fixed effects of pCO2, temperature, and
reef-zone to be evaluated as predictors of coral calcification rate, corallite height, and corallite infilling, while controlling for the random effects of tank and colony.
The experiments reveal that both ocean warming and acidification impair calcification rates in the scleractinian coral S. siderea. Corals reared under pCO2 predicted for year 2100
exhibited a decrease in calcification rate compared to those raised at near-present-day pCO2.
Although the CO2-induced reduction in calcification rate was substantial, a more severe decline
in calcification rate was observed as temperature was increased from a near-present-day level to a temperature predicted for year 2100, suggesting that warming poses the more immediate threat for this species of tropical reef-building coral. Predictive equations produced by the mixed effects modelling show that for every one degree C rise in temperature, an approximately 270 ppm-v rise in atmospheric pCO2 is required to produce an equivalent decline in coral
calcification rate.
35
calcification rate indicates that temperature and pCO2 function additively, rather than
synergistically, in their impact on the calcification rate of this species.
The deleterious effects of temperature and pCO2 (at the higher temperature) on
calcification rates were observed in both the first (0-30 d) and second (30-60 d) observational intervals of the experiment, while the deleterious effect of pCO2 at the lower temperature was not
observed until the second observational interval. The delayed onset of the deleterious effects of ocean acidification is consistent with the assertion that calcification in more acidic seawater can result in the progressive depletion of corals’ lipid energy reserves—thereby limiting their ability to manipulate carbonate chemistry at their site of calcification. It also underscores the
importance of experiment duration in assessing the response of corals to ocean warming and acidification and may partly explain apparent disparities in the coral calcification responses to these stressors as reported in prior studies.
Although average calcification rates for forereef colonies were consistently lower than calcification rates for backreef and nearshore colonies, consistent with the core-based
observations of Castillo et al. (2012), these cross-reef differences were only statistically significant in the high-pCO2/low-temperature treatment. And across treatments, the mixed
effects modelling revealed that reef zone was not a significant predictor of calcification rate, corallite height, or corallite infilling. Differences in the vulnerability of corals from different reef zones to warming and acidification should be investigated via longer-term experiments, as such differences are critical for informing the decisions and actions of coral reef managers, policy makers, and legislators seeking to minimize the impact that CO2-induced stressors will
36
Although numerous studies have documented the negatives effects of warming and acidification on calcification rates of scleractinian corals, few have investigated the impacts of these stressors on the skeletal morphology of corals. The present study on S. siderea reveals that CO2-induced ocean acidification, but not warming, reduces corallite height and corallite infilling
of this species. These changes in corallite geometry are consistent with past observations that the aspect ratio of both biogenic and abiogenic aragonite crystals is reduced when precipitated from seawater of reduced ΩA. These CO2-induced changes in corallite geometry are also consistent
with the observation of the present study that pCO2 was a significant predictor of coral
calcification rate. Indeed, such alteration of corallite geometry may define, at least in part, the very mechanism by which ocean acidification impairs calcification rates within this species of coral. Conversely, since temperature did not appear to impact corallite geometry, but was observed to negatively impact coral calcification rate, it appears that temperature impairs calcification rates within this species simply by reducing the vertical progradation rate of the entire corallite structure.
CO2-induced reductions in corallite height and corallite infilling would reduce both the
volume of the calyx into which the coral polyp can retreat when threatened and the biomechanical strength of the coral’s protective corallite, thereby increasing the polyp’s vulnerability to predation and impairing the corallite’s ability to withstand mechanical impact and/or abrasion from high-force events such as storms, tsunamis, boat groundings, and parrotfish grazing.
37
changes in the coral skeleton that accompany ocean warming and acidification. Such information, in combination with the results of the present study, should prove useful in predicting and, potentially, mitigating the impacts of future CO2-induced warming and
38 FIGURES
Figure 1. Plot of final buoyant weight vs. final dry weight for experimental S. siderea corals in
low-pCO2 (a) and high-pCO2 (b) treatments. The strong linear correlation allows for estimation
of initial dry weight from initial buoyant weight, for determination of net calcification rate.
y = 1.5797x + 917.8 R² = 0.9452
0 2000 4000 6000 8000 10000 12000 14000 16000 18000
0 2000 4000 6000 8000 10000 12000
F in al d ry w ei g h t (m g )
Final bouyant weight (mg)
(a)
y = 1.6067x + 528.0 R² = 0.9973
0 2000 4000 6000 8000 10000 12000 14000 16000 18000
0 2000 4000 6000 8000 10000 12000
F in al d ry w ei g h t (m g )
Final bouyant weight (mg)
39
Figure 2. Progressive manipulation of S. siderea corallite photomicrographs for
quantification of septal infilling. (a) Original aligned and focused micrograph. (b) 32-bit color image converted to 8-bit grayscale image. (c) Image contrast increased by 30%. (d) Cropped image of individual corallite.
(a)
(b)
40
Figure 3. Average calcification rates for S. siderea corals reared at four crossed
temperature-pCO2 treatments (425 ppm-v-28 °C; 425 ppm-v-32 °C; 915 ppm-v-28 °C; 915 ppm-v-32 °C).
(a) Temperature-effect for low and high-pCO2 treatments. (b) pCO2-effect for low and
high-temperature treatments. Mixed effects modelling reveals that both pCO2 and temperature are
significant predictors of coral calcification rate across the duration of the sixty day experiment. Bars show standard error.
0.0 0.5 1.0 1.5 2.0
26 28 30 32 34
C al ci fi ca ti o n r at e (m g c m -2 d -1) Temperature (°C) (a) low pCO2 high pCO2 0.0 0.5 1.0 1.5 2.0
0 200 400 600 800 1000 1200
C al ci fi ca ti o n r at e (m g c m -2 d -1)
pCO2(ppm-v)
(b)
41 0.0 0.5 1.0 1.5 2.0 2.5
BR FR NS
C al ci fi ca ti o n r at e (m g c m -2 d -1) Reef zone (a) 0.0 0.5 1.0 1.5 2.0 2.5
BR FR NS
C al ci fi ca ti o n r at e (m g c m -2 d -1) Reef zone (b) 0.0 0.5 1.0 1.5 2.0 2.5
BR FR NS
42
Figure 4. Calcification rates of S. siderea coral specimens from different reef zones (‘BR’ = backreef; ‘FR’ = forereef; ‘NS’ = nearshore) within the four temperature-pCO2 treatments: (a)
425 ppm-v-28 °C; (b) 425 ppm-v-32 °C; (c) 915 ppm-v-28 °C; (d) 915 ppm-v-32 °C. No statistically significant differences in calcification rates amongst corals from the different reef zones were evident, with the exception that nearshore corals calcified significantly (p < 0.05) faster than forereef corals in the 915 ppm-v-28 °C treatment. Across treatments, mixed effects modelling reveals that reef zone was not a significant predictor of calcification rate or corallite geometry. Black vertical bars show standard error.
0.0 0.5 1.0 1.5 2.0 2.5
BR FR NS
C
al
ci
fi
ca
ti
o
n
r
at
e
(m
g
c
m
-2
d
-1)
Reef zone
43
Figure 5. Histogram distribution of Coral Watch Coral Health Chart final saturation and
brightness scale values (1 = no pigment; 6 = no loss of pigment) for the S. siderea specimens raised in the four temperature/pCO2 treatments.
0 4 8 12 16 20 24 28 32 36
6 5 4 3 2 1
N
u
m
b
er
o
f
sp
ec
im
en
s
Saturation and Brightness Scale Value
44
Figure 6. Average calcifications rate for bleached and non-bleached specimens of S. siderea: (a)
31.9 °C at 424 ppm-v (b) 31.8 °C at 940 ppm-v. Black vertical bars show standard error.
45
Figure 7. Percent-decrease in calcification rates amongst S. siderea coral reared in four crossed
temperature-pCO2 treatments: 888ppm-v/28.0 °C to 426 ppm-v/28.1 °C; 940 ppm-v/31.8 °C to
424 ppm-v/31.9 °C; 31.9 °C/424 ppm-v to 28.1 °C/426 ppm-v; 31.8 °C/940 ppm-v to 28.0 °C/888 ppm-v. Bars show standard error.
0 20 40 60 80 100
pCO2 effect at low-T
pCO2 effect at high-T
T-effect at low-pCO2
T-effect at high-pCO2
%
d
ec
re
as
e
in
c
al
ci
fi
ca
ti
o
n
r
at
46
Figure 8. Average calcification rates for S. siderea corals reared under the control and elevated pCO2 ppm-v conditions for the 0-30 and 30-60 day observational intervals at 28 °C (a) and 32 °C
(b). Mixed effects modelling reveals that temperature only is a significant predictor of
calcification rate across the 0-30 d observational interval, while both temperature and pCO2 are
significant predictors across the 30-60 d interval. Black vertical bars show standard error.
0.0 0.5 1.0 1.5 2.0 2.5 0-30 30-60 C al ci fi ca ti o n r at e (m g c m -2 d -1)
Observational interval (d)
(a) 426 ppm-v 888 ppm-v 0.0 0.5 1.0 1.5 2.0 2.5 0-30 30-60 C al ci fi ca ti o n r at e (m g c m -2 d -1)
Observational interval (d)
(b) 424 ppm-v
47
Figure 9. Average corallite heights for S. siderea corals reared at four crossed temperature-pCO2
treatments: 28.1 °C/426 ppm-v; 28.0 °C/888 ppm-v; 31.9 °C/424 ppm-v; 31.8 °C/940 ppm-v. (a) Temperature-effect for low and high-pCO2 treatments. (b) pCO2-effect for low and
high-temperature treatments. Mixed effects modelling reveals that pCO2, but not temperature, is a
significant predictor of corallite height. Bars show standard error.
1100 1200 1300 1400
26 28 30 32 34
C o ra ll it e h ei g h t ( µ m ) Temperature °C (a) low pCO2 high pCO2 1100 1200 1300 1400
0 200 400 600 800 1000 1200
C o ra ll it e h ei g h t (u m )
pCO2(ppm-v)
(b)
48
Figure 10. Percent-corallite infilling for S. siderea corals reared at four crossed
temperature-pCO2 treatments: 28.1 °C/426 ppm-v; 28.0 °C/888 ppm-v; 31.9 °C/424 ppm-v; 31.8 °C/940
ppm-v. (a) Temperature-effect for low and high-pCO2 treatments. (b) pCO2-effect for low and
high-temperature treatments. Mixed effects modelling reveals that pCO2, but not temperature, is
a significant predictor of corallite height. Bars show standard error.
80% 85% 90% 95%
26 28 30 32 34
% -c o ra ll it e in fi ll in g Temperature (°C)
(a) low pCO2
high pCO2
80% 85% 90% 95%
0 200 400 600 800 1000 1200
% -c o ra ll it e in fi ll in g
pCO2(ppm-v)
(b)
49
Figure 11. Cross-sectional photomicrograph (a; present study) and diagram (b; Veron, 1993) of
the corallite structure showing septa, dissepiment, columnella, and theca. Black vertical bar shows corallite height as measured in the present study via stereomicroscopy.
(a)
(b)
(a)
(b)
columnella
theca
dissepiment
columnella
theca
dissepiment
50
Figure 12. Photomicrographs of Siderastrea siderea specimens showing the combined effects
of temperature and pCO2 on corallite morphology. (a) 425 ppm-v at 28 °C. (b) 425 ppm-v at 32
°C. (c) 915 ppm-v at 28 °C. (d) 915 ppm-v at 32 °C.
(a)
(b)
200 µm
51 TABLES
Table 1. Summary of recent studies investigating the effects of ocean acidification on
scleractinian coral calcification.
Paper Duration Response Water temperature
Hennige et al., 2014 21 days neutral cold
Maier et al., 2011 5 days negative threshold cold Ries, Cohen, McCorkle, 2010 60 days threshold negative temperate Holcomb et al., 2010 6 months negative temperate Rodolfo-Metalpa et al., 2010 1 year neutral temperate
Ohki et al., 2013 6 weeks negative tropical
Movilla et al., 2012 92 days negative tropical
Krief et al., 2010 14
months negative tropical
Muehllehner & Edmunds,
2008 14 day negative tropical
Castillo et al., 2014 90 days parabolic tropical
Table 2. Summary of average calculated and measured parameters for the temperature and
pCO2 treatments.
425ppm/32 °C 425ppm/28 °C 915ppm/32 °C 915ppm/28 °C CALCULATED PARAMETERS
pCO2 (gas-e) (ppm-v) 424 426 940 888
SE 10 11 10 14
Range 349 - 537 334 - 522 824 - 1059 730 - 1018
n 24 22 27 26
pH 8.09 8.10 7.80 7.77
SE 0.01 0.01 0.01 0.01
Range 7.93 - 8.16 7.96 - 8.19 7.76 - 7.85 7.69 - 7.85
n 24 22 27 26
[CO3