PHYSICOCHEMICAL APPROACHES FOR THE REMEDIATION OF MANUFACTURED GAS PLANT TAR IN POROUS MEDIA
Scott C. Hauswirth
A dissertation submitted to the faculty of the University of North Carolina at Chapel Hill in partial fulfillment of the requirements for the degree of Doctor of
Philosophy in the Department of Environmental Sciences and Engineering.
Chapel Hill 2014
c
2014
ABSTRACT
SCOTT C. HAUSWIRTH: PHYSICOCHEMICAL APPROACHES FOR THE REMEDIATION OF MANUFACTURED GAS PLANT
TAR IN POROUS MEDIA
(Under the direction of Cass T. Miller)
Tars produced as a by-product of coal and oil gasification at former manu-factured gas plants (FMGPs) during the 19th and early 20th centuries were often
ACKNOWLEDGMENTS
I honestly would not have made it through this endeavor without the help and support of a number of individuals. I first want to thank my adviser, Dr. Casey Miller, for having faith in me over these years and for giving me the space to explore and learn on my own. I am also highly appreciative of Gaylen Brubaker, Bill Gray, Jingfang Huang, Richard Kamens, and Lee Pedersen for serving on my committee.
I am honored to have had the opportunity to work with my collaborators and coauthors, including Pam Schultz, Joe Pedit, Seth Rylander, Stephen Richardson, and Michael Aitken. Additionally, I am indebted to the Masters and undergrad-uate students in Dr. Miller’s research group who have assisted me through the years; they are Zineb Bouzoubaa, Caroline Tapscott, Dominion Rognstad, Emily Chapin, and Dana Williams. The camaraderie of my lab- and classmates, espe-cially Ben Scandella, Ben Lebron, Arne Newman, Collin Ward, Harshal Parikh, and, of course, Amanda Dye, is also greatly appreciated and made the hardest times bearable.
TABLE OF CONTENTS
LIST OF TABLES . . . ix
LIST OF FIGURES . . . x
LIST OF ABBREVIATIONS . . . xii
1 INTRODUCTION . . . 1
1.1 Non-aqueous Phase Liquids . . . 1
1.1.1 Behavior of NAPLs in the Subsurface . . . 2
1.1.2 Remediation of NAPLs . . . 4
1.2 Manufactured Gas Plants . . . 8
1.2.1 History and MGP Processes . . . 9
1.2.2 Wastes at FMGP Sites . . . 10
1.3 Research Objectives . . . 14
2 COMPOSITIONAL AND PH EFFECTS ON THE IN-TERFACIAL TENSION BETWEEN COMPLEX TAR MIXTURES AND AQUEOUS SOLUTIONS . . . 17
2.1 Introduction . . . 17
2.2 Methods and Materials . . . 20
2.2.1 Materials . . . 20
2.2.2 Methods . . . 22
2.3 Results . . . 25
2.3.1 Composition . . . 25
2.3.2 Interfacial Tension . . . 30
2.4 Discussion . . . 33
3 MOBILIZATION OF MANUFACTURED GAS PLANT
TAR WITH ALKALINE FLUSHING SOLUTIONS . . . 43
3.1 Introduction . . . 43
3.2 Materials and Methods . . . 47
3.2.1 Fluid Characterization . . . 48
3.2.2 IFT and Contact Angle . . . 48
3.2.3 Column Studies . . . 50
3.3 Results . . . 52
3.3.1 IFT and Contact Angle . . . 54
3.3.2 Column Studies . . . 57
3.4 Discussion . . . 59
3.5 Supporting Information . . . 63
4 A COMPARISON OF PHYSICOCHEMICAL METH-ODS FOR THE REMEDIATION OF POROUS MEDIUM SYSTEMS CONTAMINATED WITH TAR . . . 68
4.1 Introduction . . . 68
4.2 Background . . . 74
4.2.1 NAPL Mobilization . . . 74
4.2.2 Tar Dissolution . . . 75
4.2.3 NAPL Solubilization . . . 76
4.2.4 Chemical Oxidation . . . 78
4.3 Methods and Materials . . . 79
4.3.1 Materials . . . 79
4.3.2 Analytical Methods . . . 79
4.3.3 Batch Experiments . . . 80
4.3.4 Column Experiments . . . 81
4.4 Results . . . 84
4.4.2 Surfactant Batch Test . . . 86
4.4.3 Mobilization and Solubilization . . . 87
4.4.4 Oxidation . . . 93
4.4.5 Dissolved PAH Concentrations . . . 96
4.5 Discussion . . . 99
4.5.1 Mobilization . . . 99
4.5.2 Solubilization . . . 103
4.5.3 Oxidation . . . 104
4.5.4 Aqueous-Phase Concentrations . . . 105
4.6 Conclusion . . . 106
5 CONCLUSIONS AND RECOMMENDATIONS . . . 110
LIST OF TABLES
1.1 EPA Priority Pollutant PAHs . . . 12
2.1 Concentration of Asphaltene, Resin, Acid, and Base Fractions . . 26
2.2 Average molar mass of tars and asphaltenes . . . 28
2.3 A-factor andIC=O from FTIR analysis. . . 30
2.4 Results of GC-FID Analysis for Samples P1–P5. . . 37
2.5 Results of GC-FID Analysis for Samples B1–B3 and CT. . . 38
2.6 Results of IFT analysis. . . 39
3.1 Tar composition and properties. . . 53
3.2 Summary of column experiment results. . . 59
3.3 Aqueous phase concentrations before and after alkaline flushing. . 60
4.1 Summary of Literature Studies of Mobilization and Sol-ubilization Approaches Applied to FMGP Tars and Soils . . . 71
4.2 Summary of Literature Studies of ISCO Approaches Ap-plied to FMGP Tars and Soils . . . 72
4.3 PAHs included in this study, their concentration in the tar (Ctar i ) and pure phase solubility(Si). . . 81
4.4 Experimental Summary. . . 83
4.5 Physical properties of fluids used in this study. . . 85
4.6 Solubilization of PAHs in TX100 solutions in batch studies . . . . 87
4.7 Results of mobilization and solubilization experiments. . . 88
LIST OF FIGURES
2.1 Interfacial tension of (a) tars and synthetic mixtures
con-taining (b) asphaltenes and (c) resins as a function of pH. . . 31 2.2 The reduction in IFT at high pH as a function of (a)
IC=O and (b) A-factor, and the reduction of IFT at low
pH as a function of (c) the log of the extractable base
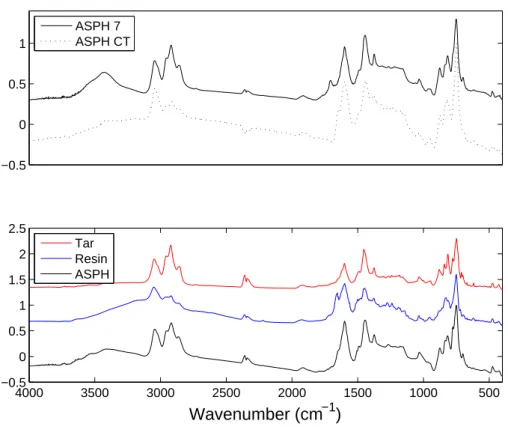
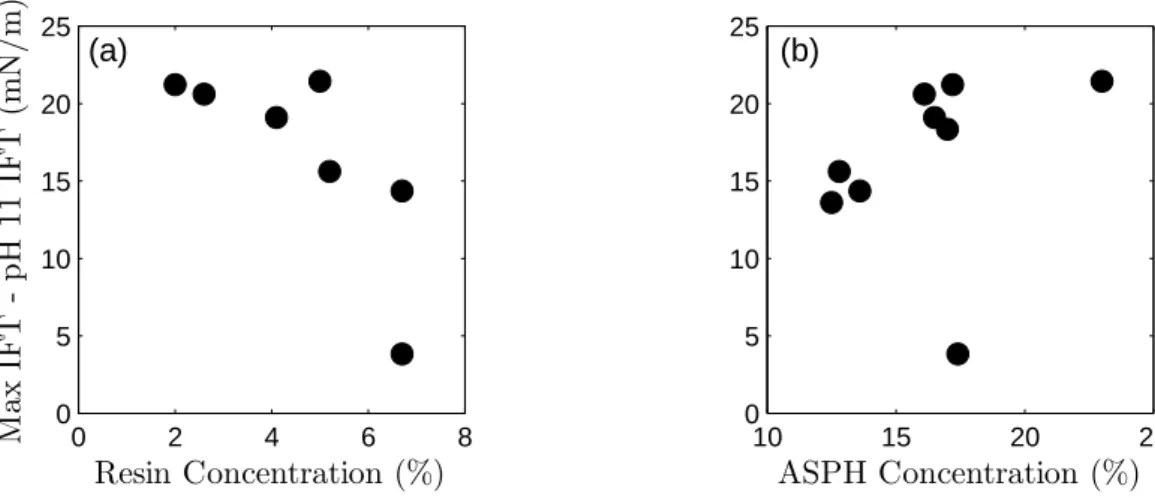
concentration and (d) asphaltene molar mass. . . 34 2.3 FTIR spectra of tars, asphaltenes, and resins . . . 39 2.4 IFT reduction at high pH versus (a) resin concentration
and (b) asphaltene concentration. . . 40 2.5 Relationship between the extractable acid concentration
and the IFT reduction at high pH. . . 40 2.6 Relationships betweenIC=Oand (a) extractable acid
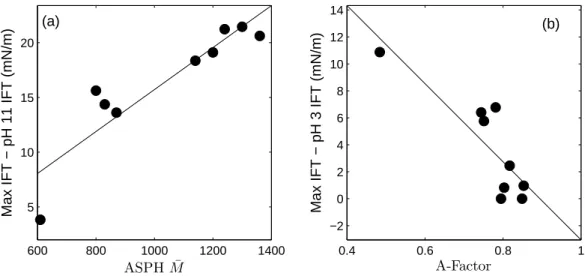
conc-entration and (b) A-factor. . . 41 2.7 Relationship between (a) asphaltene ¯M and the IFT
re-duction at high pH, and (b) the A-factor and the IFT
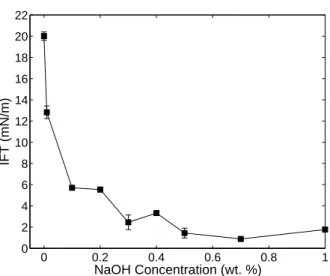
reduction at low pH. . . 41 2.8 Hypothetical coal (a) and petroleum (b) asphaltene structures . . 42 3.1 Rheology of XG solutions. . . 54 3.2 Dynamic tar-water IFT. . . 55 3.3 Equilibrated tar-water IFTs for a range of NaOH concentrations. . 55 3.4 Contact angle measurements. . . 56 3.5 Results of select column flushing experiments illustrating
the improved tar removal for a combined NaOH + XG
solution versus either NaOH or XG alone. . . 58 3.6 Diagram of the IFT and contact angle apparatus. . . 64 3.7 Diagram of the column apparatus. . . 65 3.8 Alkaline solution pH before and after equilibration for
4.2 Solubility of tar components in 0.5% TX100 solution and the ratio of the solubility in surfactant solution to
aque-ous solubility. . . 87 4.3 Fraction SPAH remaining as a function of PV flushed for
MSR1B–4. . . 89 4.4 Cumulative tar mass removed as a function of PV flushed
for columns MSR1–MSR4 . . . 89 4.5 Change in ω∗
for (a) mobilization and solubilization
ex-periments and (b) oxidation exex-periments. . . 90 4.6 Effluent concentration of SPAH during surfactant
flush-ing for MSR2, MSR3, and MSR4. . . 92 4.7 Fraction of PAHs remaining in sand at the end of
oxida-tion column experiments. . . 94 4.8 Cumulative mass of SPAHs in effluent from OX3 and
OX3C, indicating significant removal by solubilization. . . 96 4.9 Ratio of post-treatment to pre-treatment dissolved-phase
concentrations after (a) AP or ASP, (b) SP, and (c)
oxi-dation flushes. . . 97 4.10 Post-treatment effluent concentrations during 50 PV DDI
flush of MSR1C. . . 98 4.11 Change in ratio of post-treatment to pre-treatment
dissolved-phase concentrations during MSR1C water flush. . . 98 4.12 Relationship between (a)Snand logNT, and (b)
LIST OF ABBREVIATIONS
1MN 1-methylnaphthalene 2EN 2-ethylnaphthalene 2MN 2-methylnaphthalene
ACE acenaphthene
ACY acenaphthylene
ANT anthracene
AP alkaline-polymer
ASP alkaline-surfactant-polymer
ASPH asphaltene
BaA benzo[a]anthracene
BaP benzo[a]pyrene
BbF benzo[b]fluoranthene BgP benzo[ghi]perylene BkF benzo[k]fluoranthene
BEN benzene
CHR chrysene
CWG carburetted water gas DaA dibenzo[ah]anthracene DCM dichloromethane
DDI distilled, deionized water DNAPL dense non-aqueous phase liquid
FID flame ionization detector (for GC)
FLU fluoranthene
FLE fluorene
FMGP former manufactured gas plant
GC gas chromatography
HPLC high-performance liquid chromatography IFT interfacial tension
INA indane
INE indene
IND indeno[123-cd]pyrene
IPA isopropanol
ISCO in situ chemical oxidation
LNAPL light non-aqueous phase liquid MAH monocyclic aromatic hydrocarbon MGP manufactured gas plant
MS mass spectrometer (for GC) MSR molar solubilization ratio
NAP naphthalene
NAPL non-aqueous phase liquid
PAH polycyclic aromatic hydrocarbon PCB polycholorinated biphenyl
PCE tetrachloroethylene
PHE phenanthrene
PYR pyrene
SP surfactant-polymer
SPAH sum of 15 PAHs measured by HPLC TCE trichloroethene
TOL toluene
TPAH total PAHs measured by GC-FID TX100 Triton X-100
VPO vapor pressure osmometry
XG xanthan gum
CHAPTER 1 INTRODUCTION
1.1 Non-aqueous Phase Liquids
Groundwater is the second largest source of freshwater for human use, account-ing for approximately 26% of the United States’ freshwater [218]. Contamination of groundwater is a major concern and may arise from a wide range of sources, including discharges from industrial operations and wastewater treatment plants, leaking underground storage tanks, septic systems, mining operations, improper disposal of chemical wastes, runoff from agricultural lands and roadways, or from natural sources (e.g., arsenic and radon). Hazardous waste sites, estimated to number 300,000 in the U.S., represent an important source of groundwater con-tamination [217].
Many NAPL components are toxic, carcinogenic, or otherwise harmful to hu-mans and ecological systems. These components can dissolve into groundwater and potentially migrate to sensitive receptors in the vicinity of waste sites. The solubilities of many components is sufficiently low that NAPLs can persist in the environment as a source of groundwater contamination for years to centuries after their release [39, 150]. The following sections discuss the behavior of NAPL con-taminants in the environment and remediation technologies used in the clean-up of NAPL contaminated sites.
1.1.1 Behavior of NAPLs in the Subsurface
The behavior of NAPLs is controlled by a complex set of factors that includes local and regional geology and groundwater flow patterns, the amount and rate of the release of the NAPL, the physiochemical properties of the NAPL and the interactions between the solid, aqueous, and NAPL phases [131]. NAPLs may be released into the environment through leaks from storage tanks and piping, spills, or improper disposal in waste ponds/lagoons, landfills, or wells. The NAPL will tend to migrate downward through the unsaturated zone under the force of gravity until reaching the capillary fringe or an impermeable geologic material [26].
geologic units [150]. NAPL pools may form at the top of low permeability units and subsequently migrate laterally as a function of the topography of the unit [39, 45, 131]. Further vertical migration may occur once the NAPL reaches a height above the finer-grained material sufficient to overcome capillary forces. Layering of the porous media, even when the differences between the layers are small, can result in the formation of horizontal stringers or lenses of NAPL [150]. As NAPLs move through porous media, both above and below the water table, disconnected NAPL ganglia become trapped in pore spaces as a result of snap-off and bypassing processes [25, 157, 205]. Residual NAPL is generally immobile under natural conditions and may constitute a large portion of the total NAPL mass present at a site [45].
groundwater are desired [150].
1.1.2 Remediation of NAPLs
The remediation of NAPL-contaminated sites has been the focus of a great deal of research over the last several decades. Remediation can be classified into four gen-eral categories: (1) removal, (2) separation, (3) destruction, and (4) containment. Each of these remediation classes is discussed below.
Removal generally refers to the excavation of contaminated soils and NAPL source zones, which are disposed of off-site (i.e., in landfills). This approach is relatively straight-forward and is commonly practiced. In many cases, however, it is impractical, including when the NAPL is deep or utilities, roads, or buildings overlie the source zone [65, 120, 128, 150].
Initial efforts to remediate NAPL-contaminated sites without excavation fo-cused on pump-and-treat approaches, which extract groundwater from wells and remove contaminants (either NAPLs or dissolved phase contaminants) using ex situ treatment methods [128, 130]. Where mobile NAPL is present, such an ap-proach can remove some portion of it, but residual NAPL will remain in place. Pumping groundwater containing dissolved phase contaminants is generally inef-fective at removing significant quantities of NAPL due to low aqueous solubilities of most NAPL components, mass transfer rate limitations, and heterogeneities in the subsurface [58, 130, 152, 159].
methanol, ethanol, isopropanol, and tert-butanol).
Surfactants have also been applied for the purpose of increasing NAPL solu-bility [52, 57, 121, 156, 158]. Above the critical micelle concentration (CMC) of a surfactant, the surfactant molecules will group together to form spherical mi-celles. Within the micelles, the surfactant molecules are oriented such that the hydrophobic (lipophilic) portions of the molecules are in the center of the sphere and the hydrophilic portions are directed outward. The micelle acts as an organic pseudophase into which NAPL components may partition, increasing the effective solubility [182, 225]. Enhanced-solubility approaches suffer from reduced efficien-cies in heterogeneous media, where NAPL trapped in finer-grained material is less accessible to the flushing solution [197].
Mobilization-based approaches attempt to improve the removal of free-phase NAPL by altering the balance of forces acting on the NAPL.Three dimensionless numbers, the capillary number (NC), the Bond number (NB), and the trapping
number (NT), are frequently employed to indicate the relative impacts of the
relevant forces. These non-dimensional numbers are derived from a balance of forces acting on a trapped NAPL droplet, and are defined as [160]:
NC ≡
µaqa
σa,ncosθ
(1.1)
NB ≡
(ρa−ρn)gkkra
σa,ncosθ
(1.2)
NT ≡ q
N2
where µa is the aqueous phase dynamic viscosity, qa is the magnitude aqueous
phase Darcy velocity, k is the intrinsic permeability of the media, ρa and ρa
are the NAPL and aqueous phase densities, kra is the aqueous phase relative
permeability, and α is the angle between the flow direction and horizontal. NC
and NB represent the ratio of viscous forces to capillary forces and gravitational
forces to capillary forces, respectively. NT takes viscous and gravitational forces
into account simultaneously.
NT, NC, and NB have been found to correlate with residual NAPL
satura-tion, with higher values corresponding to lower saturations [32, 33, 160, 170]. The general approach in designing mobilization-based remediation techniques is to increase the value of these numbers by decreasing the capillary forces that trap NAPLs (i.e., decreasing IFT) or by increasing viscous forces (i.e., increasing flow rate or viscosity). Of these, IFT reduction has received the most attention from researchers, and is usually accomplished using surfactants (or in some cases al-cohols) [55, 95, 108, 127, 151, 159, 160, 227, 230]. The use of polymer solutions to increase flushing fluid viscosity has been applied in the petroleum industry for enhanced oil recovery (EOR), and has received some attention from remediation researchers [63, 93, 108, 127]. Alteration of flow rate is less common for field im-plementation due to limitations to fluid injection and extraction rates [150, 171]. The major drawback of mobilization-based methods is that complete removal of the NAPL is not achieved, and the remaining NAPL will persist as a source of dissolved-phase contamination [230].
nat-ural conditions). ISCO involves injecting oxidants, including hydrogen peroxide (H2O2), potassium permanganate (KMnO4), sodium persulfate (NaS2O8), and ozone, into the subsurface to destroy contaminants [89]. ISCO approaches may be applied to either NAPLs or dissolved phase contaminants, although high NAPL saturations are more difficult to remediate by this method due to mass transfer limitations and chemical delivery problems [92]. Additionally, sites with high natural oxidant demands are not well suited to ISCO remediation [92].
Enhanced bioremediation involves the injection of oxygen, nutrients, or elec-tron donor compounds to increase the growth and activity of contaminant-degrading microorganisms present in the soil. Mass transfer limitations and toxicity of high concentrations of contaminants to microorganisms make this approach ineffective when significant quantities of NAPL are present [149].
Natural attenuation involves allowing natural processes to degrade contami-nants. This approach is generally applicable as a primary remediation method only when the risks to humans and the environment are limited, other methods are impractical, or the contaminants present are readily biodegradable [150]. Nat-ural attenuation has been used effectively after NAPL source zones are removed [120, 145].
migration of NAPLs and dissolved phase contaminants [128]. Capping approaches use natural and synthetic materials to prevent vertical migration of contaminants or to prevent water from entering and mobilizing contaminants in a contaminated zone. This method is frequently used for preventing movement of contamina-tion between groundwater and surface water, and for remediating contaminated sediments [81, 155].
1.2 Manufactured Gas Plants
FMGPs constitute an important category of DNAPL-contaminated sites, and are the focus of the work described in this dissertation. Manufactured gas plants (MGPs1) were common in the U.S. and Europe in the 19th and early 20th cen-turies, with an estimated 36,121 and 55,001 facilities in the U.S. [217]. These plants produced a flammable gas used for heating, cooking, and lighting from coal and petroleum products. As a by-product of this process, an estimated 11.5 billion gallons of tar DNAPL were produced between 1880 and 1950 [214]. This tar was frequently released into the subsurface through on-site disposal practices or leaks in plant infrastructure. FMGP tars possess several properties that make them among the most challenging of DNAPLs to manage, including high viscosities, compositional complexity, and the ability to alter the wetting characteristics of porous media. A summary of the history and processes of gas production and a description of wastes produced at these sites are provided in the following sections. 1A note on semantics: “MGP” is used to refer to the historic facility whereas “FMGP” references
1.2.1 History and MGP Processes
Manufactured gas, frequently referred to as town gas, is a flammable gas that was historically used for heating and lighting purposes. The first commercial MGP was operated by the Gas Light and Coke Company in London, England starting in 1812 [74]. The technology quickly spread to Europe and the United States, and the first U.S. commercial MGP was constructed in Baltimore, Maryland in 1816 [70]. Early processes involved the heating of bituminous coal or oil shale in iron or baked-clay “retorts” in the absence of oxygen. The hydrocarbons of the source material were cracked to form coal gas, which was composed of methane (CH4), hydrogen (H2), carbon monoxide (CO), ethylene (C2H4), and acetylene (C2H2) [70]. Where coal was unavailable or prohibitively expensive (i.e., the West coast of the U.S.), petroleum oil was used as the source material. The oil gas produced contained relatively higher concentrations of C2H4 and C2H2 than coal gas [18].
In the late 1800s and early 1900s, the two-stage carburetted water gas (CWG) process became widespread throughout the U.S. In the first step, water steam was passed through heated anthracite coal or coke to form water gas, which was composed primarily of CO and H2. Petroleum oils, initially naphtha and later heavier oils, were then injected into the still-hot gas through a carburettor to increase the heating and lighting value of the gas [70, 140]. A number of alternative processes were employed, but these three major classes (coal, oil, and CWG gas) constitute the majority of gas manufacturing in the U.S.[203].
remove hydrogen cyanide (HCN), ammonia (NH3), and hydrogen sulfide (H2S)[70]. The purified gas was then pumped into gas holders for storage prior to distribution. With the construction of a widespread natural gas distribution network in the 1940s–1950s, the manufactured gas industry rapidly declined, and the last U.S. MGP was decommissioned in 1968 [69].
1.2.2 Wastes at FMGP Sites
1.2.2.1 Chemical Composition of FMGP Tars
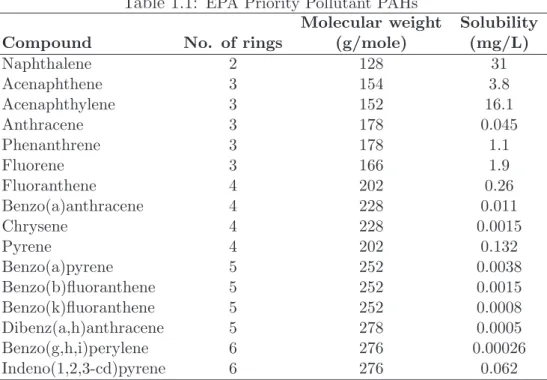
FMGP tars are complex mixtures, estimated to contain up to 10,000 individual compounds [147]. Polycyclic aromatic hydrocarbons (PAHs), hydrocarbons com-posed of two or more fused aromatic rings, are the dominant class of compounds in tars. While hundreds of individual PAH species have been identified in tars [21, 66, 68, 228, 238, 239], the compounds which are most often monitored for the purposes of remediation, and which are frequently present at the highest conc-entrations, are the 16 EPA Priority Pollutant (PP) PAHs. These compounds, along with their molecular masses and aqueous solubilities, are shown in Ta-ble 1.1. Other compound classes present in tars include: mononuclear aromatic hydrocarbons (MAHs; e.g., benzene and alkylated benzenes), tar acids (phenolics) and bases (pyridines), neutral heterocyclic compounds (e.g., thiophenes, furans, pyrroles), aliphatics, cyanide compounds, oxygenated PAHs, and trace metals [18, 54, 56, 83, 126, 137, 148]. The exact composition of a tar is controlled by the process and source material that created it. One important example of this is that tars resulting from the carbonization of coal (coal tars) contain much higher concentrations of tar acids and bases than those resulting from the cracking of petroleum (oil and CWG tars) [70].
Table 1.1: EPA Priority Pollutant PAHs
Molecular weight Solubility
Compound No. of rings (g/mole) (mg/L)
Naphthalene 2 128 31
Acenaphthene 3 154 3.8
Acenaphthylene 3 152 16.1
Anthracene 3 178 0.045
Phenanthrene 3 178 1.1
Fluorene 3 166 1.9
Fluoranthene 4 202 0.26
Benzo(a)anthracene 4 228 0.011
Chrysene 4 228 0.0015
Pyrene 4 202 0.132
Benzo(a)pyrene 5 252 0.0038
Benzo(b)fluoranthene 5 252 0.0015 Benzo(k)fluoranthene 5 252 0.0008 Dibenz(a,h)anthracene 5 278 0.0005 Benzo(g,h,i)perylene 6 276 0.00026 Indeno(1,2,3-cd)pyrene 6 276 0.062
at relatively lower concentrations in FMGP tars (0.4–7.2%) than in crude oils (9–37.3%) [18, 115].
1.2.2.2 Physical Properties of FMGP Tars
FMGP tars are DNAPLs, with reported specific gravities of between 1.005 and 1.424 [18]. Reported dynamic viscosities of MGP tars range from about 10 cP to more than 500,000 cP (35◦
C) [18]. As with composition, the density and viscosity of tars is impacted by the processes and source materials used at the MGP. The greatest factors impacting the tar characteristics are the temperature of the process and whether the tar derives from coal (coal gas) or petroleum oils (CWG and oil gas). Higher temperature processes, such as those used in oil gas production, result in higher concentrations of larger compounds and, consequently, denser and more viscous tars [70]. In general, these factors result in density and viscosity differences following the order: oil gas tars>coal tars>CWG tars [18]. Tar-water IFT, a critical factor in controlling the movement and entrapment of tars in the subsurface, has only been reported for tars from four sites, with a range of 20–25 mN/m at neutral pH [17, 221, 242]. This range is significantly lower than other common DNAPLs, such as TCE and PCE, which have IFTs of 34.5 and 47.5 mN/m, respectively [9]. Tar-water IFT has been found to be strongly dependent on pH, with values as low 0.6 mN/m reported at pH 12.4 [17]. This effect is believed to be the result of the formation of surfactants from acidic groups associated with asphaltenes, as further discussed in Chapters 2 and 3.
water-wet to tar-wet [172, 241]. A greater tar-wet character results in higher tar residual saturations and reduced efficiencies during tar recovery efforts as com-pared to water-wet and intermediate-wet systems [88, 172]. Like IFT, wetting behavior has also been found to be pH dependent, with a low pH being associated with greater tar-wetting behavior. Organic bases in the tar are protonated to form positively-charged ions, resulting in an increased electrostatic attraction to the typically negatively-charged solid phase [46, 88, 125, 172, 241, 242]. As noted in Section 1.2.2.1, major differences in acid and base concentrations are observed between coal tars and CWG tars, and therefore differences may also be expected in the interfacial behavior of different tar types.
1.3 Research Objectives
The remainder of this dissertation is divided into four chapters, the first three of which represents a body of work that has been or will be published in a peer-reviewed journal. A summary of each the chapters is provided below.
additional information regarding the chemical groups present in the tars and resin and asphaltene fractions. IFTs of synthetic DNAPLs containing asphaltenes and resins extracted from the tar samples will be measured to isolate the impact of composition on IFT behavior. This chapter was pub-lished in the peer-reviewed journal Environmental Science & Technology in 2012 [76] .
2. Mobilization of Manufactured Gas Plant Tar with Alkaline Flush-ing Solutions The objective of this work is to assess the feasibility of the use of alkaline (NaOH) solutions to reduce tar IFT, alter wetting behavior, and mobilize residual tars from porous media. Tar IFT and contact angle is measured as a function of NaOH concentration (0–1 wt. %), and a series of one-dimensional column studies is conducted with 0.2, 0.35, and 0.5% NaOH flushing solutions both with and without the addition of xanthan gum (XG) as a viscosifying agent. This chapter was published in the peer-reviewed journal Environmental Science & Technology in 2012 [75].
aqueous-phase PAH concentrations as the criteria for success.
CHAPTER 2
COMPOSITIONAL AND PH EFFECTS ON THE INTERFACIAL TENSION BETWEEN COMPLEX TAR MIXTURES AND
AQUEOUS SOLUTIONS 1
2.1 Introduction
Former manufactured gas plants (FMGPs) operated throughout the U.S. and Eu-rope between the early-1800s and mid-1900s and produced a flammable gas for heating and lighting for commercial and residential purposes. The U.S. Environ-mental Protection Agency (EPA) indicated that there may be as many as 50,000 FMGPs and related sites in the U.S, with the majority of these sites expected to have some level of contamination [217]. The primary contaminant of concern at FMGPs is tar, which was produced as a by-product of the gasification of coal and petroleum, and was frequently released into the environment either intentionally or through leaks in plant infrastructure [128].
FMGP tars possess a number of characteristics that make them among the most challenging of nonaqueous phase liquids (NAPLs) to remediate. They are generally denser than water (i.e., dense NAPLs or DNAPLs) and are usually significantly more viscous than water or other NAPLS, with reported dynamic viscosities ranging from 10 to 500,000 cP [18]. FMGP tars have exhibited the ability to alter the wetting characteristics of porous media, further decreasing 1Reprinted (adapted) with permission from Hauswirth, S. C., et al. (2012)Environmental Science
recovery efficiencies [88, 172]. Additionally, the tars are chemically complex and can compositionally vary greatly from site to site, and within a given site, due to differences in the source materials and processes used in the plant operation, as well as due to environmental alteration after being released into the subsurface [27, 54]. These variations can have significant implications for the physiochemical properties and subsurface behavior of tars, and subsequently to risk assessment and remedial design at contaminated FMGP sites.
of on-site [18, 70].
The overall goal of this work is to advance our understanding of the factors that influence the IFT of FMGP tars. The specific objectives of this study are the following: (1) to characterize tars from eight wells at two FMGPs, as well as a commercially-available coal tar using a variety of analytical techniques, (2) to measure the IFT as a function of pH for the tars, as well as synthetic DNAPLs containing asphaltenes and resins extracted from the tars, and (3) to correlate the results of the tar characterization with the pH-dependent IFT behavior of the tars.
2.2 Methods and Materials
2.2.1 Materials
ReagentsAll reagents were obtained from Fisher Scientific and were ACS Reagent grade or better. Standards for the 16 Priority Pollutant PAHs, benzene, toluene, ethylbenzene, and trimethylbenzenes were obtained from Spex Certiprep. Addi-tional compound standards were made from neat compounds obtained from Alfa Aesar, Acros Organics, and Ultra Scientific. Buffer solutions were produced for pH values of 3 (citrate), 5 (acetate), 7 (phosphate), 9 (borate), and 11 (carbonate) by dissolving appropriate quantities of each salt in distilled, deionized water (DDI) and titrating to the desired pH. Buffer strength was 1 mM with a normalized total ionic strength of 10 mM (with NaCl). Measurements of pH were conducted with an Orion Research EA 940 expandable ion meter.
Port-land FMGP operated from the late 1800s until at least 1950, using a coal gas process exclusively until the early 1900s at which point simultaneous water gas production was begun. By 1950, the plant produced solely carburetted water gas [214]. Samples were collected from two monitoring wells near a presumed tar source (P1 and P2) and from three wells 400–500 ft downgradient (P3–P5). It is believed that the tar has migrated through the subsurface from source area to the downgradient wells. The Baltimore FMGP operated over a similar time span as the Portland FMGP, and, while complete historic information is not available, is believed to have used water gas and CWG processes for most of the plant’s lifespan [214]. Five samples were collected from this site; two samples were col-lected from a well near a former gas holder during two sampling events (B1-07 and B1-09), one was collected from an adjacent well (B2), and one was collected from a well near a gas holder in a different area of the site (B3). A commercial coal tar (Fisher) was also included in this study (CT). This tar was produced from a byproduct coke oven operating at 1100◦
C.
2.2.2 Methods
Asphaltene and Resin DeterminationTwo methods were used to extract as-phaltenes from the tar. The first was the ASTM D2007 method, which has been used by a number of others investigating FMGP tars [17, 162, 242, 243]. With this method, n-pentane is added to the sample at a 10:1 ratio, the mixture is warmed, stirred, settled for 30 min, and filtered [10]. As noted in the petroleum literature, however, ASTM D2007 is an imperfect method for asphaltene determination, as it allows for the trapping of nonasphaltene compounds [4, 6, 199, 200]. There-fore, asphaltenes were extracted from all tars using an improved method which is described in detail elsewhere [75]. Briefly, this method uses an n-pentane to tar ratio of 40:1 ratio, sonication, and multiple reprecipitations from toluene.
Resins were extracted by reducing the n-pentane solutions from the asphal-tene extraction to 50 mL under nitrogen. This solution was passed through an SPE column containing 2 g of Florisil. The Florisil (60-100 mesh) was purchased from Acros Organics, activated at 130◦
C overnight, and stored in a vacuum des-iccator. The saturate and aromatic fractions were eluted with 75 mL of 4:1 n-pentane/dichloromethane (DCM). The resins were eluted from the column with a 1:1 toluene/acetone mixture, then dried under nitrogen and weighed.
fractions. Acids were extracted by shaking 2 g tar with 15 mL 1 M NaOH, centrifuging to separate layers, then pipetting off the aqueous phase. The organic phase was rinsed with three additional 10-mL portions of 1 M NaOH and the aqueous extracts collected. The basic aqueous phase was washed twice with DCM to remove neutral organic compounds, then acidified with HCl. The organic acids were extracted with three 5 mL portions of DCM. The DCM was dried with Na2SO4, then evaporated under a gentle stream of N2. The bases were extracted in the same manner using 10% H2SO4 containing 20 g/L Na2SO4.
Gas ChromatographyCompound identification was conducted with a Hewlett-Packard 5890 GC, coupled with an Hewlett-Hewlett-Packard 5971 quadrapole MS. NIST’s AMDIS deconvolution software and 2003 mass spectral database was used to analyze the MS data. Peak identification was based on MS library matches, com-parison with standard compounds, and Lee retention index values [21, 111, 117, 126, 220, 223, 229]. Quantification of 39 compounds was conducted on a Hewlett-Packard 5890 II GC equipped with a flame-ionization detector (GC-FID) using internal and external standards.
Fourier Transform Infrared Analysis Tar, asphaltene and resin samples were analyzed on a Nicolet Nexus 870 Fourier Transform Infrared (FTIR) Spec-trophotometer from 400-4000 cm−1
. Asphaltenes (0.1 g) were analyzed in KBr pellets; the tars and resins (0.1 g) were analyzed as films on KBr windows.
Average Molecular Weight A Knauer K-7000 vapor pressure osmometer (VPO) was used to determine the number-average molecular mass (MN) of the
tar samples and the isolated asphaltenes. Measurements were made in toluene at 60◦
Biphenyl ( ¯M = 154.21 g/mol) was used as a check standard and was analyzed every five runs or fewer. Measurements were made for solutions containing 5– 50 g/kg of the standard compound, tar, or asphaltene. The data was analyzed using the limiting slopes method by fitting data to the truncated virial equation [24]:
△E =aC+bC2 (2.1)
where△E is the voltage difference between the sample and reference thermistors,
Cis the concentration in g sample per kg solvent, andaandbare coefficients to be determined. The molar mass was then calculated from the following relationship:
MN =
K
a (2.2)
where K is the calibration constant of the instrument for the given solvent and temperature.
Interfacial Tension IFT was measured using the pendant drop method. An optical glass cell (Kr¨uss) was filled with buffer solution, and a drop of tar was suspended from a 1.6-mm outer diameter stainless steel needle. A digital video camera captured images of the drop, and Kr¨uss’s Drop Shape Analysis II (DSA2) software was used to determine the native IFT, for which △ρ = 1 g/cm3. The
sample. All measurements were conducted at 22±1◦
C. IFT was measured for all tar samples, as well as synthetic mixtures containing resins and asphaltenes from samples P1, P3, B1-07, B3, and CT. The accuracy of the method was confirmed with DCM.
2.3 Results
2.3.1 Composition
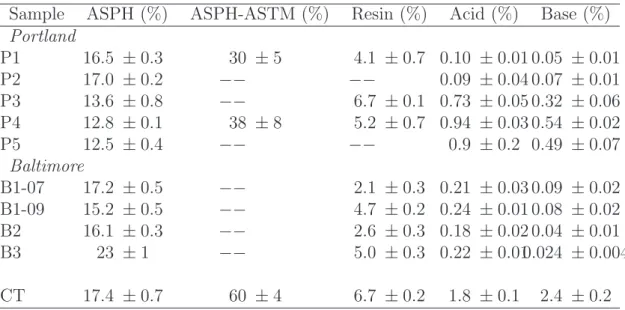
Fractionation The results of the asphaltene, resin, acid, and base analyses are provided in 2.1. Asphaltenes are a major fraction of all the tars in this study, with concentrations ranging from 12.5 to 23%. The highest asphaltene concen-tration, 23%, was observed for sample B3. Sample B1-07, collected in 2007, has a concentration of 17.2%, while the samples collected from the same area of the site in 2009, B1-09 and B2, have somewhat lower concentrations (15.2 and 16.1%, respectively). At the Portland site, concentrations in the near-source samples (P1, P2) are 16.5 and 17.0%, while downgradient samples (P3–P5) contain lower concentrations, ranging from 12.5–13.6%. The coal tar sample has an asphaltene concentration of 17.4%. As expected, asphaltene concentrations determined by ASTM D2007 were higher than those determined with the modified method by as much as three times. The difference between the methods is likely due to the trapping of non-asphaltene compounds that are not liberated during a simple precipitate-and-rinse procedure [4, 6, 199, 200].
Table 2.1: Concentration of Asphaltene, Resin, Acid, and Base Fractions. ± 95% CI.
Sample ASPH (%) ASPH-ASTM (%) Resin (%) Acid (%) Base (%)
Portland
P1 16.5 ±0.3 30 ±5 4.1 ±0.7 0.10 ±0.01 0.05 ±0.01 P2 17.0 ±0.2 −− −− 0.09 ±0.04 0.07 ±0.01 P3 13.6 ±0.8 −− 6.7 ±0.1 0.73 ±0.05 0.32 ±0.06 P4 12.8 ±0.1 38 ±8 5.2 ±0.7 0.94 ±0.03 0.54 ±0.02 P5 12.5 ±0.4 −− −− 0.9 ±0.2 0.49 ±0.07
Baltimore
B1-07 17.2 ±0.5 −− 2.1 ±0.3 0.21 ±0.03 0.09 ±0.02 B1-09 15.2 ±0.5 −− 4.7 ±0.2 0.24 ±0.01 0.08 ±0.02 B2 16.1 ±0.3 −− 2.6 ±0.3 0.18 ±0.02 0.04 ±0.01 B3 23 ±1 −− 5.0 ±0.3 0.22 ±0.010.024 ±0.004 CT 17.4 ±0.7 60 ±4 6.7 ±0.2 1.8 ±0.1 2.4 ±0.2
evident, sample CT and the downgradient Portland samples (P3–P4) tended to have higher concentrations, while the Baltimore and Portland near-source sam-ples tended to be lower. GC-MS analysis indicated that the composition of the resin fractions varied between samples. The resins from the near-source Portland and Baltimore samples were composed of oxygenated compounds, including 9,10-anthracenedione, indanone, fluorenone, and phenalenone. The resins from sample CT contained pyrridinic and phenolic compounds, but no oxygenated compounds were detected. The downgradient Portland samples contained a combination of oxygenated compounds, pyridines and phenols. It is likely that the resin frac-tions also contain high molecular weight compounds that cannot be observed by standard GC-MS approaches.
higher than those in the near-source samples. The acid concentrations in the Bal-timore samples are higher than the near-source Portland samples, while the base concentrations are similar or lower. GC-MS analysis indicated that for all tars the acid fraction is composed of phenols and hydroxy-PAHs, while the base frac-tion contains predominately pyridinnic compounds (e.g., quinolines, acridines, az-abenzopyrenes). While a similar suite of compounds were present for all tars, the chromatograms indicated significantly different distributions of the compounds. For the field-collected tars, peaks corresponding to the low molecular weight com-pounds (i.e., phenols, quinolines) were significantly less pronounced relative to the higher molecular weight compounds. This trend was observed most strongly in the near-source Portland and Baltimore samples. The chromatograms for the coal tar acid and base fractions indicated a relative enrichment in the lower molecular weight compounds (i.e., phenol, cresols, and quinoline).
provided in the Supporting Information (Table S1).
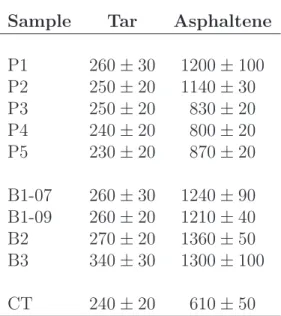
Molar MassThe ¯M of the tars are generally similar, and, with the exception of B3, range from 230 to 260 g/mol. Sample B3 has a somewhat higher ¯M of 340 g/mol. The ¯M of the asphaltenes extracted from the tars, however, exhibited a greater range. The Baltimore asphaltenes had the highest ¯M, with a range of 1210–1360 g/mol. The asphaltenes from the near-source Portland samples (P1 and P2) were 1200 and 1140 g/mol, while those of the downgradient Portland tars were between 800 and 870 g/mol. The ¯M of the CT asphaltenes was 610 g/mol, significantly lower than the FMGP field samples. It is well established that coal asphaltenes are smaller than petroleum asphaltenes, and it is likely that the variation observed here is a reflection of the source material used to produce the tar [13, 22, 64, 87, 187, 235].
Table 2.2: Average molar mass of tars and asphaltenes
Sample Tar Asphaltene
P1 260±30 1200±100 P2 250±20 1140±30
P3 250±20 830±20
P4 240±20 800±20
P5 230±20 870±20
B1-07 260±30 1240±90 B1-09 260±20 1210±40 B2 270±20 1360±50 B3 340±30 1300±100
CT 240±20 610±50
peak absorbance ratios. The use of ratios, as opposed to absolute peak areas, has the advantage of minimizing errors associated with FTIR sample preparation (i.e., variations in KBr pellet concentration or mixing) [196]. The A-factor provides a measure of aromaticity (with lower values indicating greater aromaticity) and is defined as a ratio of peak intensities as follows [60]:
A-factor = I(2860 cm −1
) +I(2930 cm−1 )
I(2860 cm−1
) +I(2930 cm−1
) +I(1601 cm−1
) (2.3)
where the peak at 1601 cm−1
corresponds to aromatic C−−C bonds, 2860 cm−1 to
−CH2 and−CH3 stretching, and 2930 cm−1
to−CH2stretching. The aromaticity would not be expected to play a major role in controlling the IFT pH-dependence, but does provide useful information regarding the structure of the tars and frac-tions.
The carbonyl index (IC=O) provides a measure of the carbonyl and carboxyl
content and is calculated based on the following peak area ratio [100]:
IC=O =
A(1800−1640 cm−1 )
A(1800−1640 cm−1
) +A(1640−1533 cm−1
) (2.4)
where the range 1800–1640 cm−1
includes carbonyl peaks and 1640–1533 repre-sents aromatic ring stretching and C−−C bonds. The IC=O includes carboxylic
acids, which are known to exhibit pH-dependent surface activity [28, 41, 42], and may therefore be expected to relate to the IFT behavior of the tars.
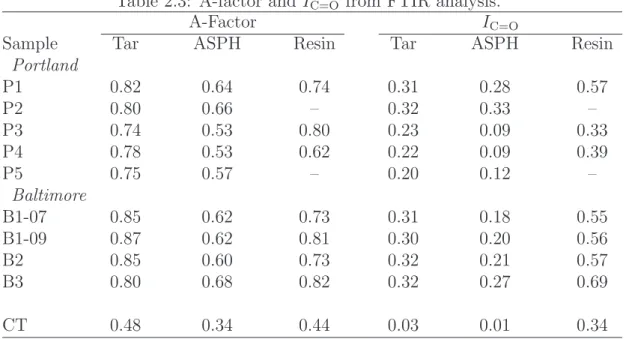
The A-factor and IC=O for tars, asphaltenes, and resins are presented in
Table 2.3: A-factor andIC=O from FTIR analysis.
A-Factor IC=O
Sample Tar ASPH Resin Tar ASPH Resin
Portland
P1 0.82 0.64 0.74 0.31 0.28 0.57
P2 0.80 0.66 – 0.32 0.33 –
P3 0.74 0.53 0.80 0.23 0.09 0.33
P4 0.78 0.53 0.62 0.22 0.09 0.39
P5 0.75 0.57 – 0.20 0.12 –
Baltimore
B1-07 0.85 0.62 0.73 0.31 0.18 0.55
B1-09 0.87 0.62 0.81 0.30 0.20 0.56
B2 0.85 0.60 0.73 0.32 0.21 0.57
B3 0.80 0.68 0.82 0.32 0.27 0.69
CT 0.48 0.34 0.44 0.03 0.01 0.34
A-factor). The CT sample exhibits significantly greater aromaticity than the FMGP tars. Asphaltenes for all samples are more aromatic than the correspond-ing tar, with the aromaticity of the resins generally fallcorrespond-ing between the tars and asphaltenes.
The IC=Ovalues follow a similar trend; they are highest for the Baltimore and
near-source Portland tars, somewhat lower for the downgradient Portland samples and lowest for the coal tar sample. The values are lower for the asphaltenes, and significantly higher for the resins.
2.3.2 Interfacial Tension
0 5 10 15 20 25 30 P1 P3 B1−07 B3 CT 0 5 10 15 20 25 30
Interfacial Tension (mN/m)
P1−ASPH P3−ASPH
B1−07−ASPH B3−ASPH CT−ASPH
3 5 7 9 11
0 5 10 15 20 25 30 pH P1 P3 B1−07 B3 CT c. a. b.
the IFT of the CT and the downgradient Portland samples (P3–P5) at pH 3 was about 30% lower than at pH 7.
At high pH, all field-collected FMGP tars exhibited a steep decrease in IFT. The greatest reductions between pH 7 and 11 were observed for the Baltimore (92– 95%) and near source Portland samples (86–88%). Somewhat lower reductions were observed for the downgradient Portland samples (71–79%), and very little reduction was observed for the coal tar (9%).
To investigate the impact of asphaltene and resin groups on IFT behavior, the IFTs of synthetic DNAPLs containing asphaltenes and resins from a representa-tive selection of samples were measured (Figure 2.1). The IFT behavior of the PAH mixtures containing asphaltenes was generally very similar to that of the corresponding tar, with a similar pattern of IFT decrease at low pH for the P3 and CT samples and high pH for all samples except CT.
2.4 Discussion
As noted in previous studies, the IFT of field-collected FMGP tars was found to decrease as pH was increased above pH 7 [17, 75, 242]. However, the effect was observed to vary significantly between tars. Unlike the field-collected sam-ples, the IFT of the coal tar sample exhibited only a minor decrease at high pH. Furthermore, the IFT of P3 at pH 11 was over two times greater than that of P1, despite having similar IFTs at pH 5 and 7 and being collected at the same site. Sample P3 also exhibited a decrease in IFT at pH 3, whereas P1 did not. The IFTs of synthetic PAH mixtures containing asphaltenes were very similar to those of the corresponding tar, indicating that, as noted elsewhere, asphaltenes are strong contributers to IFT behavior [242]. Resins, however, were observed to be more interfacially active, with mixtures containing 5% resins producing lower IFTs than mixtures containing 15% asphaltenes over the entire pH range. The tar IFT behavior, however, does not directly correlate with the concentration of resins or asphaltenes (Figure 2.4), indicating that additional factors must be at work.
0 0.1 0.2 0.3 0.4 0 5 10 15 20 25
IC=O
Max IFT − pH 11 IFT (mN/m)
(a)
0.4 0.6 0.8 1
0 5 10 15 20 25 A-Factor (b)
−2 −1.5 −1 −0.5 0 0.5
−2 0 2 4 6 8 10 12 LOG [BASE]
Max IFT − pH 3 IFT (mN/m)
(c)
600 800 1000 1200 1400
−2 0 2 4 6 8 10 12
ASPH ¯M
(d)
Figure 2.2: The reduction in IFT at high pH as a function of (a) IC=O and (b)
A-factor, and the reduction of IFT at low pH as a function of (c) the log of the extractable base concentration and (d) asphaltene molar mass. The lines represent linear least squares fits.
resins and asphaltenes) are excluded. The relatively high water-solubility of the extractable acids may decrease their interfacial activity due to a tendency to diffuse away from the tar-water interface and into the bulk aqueous phase. It has also, however, been found that phenols present in crude oil are not interfacially active at high pH [190], suggesting the possibility that the same is true for the extractable acid fraction (which is composed of phenolic compounds).
The IC=O value, alternatively, provides an indication of the concentration of
carbonyl groups. The very strong linear relationship (R2 = 0.96, p = 4×10⁻⁶ ) observed between the reduction from the maximum IFT to the IFT at pH 11 versusIC=O is shown in Figure 2.2(a). This correlation strongly suggests that the
[94, 116, 185, 190]. The fact that the reduction of IFT occurs at pH well above the pKa of most carboxylic acids (generally<5) is consistent with previous studies of
the IFT reduction associated with pure carboxylic acids and petroleum products [28, 41, 42, 72, 77, 165]. These studies have found that the apparent interfacial pKa of the acids is higher than the bulk pKa due to the formation of a double
layer, resulting in a lower H+concentration near the interface [28, 41, 116], or due to intermolecular forces between the acid molecules [101, 102].
It is also worth noting that the extractable acid and IC=O values are inversely
proportional (2.6a). The differences are most apparent when comparing the coal tar with the Baltimore samples, which are strongly suspected to be CWG tars. The coal tar contains a large amount of extractable acids (composed of primarily phenolic compounds) but very low IC=O values, while the opposite is true of the
CWG tars. This finding is consistent with investigations of coal and petroleum composition, which have found that oxygen is predominately present as phenolic and furanic groups in coals (and even more so in coal-derived liquids), as opposed to petroleum for which carbonyl/carboxyl groups are more pronounced [7, 22, 180, 226, 235].
The IFT reduction at low pH shows a strong positive correlation (R2 = 0.93,
p = 2×10⁻⁵
) with the log extractable base concentration, as shown in Figure 2.2(c). The protonation of basic compounds at low pH results in the formation of charged, surface active compounds and the observed reduction in IFT.
While the IC=O values and base concentrations explain the varied response of
properties would not be expected to impact an IFT-pH relationship, as they do not correspond to acidic or basic compounds. Rather, these correlations are reflective of overall structural differences between tars from different sources. Tars derived from coal maintain certain characteristics from the source material, most notably a high aromaticity with few, short aliphatic chains, a relatively low asphaltene
¯
M, and oxygen present primarily as hydroxyl groups [7, 22, 62, 180, 189, 235]. Each of these is observed for the coal tar used in this study. Similarly, the Bal-timore CWG tars retain petroleum-like characteristics: lower aromaticity, longer aliphatic chains, higher asphaltene ¯M, and greater carbonyl/carboxylic content [22, 235]. The near-source Portland samples are very similar to the Baltimore samples, and are presumed to be CWG tars. The downgradient Portland samples fall between the Baltimore and CT samples in terms of IC=O and asphaltene ¯M
but have an A-factor similar to the CWG tars, perhaps representing a mixture of multiple tar types, a tar derived from both coal and petroleum sources (e.g., a CWG process using bituminous rather than anthracite or coke), or possibly loss of the larger and more polar asphaltenes by means of environmental alteration (e.g., sorption of these compounds to porous media during tar migration).
2.5 Supporting Information
The information in this section was submitted toEnvironmental Science and
Tech-nology as Supporting Information to be made available online as a supplement to
the paper.
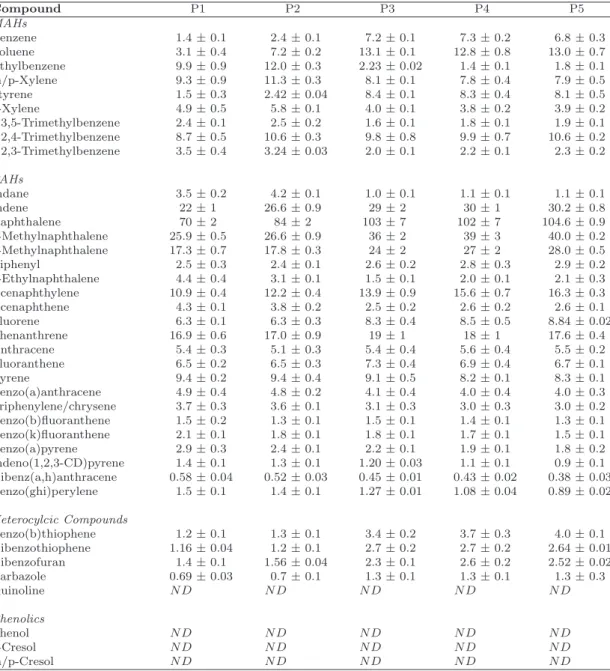
Table 2.4: Results of GC-FID Analysis for Samples P1–P5. All values are mg/g
± 2 standard deviations
Compound P1 P2 P3 P4 P5
MAHs
Benzene 1.4±0.1 2.4±0.1 7.2±0.1 7.3±0.2 6.8±0.3
Toluene 3.1±0.4 7.2±0.2 13.1±0.1 12.8±0.8 13.0±0.7
Ethylbenzene 9.9±0.9 12.0±0.3 2.23±0.02 1.4±0.1 1.8±0.1
m/p-Xylene 9.3±0.9 11.3±0.3 8.1±0.1 7.8±0.4 7.9±0.5
Styrene 1.5±0.3 2.42±0.04 8.4±0.1 8.3±0.4 8.1±0.5
o-Xylene 4.9±0.5 5.8±0.1 4.0±0.1 3.8±0.2 3.9±0.2
1,3,5-Trimethylbenzene 2.4±0.1 2.5±0.2 1.6±0.1 1.8±0.1 1.9±0.1
1,2,4-Trimethylbenzene 8.7±0.5 10.6±0.3 9.8±0.8 9.9±0.7 10.6±0.2
1,2,3-Trimethylbenzene 3.5±0.4 3.24±0.03 2.0±0.1 2.2±0.1 2.3±0.2
PAHs
Indane 3.5±0.2 4.2±0.1 1.0±0.1 1.1±0.1 1.1±0.1
Indene 22±1 26.6±0.9 29±2 30±1 30.2±0.8
Naphthalene 70±2 84±2 103±7 102±7 104.6±0.9
2-Methylnaphthalene 25.9±0.5 26.6±0.9 36±2 39±3 40.0±0.2
1-Methylnaphthalene 17.3±0.7 17.8±0.3 24±2 27±2 28.0±0.5
Biphenyl 2.5±0.3 2.4±0.1 2.6±0.2 2.8±0.3 2.9±0.2
2-Ethylnaphthalene 4.4±0.4 3.1±0.1 1.5±0.1 2.0±0.1 2.1±0.3
Acenaphthylene 10.9±0.4 12.2±0.4 13.9±0.9 15.6±0.7 16.3±0.3
Acenaphthene 4.3±0.1 3.8±0.2 2.5±0.2 2.6±0.2 2.6±0.1
Fluorene 6.3±0.1 6.3±0.3 8.3±0.4 8.5±0.5 8.84±0.02
Phenanthrene 16.9±0.6 17.0±0.9 19±1 18±1 17.6±0.4
Anthracene 5.4±0.3 5.1±0.3 5.4±0.4 5.6±0.4 5.5±0.2
Fluoranthene 6.5±0.2 6.5±0.3 7.3±0.4 6.9±0.4 6.7±0.1
Pyrene 9.4±0.2 9.4±0.4 9.1±0.5 8.2±0.1 8.3±0.1
Benzo(a)anthracene 4.9±0.4 4.8±0.2 4.1±0.4 4.0±0.4 4.0±0.3
Triphenylene/chrysene 3.7±0.3 3.6±0.1 3.1±0.3 3.0±0.3 3.0±0.2
Benzo(b)fluoranthene 1.5±0.2 1.3±0.1 1.5±0.1 1.4±0.1 1.3±0.1
Benzo(k)fluoranthene 2.1±0.1 1.8±0.1 1.8±0.1 1.7±0.1 1.5±0.1
Benzo(a)pyrene 2.9±0.3 2.4±0.1 2.2±0.1 1.9±0.1 1.8±0.2
Indeno(1,2,3-CD)pyrene 1.4±0.1 1.3±0.1 1.20±0.03 1.1±0.1 0.9±0.1
Dibenz(a,h)anthracene 0.58±0.04 0.52±0.03 0.45±0.01 0.43±0.02 0.38±0.03
Benzo(ghi)perylene 1.5±0.1 1.4±0.1 1.27±0.01 1.08±0.04 0.89±0.02
Heterocylcic Compounds
Benzo(b)thiophene 1.2±0.1 1.3±0.1 3.4±0.2 3.7±0.3 4.0±0.1
Dibenzothiophene 1.16±0.04 1.2±0.1 2.7±0.2 2.7±0.2 2.64±0.01
Dibenzofuran 1.4±0.1 1.56±0.04 2.3±0.1 2.6±0.2 2.52±0.02
Carbazole 0.69±0.03 0.7±0.1 1.3±0.1 1.3±0.1 1.3±0.3
Quinoline N D N D N D N D N D
Phenolics
Phenol N D N D N D N D N D
o-Cresol N D N D N D N D N D
![Figure 2.8: Hypothetical coal (a) and petroleum (b) asphaltene structures, based on [3, 22, 64, 87, 132, 138, 139, 177, 189, 201, 235], and consistent with the findings in this work.](https://thumb-us.123doks.com/thumbv2/123dok_us/8313852.2202345/56.892.195.701.117.337/figure-hypothetical-petroleum-asphaltene-structures-based-consistent-findings.webp)