Effectiveness of Poverty Reduction in the EU: A Descriptive
Analysis
Koen Caminada,Leiden University, Leiden Law School, Department of Economics Kees Goudswaard,Leiden University, Leiden Law School, Department of EconomicsPublished on behalf of thePolicy Studies Organization
Caminada, Koen and Goudswaard, Kees (2009) "Effectiveness of Poverty Reduction in the EU: A Descriptive Analysis,"Poverty & Public Policy: Vol. 1: Iss. 2, Article 5.
A Descriptive Analysis
Koen Caminada,Leiden University, Leiden Law School, Department of Economics
Kees Goudswaard,Leiden University, Leiden Law School, Department of Economics
Abstract
The European Union coordinates and encourages Member State actions to combat poverty, and to reform their social protection systems on the basis of policy exchanges and mutual learning (‘best practices’). This paper analyses the effectiveness of welfare state policies and especially social transfers in EU-countries in alleviating poverty. To indicate whether European economic integration may have had any impact on poverty reduction, we also include several non-EU15 countries as a benchmark into our analysis. We analyze on a cross-country basis the relationship between poverty rates and social effort, as measured by social expenditure ratios. We also correct these expenditure ratios for the impact of the tax system and for private social arrangements, using OECD methodology. Next, we compare poverty rates at the levels of market and disposable incomes; that is, before and after transfers, in order to analyze the effect of tax and transfer policies in reducing poverty, i.e., to determine the target efficiency of social transfers. We perform several tests with the most recent data.
Our results are less clear cut than earlier findings. We still find a quite strong negative relationship between the level of social expenditure and poverty among OECD countries. However, for EU-countries this relationship is weaker and there are substantial differences within the EU15. After correcting for the impact of taxes and for private social arrangements, the linkage between social effort and poverty levels becomes even weaker. Also, we do not find a strong relationship between levels of social spending and antipoverty effects of social transfers and taxes. At the program level, family programs and child support alleviate poverty to a large extent.
KEYWORDS:poverty, welfare states, Lisbon objectives, social indicators
Author Notes:
public finance. He has published many articles along with several books, covering issues with regard to budgetary policy, social policy, pensions and income distribution. Website with downloadable publications: http://www.law.leiden.edu/organisation/taxlawandeconomics/ economics/staff/goudswaard.html.
1. Introduction
Poverty alleviation has been a European objective since the Treaty of Rome in 1957. In 2000 the European Council (EC) adopted the goal that besides economic growth, social cohesion also should be strengthened in the European Union (EU) as part of the Lisbon Agenda. The open method of coordination was introduced as the means of spreading best practices and achieving greater convergence towards the main EU-goals. Social indicators were developed to monitor the improvements with respect to social cohesion.
The Lisbon Agenda has renewed interest in poverty alleviation across member states. However, a sizable proportion of the EU15 population still lives in poverty (16 percent), although both poverty structure and poverty rates vary across countries (from 10 percent in the Netherlands to about 20 percent in Greece, Spain and Portugal). Moreover, the average at-risk-of-poverty rates – an official EU social cohesion indicator – have even risen since the adoption of the Lisbon Agenda.
Some EU-countries are more effective in poverty reduction than others. What can explain these variations in effectiveness? Obviously, a range of policy strategies may be chosen to tackle poverty, including improving educational outcomes, improving job opportunities and stimulating labor force participation and reducing inequalities in health outcomes. This paper analyses the effectiveness of income transfer policies in EU-countries in alleviating poverty. To indicate whether European economic integration may have had any impact on poverty reduction, we also include in our analysis several non-EU15 countries as a benchmark. We analyze on a cross-country basis the relationship between poverty rates and social effort, as measured by social expenditure ratios. We also correct these expenditure ratios for the impact of the tax system and for private social arrangements, using OECD methodology.1 Next, we compare poverty rates at the levels of market and disposable incomes, that is before and after taxes and social transfers, in order to analyze the effect of tax and transfer policies in reducing poverty, i.e. to determine the target efficiency of social transfers. We will perform several tests with data from the Luxembourg Income Study (LIS), the Organization for Economic Co-operation and Development (OECD), and Eurostat (ECHP/EU-SILC) and compare our results with earlier findings on cross-country poverty research.
Finally, we will perform several partial analyses (using recent data from the European Commission,) in order to investigate to what extent variations at the social program level (such as old age pensions, child benefits) affect the measured effectiveness of the welfare state in alleviating poverty.
2. Policy on poverty alleviation
2.1 Europeanization of social policies. Member states of the EU remain
autonomous when it comes to the design and generosity of their social protection systems. Still, member states have accepted a certain degree of commitment in terms of social protection. This commitment is embodied in two recommendations accepted by the European Council in 1992.2 The first
recommendation, June 1992, dealt with common criteria concerning sufficient resources and social assistance in social protection systems. The second, July 1992, addressed the “convergence of social protection objectives and policies.” The motivation was that convergence seeks to guarantee the continuation and stimulation of the development of social protection within the internal market.
A new and important step was taken at the European Council in Lisbon, in 2000. For the EU the strategic goal was set for the decade ending in 2010 to become the most competitive and dynamic knowledge-based economy with sustainable economic growth and greater social cohesion. The economic and social agendas were thus explicitly coupled. When trying to reconcile equity and efficiency objectives, however, trade-offs may appear. It is well known from economic theory that a reduction of inequality (greater social cohesion) by means of redistribution creates labor market distortions and thus less economic efficiency. On the other hand, more recent research suggests that there are also welfare gains from income redistribution including poverty amelioration. The argument is that more equality contributes to public support for a dynamic market economy, which makes it possible to reap efficiency gains from competition.3 In fact, the challenge is to design optimal policies that achieve the best combination of equity and efficiency.
It was clear that to achieve the economic and social aims of the Lisbon Agenda, the social model in EU-countries needed to be modernized. To ensure long-term sustainability of the social security systems in the light of the aging process, participation rates should be increased.
The Treaty of Nice of 2001 took the social agenda forward. It was agreed to advance social policy on the basis of the open method of coordination, first employed with respect to employment policies. The method recognizes that social policy remains the responsibility of member states, under the principle of subsidiarity. It implies that member states define and evaluate common objectives and learn from each other how to reach these objectives. Best practices are disseminated and benchmarking is used. Coordination is based on evaluation and
2 Recommendations of the European Commission 92/441/EEC and 92/442/EEC.
3 See Boadway and Keen (2000). Empirical research indicates that inequality is negatively
peer pressure, but does not offer the option of sanctions. In Nice it was decided that member states should implement action plans for combating poverty and social exclusion and to define common objectives on social indicators. The indicators encompass financial poverty, income inequality, long-term unemployment, regional variation in employment rates, life expectancy and poor health.
Some consider these common indicators and the national action plans for social inclusion as significant progress towards integration along the social dimension.4 Others question this form of coordination.5 At least, this new mode of governance and the Lisbon agenda in general, have renewed the debate on poverty reduction in EU member states.
2.2 Combating poverty. In September/October 2006, member states adopted
renewed National Action Plans for Social Inclusion under the new streamlined open method of coordination (OMC) as one chapter of the National Report on Strategies for Social Protection and Social Inclusion. They presented the key priorities in member states’ efforts to promote greater social inclusion and make a decisive impact on the eradication of poverty and social exclusion (European Commission, 2007). A year later, the Commission gave special attention to the poverty among vulnerable groups, especially children, in their most recent Joint Report on Social Protection and Social Inclusion 2008 (European Commission,
2008). In most member states children are at greater risk of poverty than is the
overall population. In some countries more than 25 percent of children are at risk. In general, the Report indicates that social inclusion and social protection remains high on the political agenda for most member states. Some member states have reinforced their commitments by setting quantitative targets to reduce poverty (p.101).
Progress of social inclusion and of poverty reduction is monitored considering the performance in each member state on the basis of national indicators. In the European Union people are said to be in income poverty if their incomes are below 60 per cent of the median disposable income of households in their country, after adjusting for household size (equivalence scales).6 Based on this EU-criterion, the proportion of the EU-population who were at risk of poverty in 2005 was 16 percent. This means that around 72 million citizens were
4 For example, Atkinson (2002). 5 Among others, Leibfried (2002).
6 The evolution of the European Union will lead increasingly to question poverty-issues in a
considered as at risk of poverty in the EU25.7
The poverty problem is also striking in other highly-developed welfare states. Industrialized countries spend a large share of their income on social security, but poverty and social exclusion have not been eradicated. A sizeable proportion of the population lives in economic poverty in all industrial welfare states. According to the most common standards used in international poverty analyses, on average roughly one in ten households live in relative poverty in OECD countries.8 The persistence of poverty in industrial welfare states calls for
an explanation. If these welfare states offer elaborate systems of income maintenance, why is there still a considerable amount of poverty? Why are some countries more effective than others in this respect? What can explain these variations in effectiveness?
3. Research design
This paper will assess the relationship between welfare state effort and poverty alleviation in two steps. First we have to address the question of whether there is a correlation between the size of the welfare state and the incidence of poverty. Are high social expenditure rates associated with low poverty rates? Next we turn to the reduction of poverty rates through taxes and transfers and its relationship to welfare state effort. Our research design starts with the data to be used, because poverty rates and social expenditure rates can be collected from several sources. Next we discuss how to measure social effort and the effect of social transfers on poverty.
3.1 Measuring poverty incidence. For various reasons we use poverty rates from
different databases. The official EU-indicator for social cohesion is the at-risk-of-poverty rate after social transfers. This rate is defined as the share of persons with an equivalized disposable income below the risk-of-poverty threshold, which is set at 60 percent of the national median equivalized disposable income. For this indicator Eurostat data (ECHP/EU-SILC) are available for the period 1995-2005, but not for all member states.
For a further comparison, we will also use OECD poverty indicators: the poverty rate and the poverty gap. The OECD poverty rate is defined as the proportion of individuals with equivalized disposable income less than 50 percent of the median income. The poverty gap is the percentage difference between the average income of the poor and the 50 percent of median income poverty threshold. In this paper we will use OECD poverty data from the mid-1980’s until
7 Guio (2005).
8 Background information on this can be found in Atkinson et al. (1995), Behrendt (2002) and
the year 2000.9
Finally, we use also data from the Luxembourg Income Study (LIS). The LIS database contains income data files for 32 nations covering the period 1967 to 2005. We can analyze both the level and trend in poverty for a considerable period across a wide range of nations.
Following international standards, we use the relative rather than the absolute approach in measuring income poverty. This means that we define as poor those households that have an equivalent disposable income below a certain threshold representing the level of well-being of the population in a specific country. In our empirical analysis we use several thresholds for a poverty line (40 percent, 50 percent, and 60 percent), because the absolute number and also the structure of poverty differ dramatically depending on the threshold chosen.10 In most comparative studies the poverty threshold has been set at 50 percent of median equivalent disposable income, but we focus especially on the EU’s definition of the poverty line. For comparison, the official United States poverty line was just about 30 percent of median United States disposable post-tax household income in 2007.11
It should be noted that there have been controversial arguments regarding the issues in the measurement of poverty. These arguments have their own merits and shortcomings, and there has been little professional consensus among research with regard to the theoretical superiority of a particular way of measuring poverty.12 Moreover, the availability of reliable data restricts the possibilities for
9 Based on Förster and Mira d’Ercole (2005). Recently OECD (2008) published their study
‘Growing unequal? Income distribution and poverty in OECD countries’ recent data on poverty rates across countries up till the mid-2000s. In future research we will incorporate these data as well in our analyses.
10 Hagenaars and De Vos (1987) applied eight definitions for a poverty line to a 1983 household survey for the Netherlands: four definitions based on an absolute approach, three on a subjective and one a relative measure. The derived overall poverty rates ranged from 5.7 to 33.5 percent. 11 U.S. Census Bureau’s Current Population Survey reports for 2007 a poverty threshold for a
4-person family (weighted average) of $21,203; median disposable income for 4-4-person families amounts to $69,654. It should be noted that the U.S. poverty threshold is based on an absolute poverty standard, which remains fixed over time in real terms. According to U.S. poverty definition, 12.5 percent of the population was living in poverty in 2007. The U.S. official measure of poverty is typically in the form of the cost of a basket of goods and services required to assure minimum living conditions and indexed for price changes over time. While the threshold is adjusted annually based on inflation using the Consumer Price Index (CPI-U), the measure is absolute and has been essentially unchanged since it was developed by Mollie Orshansky at the United States Social Security Administration in 1964. The poverty threshold estimates the rate of poverty in the United States by determining the number of households whose annual income is below the set threshold for the household’s size. The determination of poverty is made based solely on income and cash benefits. Non-cash benefits, such as food stamps and housing subsidies, are not included in the determination of a household’s poverty.
conducting empirical research, which is especially problematic in cross-national studies. The aim of this paper is not to review definitional issues that arise in
assessing the extent of, and change in, poverty in western industrialized countries. We simply refer to a vast literature on the sensitivity of measured results regarding the choice of income definitions, poverty lines, appropriate equivalence scales, and other elements that may affect results in comparative poverty research.13
3.2 Measuring social effort. The overall result of quantitative studies seems to be
that there is strong negative correlation between poverty and social expenditures across European countries over the last 25 years.14 We use social expenditure data from the most recent OECD Social Expenditure Database (2007). This database contains aggregate and disaggregated data on social expenditures. The main social policy areas included are old age, survivors, family and other social programs. Both cash benefits and benefits in kind are included. In this study we will perform several tests both at the aggregate level and at the program level. It should be noted that social expenditure indicators at the aggregate level have their limitations: changes in expenditure ratios may not be caused by policy changes, but simply by the number of beneficiaries as a result of an ageing population or changes in unemployment levels due to cyclical factors (see also section 3.4)15.
To indicate whether it is Europeanization rather than globalization that has had any impact on poverty (and/or social expenditures), we include not only EU member states, but also other OECD-countries. These non-EU15 countries control for the effects of globalization.16
Other problems with social expenditure as an indicator for differences in social protection across countries are related to differences in the public/private mix in the provision of social protection and differences in tax features. Adema17 has developed indicators that aim to measure what part of an economy’s domestic production recipients of social benefits really draw upon, net total social expenditure. This requires capturing private social benefits and the impact of tax
13 Among others, see Atkinson (1987 and 2003), Hagenaars and De Vos (1987), Förster (1993),
Atkinson et al. (1995), Behrendt (2000), Gottschalk and Smeeding (1997 and 2000), Smeeding et al. (2000), Marcus and Danziger (2000), Atkinson and Brandolini (2001), Caminada and Goudswaard (2001), Förster and Pearson (2002), Smeeding (2005), Guio (2005), Förster and Mira d’Ercole (2005), and (other) papers listed in our reference section using data from the Luxembourg Income Study. See Bourguignon et al. (2002) for a more elaborated paper on the evaluation of poverty impact of economic policies.
14 Behrendt (2002). 15 Kühner (2007).
16 It should be mentioned that European non-EU27 countries as Switzerland or Norway may also
systems on social effort. For private programs to be considered ‘social’, they need to have a social purpose and contain an element of interpersonal redistribution and/or compulsory participation.18 The distinction between public and private social protection is made on the basis of whoever controls the relevant financial flows. Private social benefits may be important for our analysis. In so far as they contain an element of redistribution they may also have an impact on poverty levels. For example, private but mandatory pensions (in the second pillar) may have an effect on poverty incidence among the elderly. However, the impact of private social benefits is likely to be smaller than the impact of public social transfers.
The impact of the tax system on the social effort is threefold. In some countries cash benefits are taxable as a rule, in other countries they are not. In the former countries net social effort is less than suggested by gross spending indicators. Indirect taxation of consumption by benefit recipients is another factor that may blur the picture. When indirect taxes are higher, benefit recipients have less effective purchasing power. Also, the tax system can be used for social purposes. Tax deductions (e.g. family tax allowances) replace direct expenditures in some cases. The Earned Income Tax Credit in the United States is a good example of a tax break, which has the features of a social protection program. To control for the impact of tax systems on social spending, we will use the OECD data on net social expenditure. Unfortunately, these data only cover a relatively short time period (1993-2003) and are not available for all EU member states.
The most recent figures for the net social expenditure as percentage of GDP, based on the 2007 edition of the Net Social Expenditure data, indicate that accounting for the impact of taxes and of private social expenditure has an equalizing effect on levels of social effort across countries.19
3.3 Measuring the effects of taxes and transfers. Usually the impact of social
policy on income poverty is calculated in line with the work of Musgrave, Case and Leonard,20 i.e. statutory or budget incidence analysis. Important issues of tax/transfer shifting and behavioral responses are ignored.21 A standard analysis
of the anti-poverty effect of taxes and income transfers is to compare
18 Private social programs can be mandatory or voluntary. Mandatory private benefits are often
incapacity related. For example, in several countries employers are obliged to provide sickness benefits. Occupational injuries and accidents (‘risque professionel’) can also be covered by mandatory private insurances. A number of EU member states have supplementary employment-based pension plans with mandatory contributions, employment-based on a funding system. Voluntary private social security covers a wide range of programs, of which private pension plans and private social health insurance constitute major components.
19 See Caminada and Goudswaard (2005) for details. 20 Musgrave, Case, Leonard (1974).
transfer poverty and post-tax-transfer poverty. To compare the antipoverty effectiveness of taxes and income transfers among western welfare states, poverty rates will be decomposed into the level of market-generated poverty, the overall level of welfare efforts, and the poverty reduction efficiency of taxes and transfers.22
A comparison between the standard at-risk-of-poverty rate and the hypothetical situation where social transfers are absent, other things being equal, shows that such transfers have an important redistributive effect that helps to reduce the number of people who are at risk of poverty.23 In the absence of all social transfers, the average poverty risk for EU member states would be considerably higher than it is in reality. It should however be noted that the indicator of poverty risk before social transfers must be interpreted with caution.24 First, no account is taken of measures that, like social cash transfers, can have the effect of raising the disposable incomes of households and individuals; namely transfers in kind, tax credits and tax allowances. Second, the pre-transfer poverty risk is compared to the post-transfer risk keeping all other things equal – namely, assuming unchanged household and labor market structures, thus disregarding any possible behavioral changes that the situation of absence of social transfers would involve. Kim showed that both the generosity and efficiency of the tax/transfer system may influence the level of pre-tax-transfer poverty. So this standard approach overestimates the antipoverty effectiveness of generous and/or targeted welfare systems.
3.4 Tests on the linkages between social protection and poverty. National
preferences for social protection differ substantially across countries. Anglo-Saxon countries especially do not seem to be prepared to sustain the high protection levels prevailing in other countries with the same level of income. This may be an expression of cultural differences within the group of OECD countries. These differences could point to variance in the antipoverty nature of social systems as well. Anglo-Saxon welfare states (especially the United States) rely more heavily on social arrangements as far as pensions, health care and other programs are concerned. However, private social programs may generate a more limited redistribution of resources than public ones, and tax advantages towards private pension and health plans are more likely to benefit the rich. Private employment-related social benefits mostly re-allocate income between the (formerly) employed population. The same holds for fiscal advantages related to, for example, supplementary private pension plans. In general, we do expect that
22 Cf. Kim (2000a).
23 Among others, see Behrendt (2002), Smeeding (2005), Förster and Pearson (2002), Guio (2005)
private schemes will generate less antipoverty effects than public programs.
We perform a cross-county analysis of the relationship between public and private social expenditures and poverty rates at one point in time. The material presented is only descriptive and does not explain poverty levels and poverty
structure. Such an analysis should ideally be based on a theory, which would have to address at least the following cross-national differences: differences in labor markets that affect earnings of individual household members; demographic differences, such as the aging of the population and growth of single parent households, which affect both family needs and labor market decisions; and differences across countries in tax and transfers policies that not only affect family income directly, but also may affect work and investment decisions.25 Two recent seminal books edited by Kakwani and Silber in 2007 and 2008 present the panorama of the many dimensions of poverty from various disciplines. A fully-fledged model should be developed to assess the relative performance of social factors and the economic development. Such a comprehensive approach is far beyond the scope of this paper. We simply employ bi-variate regressions on the relationship between social expenditures and poverty rates, so one could argue that omitted (macroeconomic) variables cause bias. Differences in social effort across countries at one point in time can be the result of cyclical factors.
Another important point to keep in mind is that, while several other strategies can be chosen to alleviate poverty we only analyze the impact of transfers. In fact, several EU member states are increasingly emphasizing strategies to facilitate labor force participation of lower income groups.26 This may also be an effective strategy to tackle poverty.
4. Poverty rates: some descriptive statistics
4.1 Poverty level. Figure 1 reports poverty profiles for 30 industrialized countries
around the year 2001. Data are taken from LIS. In order to account for different intensities of poverty, three different poverty lines are applied. Households are deemed to live in ‘extreme poverty’ if their income remains below a poverty line of 40 percent of median equivalent income; a poverty line of 50 percent demarcates ‘severe poverty’, whereas households with an income between 40 and 50 percent of median equivalent income are considered as living in ‘moderate poverty’. Households whose income exceeds the poverty line of 50 percent, but remains below 60 percent of median equivalent income are considered as living ‘in poverty’. In Figure 1 countries are ranked according to their poverty rate at the 60 percent level, while the shading of the bars shows different intensities of poverty or low income.
Figure 1: Percent of poverty for total population in 30 countries, around 2001 Total poverty 0 5 10 15 20 25 30 C ze ch R e p . 19 96 N e th e rla nds 19 99 Sw ed en 2 0 0 5 S lo v a k R e p. 19 96 N o rw a y 20 00 Fi n la n d 20 00 H u n g a ry 19 99 D e n m a rk 20 04 G e rm a n y 20 00 A u st ri a 20 00 Fr a n ce 20 00 Lu x e m b o u rg 20 04 R o m a n ia 19 97 S lo v e n ia 19 99 S w it ze rl a n d 20 02 R .O .C . T a iw a n 20 05 B e lg iu m 2 0 0 0 C a na d a 20 00 U K 20 04 P o la nd 19 99 It a ly 20 00 A u st ra lia 20 03 S p a in 20 00 G re e ce 20 00 Ir e la n d 20 00 Is ra e l 20 01 U S A 20 04 M e x ic o 20 04 R u ss ia 20 00 me a n L IS
60% poverty line 50% poverty line 40% poverty line
Note: Poverty rates are measured as the proportion of individuals with equivalized disposable income less than 40, 50, and 60 percent of the median income of the entire population. Source: own calculations based on LIS Key figures (www.lisproject.org)
Note that a considerable share of the population lives in relative income poverty in all industrialized welfare states, yet with a large variation of poverty rates and structure across countries. All industrialized countries in this sample display poverty rates between a range of 10.5 to 25.6 percent of the household population if the poverty line is set at 60 percent of median equivalent household income. The lowest poverty rate is found in the Czech Republic, followed by the Netherlands, Sweden, Slovak Republic, Norway, and Finland. At the very bottom of this ranking, we find the United States, Mexico and Russia with a poverty rate of almost a quarter of the household population.27
When large proportions of the population are clustered just around the threshold of 60 percent, small changes in their income can lead to large changes in poverty. To examine the sensitivity of results to alternative choices of the poverty line, Figure 1 also shows poverty rates measured with lower thresholds. It turns out that, in all OECD countries reviewed, a significant share of the
27 Notten and De Neubourg (2007) estimates, according to the Orshansky-methodology for years
population is clustered between the 50 and 60 percent thresholds. This explains also why poverty statistics from the OECD (with a threshold of 50 percent) are much lower compared to the official EU-indicator (with a threshold of 60 percent of median equivalized income).
Other poverty indices would alter the country-ranking to some extent. However, the relative poverty patterns found here correspond roughly to the results found in other cross-national comparisons of poverty using income data from the LIS database and/or OECD.28 In spite of differences in the measurement
of poverty and the databases used, these studies have consistently found that there is a large difference in the extent of poverty among welfare states. In general, Scandinavian and Benelux countries have the lowest poverty rates, followed by continental European countries. Anglo Saxon welfare states have relatively higher poverty rates. Among them, the extent of poverty is highest in the United States.
4.2 Poverty over time. Next, we illustrate trends in several poverty indicators. We
employ both the poverty indicator used by the EU and poverty indicators from the OECD. Remarkably, according to the EU-indicator, poverty barely declined on average between 2000 and 2005. Poverty rates after social transfers even rose in Denmark, Ireland, Luxembourg, and Spain during this period.29
28 See Kim (2000a).
29 This result should be interpreted with caution, because there is a disruption in the time series of
Table 1: EU at-risk-of-poverty rates
1995 2000 2003 2005
Austria 13 12 13 12
Belgium 16 13 15 15
Denmark 10 : 12 12
Finland : 11 11 12
France 15 16 12 13
Germany 15 10 15 13
Greece 22 20 21 20
Ireland 19 20 20 20
Italy 20 18 : 19
Luxembourg 12 12 10 13
Netherlands 11 11 12 11
Portugal 23 21 19 20
Spain 19 18 19 20
Sweden : : : 9
United Kingdom 20 19 18 19
Mean EU15 Members (14) 16.5 15.5 15.2 15.6
Standard deviation 4.11 3.90 3.66 3.85
Coefficient of variation 0.248 0.252 0.241 0.230
Note: EU15 (14) are all EU15 countries excluding Sweden
Source: Structural Indicators EU - Social Cohesion (Eurostat: ECHP/EU-SILC); and own calculations.
Using the OECD definition, poverty rates in the EU even show a rather substantial increase from the mid-1980s until 2000 (Table 2). Poverty rates rose in 75 percent of EU-countries: Austria, Finland, Germany, Greece, Ireland, Italy, Luxembourg, Netherlands, and the United Kingdom.
Table 2: OECD poverty rates
Mid-1980s 1990s 2000
Mid-Change 2000- mid- 1980s
Change 2000- mid-1990s
Australia 12.2 9.3 11.2 -1.0 1.9
Austria 6.1 7.4 9.3 3.2 1.9
Canada 11.6 9.5 10.3 -1.3 0.8
Denmark 5.3 3.8 4.3 -1.0 0.6
Finland 5.1 4.9 6.4 1.3 1.5
France 8.0 7.5 7.0 -0.9 -0.4
Germany 6.4 9.1 9.8 3.4 0.6
Greece 13.4 13.9 13.5 0.1 -0.3
Ireland 10.6 11.0 15.4 4.8 4.4
Italy 10.3 14.2 12.9 2.6 -1.3
Japan 11.9 13.7 15.3 3.3 1.6
Luxembourg 5.4 5.5 5.5 0.1 -0.1
Mexico 20.7 21.7 20.3 -0.4 -1.5
Netherlands 3.1 6.3 6.0 2.9 -0.3
New Zealand 5.8 7.8 10.4 4.6 2.6
Norway 6.9 8.0 6.3 -0.6 -1.7
Sweden 6.0 3.7 5.3 -0.7 1.6
Turkey 16.4 16.2 15.9 -0.5 -0.3
United Kingdom 6.9 10.9 11.4 4.5 0.5
United States 17.9 16.7 17.1 -0.9 0.4
Mean OECD-20 9.5 10.1 10.7 1.2 0.6
Standard deviation 4.7 4.6 4.4 -0.3 -0.2
Coefficient of variation 0.492 0.461 0.414 -0.077 -0.048
Mean EU15 Members 7.2 8.2 8.9 1.7 0.7
Standard deviation 2.8 3.5 3.6 0.8 0.0
Coefficient of variation 0.384 0.428 0.399 0.015 -0.029
Notes:
-Poverty rates are measured as the proportion of individuals with equivalized disposable income less than 50 percent of the median income of the entire population.
- “2000” data refer to the year 2000 in all countries except 1999 for Australia, Austria and Greece; 2001 for Germany, Luxembourg, and New Zealand; and 2002 for Mexico and Turkey; "Mid-1990s" data refer to the year 1995 in all countries except 1993 for Austria; 1994 for Australia, Denmark, France, Germany, Greece, Ireland, Japan, Mexico and Turkey; and 1996 for New Zealand; "Mid-1980s" data refer to the year 1983 for Austria, Denmark and Sweden; 1984 for Australia, France, Italy and Mexico; 1985 for Canada, Japan, the Netherlands, Spain and the United Kingdom; 1986 data for Finland, Luxembourg, New Zealand and Norway; 1987 for Ireland and Turkey; 1988 for Greece; and 1989 for the United States.
The number of people with a low income is only one way of measuring poverty. Another relevant measure is the intensity of poverty. The poverty gap measures the percentage difference between the average income of the poor and the 50 percent of median income poverty threshold. Also, these OECD equity data are available from the mid-1980’s until the year 2000.30 Note that the poverty gap has on average been reduced in the EU from the mid-1980s until 2000. But the reduction of the poverty gap has been larger in OECD-countries outside the EU.
Table 3: OECD poverty gap
Mid-1980s Mid-1990s 2000 Change
2000 - mid-1980s
Change 2000 -
mid-1990s
Australia 24.2 31.5 26.7 2.5 -4.8
Austria 27.6 20.7 30.0 2.3 9.3
Canada 19.8 29.9 32.0 12.2 2.0
Denmark 22.1 25.6 24.1 2.0 -1.5
Finland 25.9 21.8 20.7 -5.2 -1.0
France 32.9 23.4 25.8 -7.1 2.4
Germany 22.9 23.6 31.7 8.8 8.0
Greece 32.8 29.9 29.7 -3.0 -0.2
Ireland 23.0 12.0 24.0 1.0 12.0
Italy 29.9 37.2 36.5 6.6 -0.7
Japan 0.0 35.0 36.1 36.1 1.0
Luxembourg 18.1 17.7 17.3 -0.7 -0.4
Mexico 36.4 37.1 36.0 -0.4 -1.1
Netherlands 32.4 27.3 29.4 -3.0 2.1
New Zealand 34.2 29.1 23.3 -10.9 -5.8
Norway 22.5 28.1 28.2 5.7 0.1
Sweden 40.2 30.7 26.1 -14.2 -4.6
Turkey 29.2 28.6 27.8 -1.4 -0.8
United Kingdom 16.0 19.6 22.9 6.9 3.3
United States 33.6 34.1 34.7 1.1 0.6
Mean OECD-20 26.2 27.5 28.1 2.0 1.0
Standard deviation 8.7 6.5 5.2 -3.5 -1.3
Coefficient of variation 0.333 0.239 0.185 -0.149 -0.054
Mean EU15 Members 27.0 24.1 26.5 -0.5 2.4
Standard deviation 6.7 6.4 5.0 -1.7 -1.4
Coefficient of variation 0.249 0.264 0.189 -0.060 -0.075
Notes: continued on next page
Notes for Table 3:
-Poverty gaps are measured as the percentage difference between the average income of the poor and the 50 percent of median income poverty threshold.
-“2000” data refer to the year 2000 in all countries except 1999 for Australia, Austria and Greece; 2001 for Germany, Luxembourg, and New Zealand; and 2002 for Mexico and Turkey; "Mid-1990s" data refer to the year 1995 in all countries except 1993 for Austria; 1994 for Australia, Denmark, France, Germany, Greece, Ireland, Japan, Mexico and Turkey; and 1996 for New Zealand; "Mid-1980s" data refer to the year 1983 for Austria, Denmark and Sweden; 1984 for Australia, France, Italy and Mexico; 1985 for Canada, Japan, the Netherlands, Spain and the United Kingdom; 1986 data for Finland, Luxembourg, New Zealand and Norway; 1987 for Ireland and Turkey; 1988 for Greece; and 1989 for the United States.
‘Source: OECD Poverty Indicator Data based on Förster and Mira d'Ercole (2005); and own calculations
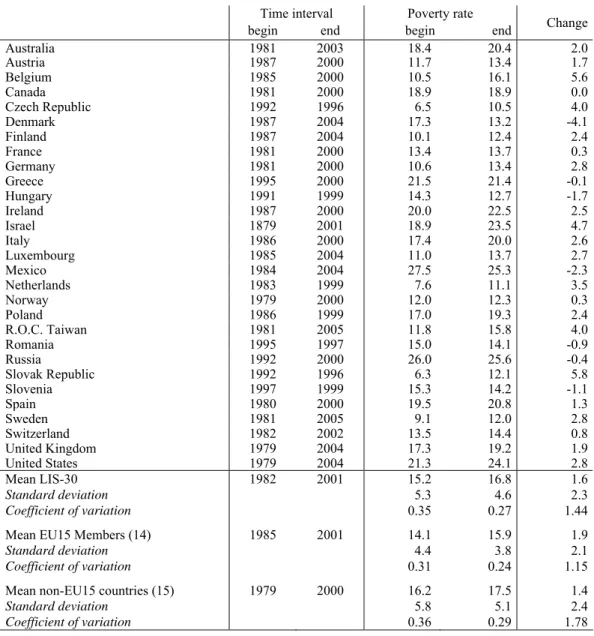
Table 4: Poverty for total population in 30 countries, 1979-2005 (poverty line 60% median income)
Time interval Poverty rate
begin end begin end Change
Australia 1981 2003 18.4 20.4 2.0
Austria 1987 2000 11.7 13.4 1.7
Belgium 1985 2000 10.5 16.1 5.6
Canada 1981 2000 18.9 18.9 0.0
Czech Republic 1992 1996 6.5 10.5 4.0
Denmark 1987 2004 17.3 13.2 -4.1
Finland 1987 2004 10.1 12.4 2.4
France 1981 2000 13.4 13.7 0.3
Germany 1981 2000 10.6 13.4 2.8
Greece 1995 2000 21.5 21.4 -0.1
Hungary 1991 1999 14.3 12.7 -1.7
Ireland 1987 2000 20.0 22.5 2.5
Israel 1879 2001 18.9 23.5 4.7
Italy 1986 2000 17.4 20.0 2.6
Luxembourg 1985 2004 11.0 13.7 2.7
Mexico 1984 2004 27.5 25.3 -2.3
Netherlands 1983 1999 7.6 11.1 3.5
Norway 1979 2000 12.0 12.3 0.3
Poland 1986 1999 17.0 19.3 2.4
R.O.C. Taiwan 1981 2005 11.8 15.8 4.0
Romania 1995 1997 15.0 14.1 -0.9
Russia 1992 2000 26.0 25.6 -0.4
Slovak Republic 1992 1996 6.3 12.1 5.8
Slovenia 1997 1999 15.3 14.2 -1.1
Spain 1980 2000 19.5 20.8 1.3
Sweden 1981 2005 9.1 12.0 2.8
Switzerland 1982 2002 13.5 14.4 0.8
United Kingdom 1979 2004 17.3 19.2 1.9
United States 1979 2004 21.3 24.1 2.8
Mean LIS-30 1982 2001 15.2 16.8 1.6
Standard deviation 5.3 4.6 2.3
Coefficient of variation 0.35 0.27 1.44
Mean EU15 Members (14) 1985 2001 14.1 15.9 1.9
Standard deviation 4.4 3.8 2.1
Coefficient of variation 0.31 0.24 1.15
Mean non-EU15 countries (15) 1979 2000 16.2 17.5 1.4
Standard deviation 5.8 5.1 2.4
Coefficient of variation 0.36 0.29 1.78
Poverty rates across the 30 selected LIS-countries (applying a 60 percent threshold to calculate poverty rates) increased on average with 1.6 percentage points during this period. Over time cross-country differences did not alter much on average. However, in some countries poverty rose at a remarkably high speed (over 3 percentage points): the Netherlands, Czech Republic, Taiwan, Israel, Belgium, and Slovak Republic.
Country clustering based on poverty rates is quite different from that of welfare state regimes. Among the countries with low poverty rates we find representatives of the social democratic regime and the corporatist regime. Likewise the nations with higher rates of poverty represent several regime types and both members of the EU15 and the new member states.
4.3 Vulnerable groups: Decomposition of poverty by age groups. Now we turn to
groups typically over-represented among the poor - the vulnerable for whom social programs are supposed to guarantee a minimum income. We are particularly interested in how the social transfers affect their poverty status. For each of the vulnerable groups, we report their poverty rates and then assess the impact of transfers on their poverty rates.
Figure 2 reports poverty profiles for children and elderly for 30 industrialized countries based on LIS-data. Again, three different poverty lines are applied (40, 50 and 60 percent of equivalized median income). Countries are ranked according to their poverty rate at the 60 percent level; the shading of the bars show different intensities of poverty or low income.
On average, across all countries, around 18.4 percent of all children fell below the 60 percent poverty threshold around 2001. Child poverty rates are especially low in the Nordic countries, where fewer than 10 percent of all children are poor. Child poverty is high in Mexico, the United States, and Russia (around 30 percent), but also in Italy, Ireland, Spain, and the United Kingdom, where it is above 20 percent. In most countries, relative poverty rates among children are also higher than for the entire population (compare Figure 1 with Figure 2), but with much variation across countries. These differences suggest that specific factors increase risks of poverty for children in some OECD countries.31
Figure 2: Poverty rates children and elderly in 30 countries, around 2001 Child poverty 0 5 10 15 20 25 30 35 N o rw ay 20 0 0 Fi n lan d 2 000 D e nmar k 2 0 0 4 Swed en 20 05
Czech Rep. 19
96 Neth erl a nd s 1 999 Sl ovenia 1 999 Be lg iu m 2 0 0 0 Ge rma n y 20 00 R. O. C . Tai w an 2005 H u ng ar y 1 9 9 9 A u stria 2 000 Fr an ce 20 0 0 S lov a k R e p . 19 96 Ro ma ni a 19 97 S w it ze rl a nd 200 2 G ree ce 20 0 0 Lu xem b o u rg 2 004 Spain 2 000 Irel a n d 20 00 Austral ia 2 003 Ca na da 20 0 0 UK 2 004 Ita ly 2 0 0 0 P o la nd 19 9 9 Isr a e l 20 01 Ru ssia 2 000 USA 2 004 M e xi co 200 4 me an LIS
60% poverty line
50% poverty line
Figure 2, continued: Poverty rates children and elderly in 30 countries, around 2001 Poverty elderly 0 10 20 30 40 50 60 Luxembour g 2004 P o la nd 1999 Hungar y 199 9 Net h erland s 1999 C ana da 2000 France 2000 Ge rmany 2 000 R o mania 19 97 Sw ede n 2 005 A u s tria 2000 Cz
ech Rep. 1
996 It a ly 2000 R u ss ia 2000 Fi n la
nd 2000 UK
2004
S
lovenia 1999 No
rw a y 2000 S w itz e rl and 200 2 Is ra el 2 001 Denmar k 2004
Spain 2000 U
S A 2004 Mexic o 200 4 Be lg iu m 2 0 0 0 Greece 2000 R .O.C . Ta iw an 2005 A u s tralia 2003 Irelan d 2 000 Sl o v ak R e p. 19 96 me an LI S
60% poverty line
50% poverty line
40% poverty line
Note: Poverty rates are measured as the proportion of individuals with equivalized disposable income less than 40, 50, and 60 percent of the median income of the entire population.
Traditionally the elderly are also seen as a vulnerable group, because their economic wellbeing largely depends on the social protection system. On average, across all countries, 26.7 percent of the elderly live in poverty (60 percent threshold) which is almost twice as high as the average of total population. Cross-country differences are large, with relatively good figures for Luxembourg, Poland, Hungary, and the Netherlands. In several countries poverty exceeds 1/3 of the elderly: in the United States, Mexico, Belgium, Greece, Taiwan, Australia, and Ireland.
To sum up, our analysis of poverty of vulnerable groups identifies serious holes in the safety net of several countries. In several member states the safety net offers little assistance to vulnerable groups.32 On average, child poverty is a lesser problem than is the poverty of elderly in these nations. But single parents and their children generally have the highest poverty rates, while those in two-parent units, mixed units, and the childless experience the least poverty.
5. Welfare state effort and the alleviation of poverty: an empirical analysis
5.1 Linkages between poverty rates and gross social spending. Traditionally,
welfare state typologies have been largely based on the overall level of social expenditure. Quantitative studies have found a strong negative relationship between poverty rates and the level of social expenditure over the last 25 years; this finding has now been well established in empirical studies.33 In other words, countries with a higher level of welfare expenditure are likely to have lower poverty rates.
Figure 3 illustrates that there is indeed a strong significant correlation between the level of gross public social expenditure as a percentage of GDP in
2003 and poverty rates across countries around the year 2000 (ρ<0.01). Countries with higher gross public social expenditure ratios in 2003 tend to have lower
poverty rates than countries with lower expenditure ratios. So, our simple linkage exercise does confirm the general finding that more social spending generates less poverty across countries. However, our results are less clear cut than earlier findings. We find an effect which is less strong in EU-countries compared to non-EU15 countries, possibly under the influence of welfare state reforms.34 This result does not depend on the poverty line applied (40, 50 or 60-percent-of-median-income poverty threshold); see Figure 3. Moreover, we did a sensitivity
32 Cf. Sainsbury and Morissens (2002).
33 See Förster (1993), Kenworthy (1999), Kangas and Palme (2000), Kim (2000a), Sainsbury and
Morissens (2002), Cantillon et al. (2002), Behrendt (2002), Förster and Pearson (2002), Brady (2004), Scruggs and Allen (2005), Smeeding (2005), Förster and Mira d’Ercole (2005), and Pestieau (2006, pp.16-17).
analysis with the OECD poverty data and found the same result: higher gross public social expenditure ratios generate less poverty across countries, although
this effect is less strong in EU-countries compared to non-EU15 countries.
Figure 3: Linkage between gross public social expenditure and LIS poverty rates across 19 countries, around 2000-2003.
Non-EU15 countries EU15 countries
40% poverty line 40% poverty line
y = -1.119x + 24.7 R2 = 0.692
0 10 20 30 40
0 5 10 15 20
Poverty rate So c ia l e x p e nd it ur e
y = -1.206x + 29.5 R2 = 0.334
0 10 20 30 40
0 5 10 15 20
Poverty rate So c ia l e x p e nd it ur e
50% poverty line 50% poverty line
y = -0.831x + 26.7 R2 = 0.639
0 10 20 30 40
0 5 10 15 20 25
Poverty rate So c ia l e x p e nd it ur e
y = -0.745x + 31.0 R2 = 0.413
0 10 20 30 40
0 5 10 15 20 25
Poverty rate So c ia l e x p e nd it ur e
60% poverty line 60% poverty line
y = -0.701x + 29.8 R2 = 0.583
0 10 20 30 40
0 5 10 15 20 25
Poverty rate So c ia l e x p e n d it ur e
y = -0.708x + 35.4 R2 = 0.404
0 10 20 30 40
0 5 10 15 20 25
Poverty rate So c ia l e x p e nd it ur e
Non-EU15 countries: Australia, Canada, Czech Republic, Mexico, Norway, Slovak Republic, and the United States
EU15 countries: Austria, Belgium, Denmark, Finland, France, Germany, Ireland, Italy, Netherlands, Spain, Sweden, and the United Kingdom
5.2 The impact of the tax system. Up till now, our results support the conventional
view that extensive social-welfare programs reduce poverty. However, these findings may be influenced by ignoring the impact of the tax system. In Figure 4 we have corrected the expenditure ratios for the impact of the tax system, using the OECD data mentioned earlier. We have linked the poverty rates across countries around the year 2000 to net social expenditures of 2003. We again apply
the 40-, 50-, and 60-percent-of median income poverty thresholds, and we use LIS-data on poverty.
Figure4:Linkage between net public social expenditure and LIS poverty rates across 19 countries, 2000-2003
Non-EU15 countries EU15 countries
40% poverty line 40% poverty line
y = -0.749x + 21.3 R2 = 0.550
0 10 20 30 40
0 5 10 15 20
Poverty rate S o c ia l e x p e nd it ur e
y = -0.683x + 23.5
R2 = 0.160
0 10 20 30 40
0 5 10 15 20
Poverty rate So c ia l e x p e nd it ur e
50% poverty line 50% poverty line
y = -0.541x + 22.5 R2 = 0.482
0 10 20 30 40
0 5 10 15 20 25
Poverty rate So c ia l e x p e nd it ur e
y = -0.445x + 24.5
R2 = 0.222
0 10 20 30 40
0 5 10 15 20 25
Poverty rate So c ia l e x p e nd it ur e
60% poverty line 60% poverty line
y = -0.451x + 24.4 R2 = 0.429
0 10 20 30 40
0 5 10 15 20 25
Poverty rate So c ia l e x p e nd it ur e
y = -0.451x + 27.6
R2 = 0.246
0 10 20 30 40
0 5 10 15 20 25
Poverty rate So c ia l e x p e nd it ur e
Non-EU15 countries: Australia, Canada, Czech Republic, Mexico, Norway, Slovak Republic, and the United States
EU15 countries: Austria, Belgium, Denmark, Finland, France, Germany, Ireland, Italy, Netherlands, Spain, Sweden, and the United Kingdom
At one moment in time, the linkage effect of net public social expenditure
ratios and poverty rates across countries turns out to be less strong compared to the effect of gross public spending (lower correlation coefficients R2 in all cases).
Moreover, in case social expenditures are corrected for the impact of tax systems, we do not find a significant (negative) correlation for both the EU15 countries and the non-EU15 countries separately. Only for all countries together we still find a fit (ρ<0.01).
We conclude that the conventional view that welfare spending goes along with less poverty must at least be mitigated. The linkage between the two variables becomes substantially weaker if the expenditure data are corrected for relevant tax features, which gives a more realistic picture.
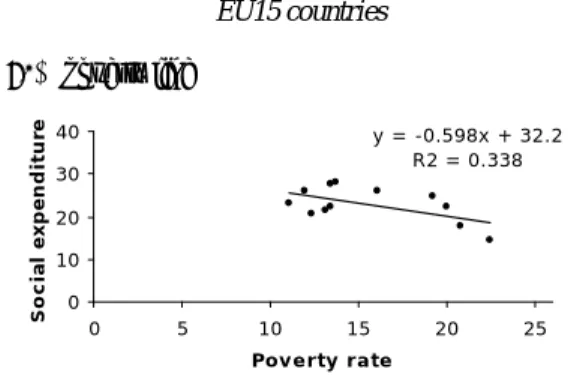
5.3 The impact of private social expenditure. Another problem with social
expenditure as an indicator for differences in social protection across countries is related to variations in the public/private mix in the provision of social protection. In Figure 5 we have included private social arrangements in our social expenditure indicator for 2003, using the OECD data as developed by Adema (2001). We have linked the poverty rates across countries around 2000 to net total
social expenditures of 2003. For this plot, we apply the 60-percent-of median income poverty threshold, and we use LIS-data on poverty.
Figure 5: Linkage between net total social expenditure and LIS poverty rates across 19 countries, around 2000-2003
Non-EU15 countries EU15 countries
60% poverty line 60% poverty line
y = -0.226x + 23.0 R2 = 0.059
0 10 20 30 40
0 5 10 15 20 25
Poverty rate
S
o
c
ia
l e
x
pe
n
d
it
u
re y = -0.598x + 32.2
R2 = 0.338
0 10 20 30 40
0 5 10 15 20 25
Poverty rate
So
c
ia
l e
x
pe
nd
it
ur
e
Non-EU15 countries: Australia, Canada, Czech Republic, Mexico, Norway, Slovak Republic, and the United States
EU15 countries: Austria, Belgium, Denmark, Finland, France, Germany, Ireland, Italy, Netherlands, Spain, Sweden, and the United Kingdom
The results alter considerably in case private social expenditure are included as well. For non-EU15 countries in our sample we do not find any evidence for a negative correlation between the level of net total social spending and the incidence of poverty (R2=0.059). Since there is no clear and strong negative link, more social spending does not offer an easy route to less poverty within these countries. In contrast, for the group of EU15 countries we find a significant fit (R2=0.338; ρ<0.05). Private social expenditure does seem to matter as far as poverty alleviation in the EU is concerned.35 Apparently, private social
arrangements have more redistributive impact in the EU than in other OECD countries.
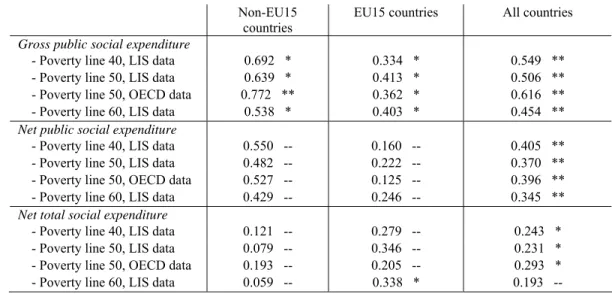
Table 5 summarizes our results. It shows the correlation coefficients and significance of all linkages between social expenditure and poverty rates across countries in case different poverty lines and /or data sets are employed. This sensitivity analysis shows more or less the same results in case other poverty lines and/or other databases for poverty are applied (LIS or OECD). However, the results are sensitive for the social indicator used. Note that we find rather good fits for gross social expenditures, both for non-EU15 and EU15 countries. However, the effect of the tax systems alters the picture. Still we find a significant negative relationship between net public spending and poverty rates for all countries, but not for EU15 countries or non-EU15 countries separately. For the EU15 we do find a fit again if we include private social expenditure. For the EU15, private social benefits do seem to help to reduce poverty levels. However, the linkage between net total social expenditure and poverty levels is still much weaker than in the case the traditional indicator gross public social spending is used.
35 An OLS-regression shows a coefficient for private social expenditure of -1.214 (R2=0.44;
Table 5: Correlation coefficient and significance of linkages between social expenditure and poverty rates across countries around 2000-2003
Non-EU15 countries
EU15 countries All countries
Gross public social expenditure
- Poverty line 40, LIS data 0.692 * 0.334 * 0.549 ** - Poverty line 50, LIS data 0.639 * 0.413 * 0.506 ** - Poverty line 50, OECD data 0.772 ** 0.362 * 0.616 ** - Poverty line 60, LIS data 0.538 * 0.403 * 0.454 **
Net public social expenditure
- Poverty line 40, LIS data 0.550 -- 0.160 -- 0.405 ** - Poverty line 50, LIS data 0.482 -- 0.222 -- 0.370 ** - Poverty line 50, OECD data 0.527 -- 0.125 -- 0.396 ** - Poverty line 60, LIS data 0.429 -- 0.246 -- 0.345 **
Net total social expenditure
- Poverty line 40, LIS data 0.121 -- 0.279 -- 0.243 * - Poverty line 50, LIS data 0.079 -- 0.346 -- 0.231 * - Poverty line 50, OECD data 0.193 -- 0.205 -- 0.293 * - Poverty line 60, LIS data 0.059 -- 0.338 * 0.193 --
Note:
- OLS-regression; ** Social expenditure variable significant at the 0.01 level; * Social expenditure variable significant at 0.05 level, -- Social expenditure variable insignificant at 0.05 level.
Source: see Appendix
6. Antipoverty effect of social transfers and taxes
6.1 Introduction. In every nation, benefits from governments and net of taxes
Table 6: EU at-risk-of-poverty rate before and after social transfers and taxes, 1995-2005
Before social transfers and taxes After social transfers and taxes
1995 2000 2005 1995 2000 2005
Austria 24 22 24 13 12 12
Belgium 27 23 28 16 13 15
Denmark : : 31 10 : 12
Finland : 19 28 : 11 12
France 26 24 26 15 16 13
Germany 22 20 24 15 10 13
Greece 23 22 23 22 20 20
Ireland 34 31 32 19 20 20
Italy 23 21 24 20 18 19
Luxembourg 25 23 23 12 12 13
Netherlands 24 22 22 11 11 11
Portugal 27 27 26 23 21 20
Spain 27 22 24 19 18 20
Sweden : : 29 : : 9
United Kingdom 32 29 : 20 19 19
Mean 26.0 23.0 26.0 17.0 15.0 16.0
Standard deviation 3.48 3.37 3.02 4.11 3.90 3.85
Coefficient of variation 0.133 0.143 0.116 0.248 0.252 0.253
Notes:
-At-risk-of-poverty rate before social transfers: the share of persons with an equivalized disposable income, before social transfers, below the risk-of-poverty threshold, which is set at 60 percent of the national median equivalized disposable income (after social transfers). In the EU data retirement and survivor's pensions are counted as income before transfers and not as social transfers, because the prime role of old age (and survivors’) pensions is not to re-distribute income across individuals but rather over the life-cycle of individuals.
-At-risk-of-poverty rate after social transfers: the share of persons with an equivalized disposable income below the risk-of-poverty threshold, which is set at 60 percent of the national median equivalized disposable income
Source: Structural Indicators EU - Social Cohesion (Eurostat: ECHP/EU-SILC); own calculations
We calculate both the absolute and the relative measures of poverty reduction. The absolute antipoverty effect is the percentage point difference between the poverty rate before and after taxes and transfers. The relative effectiveness is measured as: (pre-tax-transfers poverty rate – post-tax-transfers poverty rate) / pre-tax-transfers poverty rate * 100.
Figure 6 illustrates a broader picture of the ‘best-practices’ for the EU25 countries in combating poverty. Countries are listed is descending order of the magnitude of their relative antipoverty effect of social transfers.
Figure 6: Absolute and relative poverty reduction, 2005
Total population 0 2 4 6 8 10 12 14 16 18 Gr e e ce It a ly Sp a in La tv ia Li thua ni a Cy p ru s Es to ni a Po rt u g al Pol a n d Ma lt a UK Sl o v a k ia Lu x e m b o u rg B e lg iu m Ir e lan d Hu n g a ry Au st ri a Fr a n ce Ge rm a n y Sl o v e n ia Ne th e rl a n d s Cz e ch Fi n la n d De n m a rk Sw e d en me an E U -1 5 me an E U -2 5 0% 10% 20% 30% 40% 50% 60% 70%
relative (right scale) absolute (left scale)
Note: In all cases the risk-of-poverty threshold (before and after social transfers and taxes) is set at 60
percent of the national median equivalized disposable income. Retirement and survivor's pensions are counted as income before transfers.
Source: Structural Indicators EU - Social Cohesion (Eurostat: EU-SILC); own calculations
Next, we also include five non-EU15 countries as a benchmark into our analysis. We calculated the antipoverty effect of social transfers and taxes, based on up-dated figures from the LIS Fiscal redistribution dataset.36 This dataset measures pre- and post-government poverty levels, using a composite measure that reflects both the headcount of those in poverty (the percentage of all persons whose equivalized household income falls below 50 percent of their country’s median) and the depth of their poverty (the difference between the median income of the entire population and the mean income of the poor). Countries are listed in descending order of the magnitude of their (absolute) antipoverty effect; see Table 7.
Remarkably enough, the United States relative poverty rate before taxes and
social transfers is actually below average for the selected countries, even though
the United States ranks the highest of all the countries in this comparison group in relative poverty rates after taxes and transfers. Given this divergence, it should be
no surprise that of the countries listed, the United States (and Ireland) devote the smallest share of its resources to antipoverty income transfer programs.37 Best-practices at the top of this list can be found for Belgium, Germany, and the Nordic countries. Moreover, the EU15 countries show on average an antipoverty effect of 20.3 percentage points (or 80 percent), while the other non-EU15-countries produce on average a rather poor effect of 13.4 percentage points among their population (65 percent).
Table 7: Poverty scores of private sector income and disposable income
Private sector income Disposable income Poverty reduction Country Year HC GAP HC*GAP HC GAP HC*GAP Absolute Percent
Belgium 1997 32.0 0.91 29.0 8.0 0.63 5.0 24.0 83
Finland 2004 30.3 0.87 26.2 6.5 0.60 3.9 22.3 85
Germany 2000 30.9 0.87 26.8 8.4 0.63 5.3 21.5 80
Sweden 2000 29.8 0.84 24.9 6.5 0.66 4.3 20.6 83
Denmark 2004 28.0 0.86 24.0 5.6 0.62 3.5 20.5 85
France 1994 29.5 0.86 25.3 8.0 0.61 4.9 20.4 81
UK 1999 31.9 0.86 27.5 12.5 0.63 7.9 19.6 71
Ireland 1987 30.4 0.87 26.6 11.1 0.64 7.1 19.5 73 Australia 2003 28.6 0.85 24.4 12.2 0.64 7.8 16.6 68
Norway 2000 24.9 0.82 20.3 6.4 0.64 4.1 16.2 80
Netherlands 1999 21.4 0.82 17.6 4.9 0.64 3.1 14.5 82 Switzerland 2002 20.7 0.85 17.5 7.6 0.63 4.8 12.7 73
Canada 2000 25.2 0.79 20.0 12.4 0.65 8.1 11.9 60
USA 2004 26.6 0.80 21.2 17.3 0.68 11.8 9.4 44
Mean 27.9 0.85 23.7 9.1 0.64 5.8 17.8 75
Standard deviation 3.6 2.3 4.2 11.1
Coefficient of variation 0.15 0.40 0.235 0.15
Mean EU15 (9) 29.4 0.86 25.3 7.9 0.63 5.0 20.3 80
Standard deviation 3.1 1.5 2.5 4.7
Coefficient of variation 0.12 0.30 0.121 0.06
Mean other OECD (5) 25.2 0.82 20.7 11.2 0.65 7.3 13.4 65
Standard deviation 2.2 2.7 2.7 12.2
Coefficient of variation 0.11 0.37 0.203 0.19
Source: LIS Fiscal redistribution dataset based on Mahler and Jesuit (2006); updated figures from
http://www.lisproject.org/publications/fiscalredistdata/fiscred.htm; and own calculations.
6.2 The impact of welfare state effort. Next we turn to the reduction of poverty
rates through taxes and transfers and its relationship to welfare state effort. Table 8 presents the linkage between poverty reduction and social expenditure ratios for 16 European countries where all relevant data items are available. This gives a picture of the targeting of social protection efforts across European countries at one moment in time (around 2003-2005). Table 8 ranks countries according to their ‘effectiveness’ of combating poverty. Absolute antipoverty effects are divided by social spending ratios to see which country targets best per one point of GDP spent on net social expenditure. Our analysis highlights some cross-country differences of poverty alleviation in the EU15, although the ranking must be interpreted with caution due to cyclical factors. For example, each percentage point of net total public social expenditure alleviates poverty in Ireland and the Scandinavian countries by 0.65-1.05 percentage points, while the lowest scores can be found in Italy, Spain and Portugal (0.18-0.32). Especially the ‘top’ position of Ireland seems to be influenced by the recent economic performance in this particular country (high economic growth, low unemployment rates, and (therefore) the lowest level of social expenditures).
Table 8: Targeting effect of social expenditures on poverty reduction in the EU, around 2003-2005
Poverty rate total population, 2005 (poverty line at 60% of median income)
Social expenditures, % GDP, 2003
Targeting effect
Before social transfers and taxes
(1)
After social transfers
and taxes
(2)
Absolute effect
(3)
Relative effect
(4)
Gross public
(5)
Net total
(6)
Absolute
(3):(5)
Absolute
(3):(6)
Ireland 33 18 15 45% 15.9 14.3 0.94 1.05
Finland 29 13 16 55% 22.5 20.6 0.71 0.78
Denmark 28 12 16 57% 27.6 21.6 0.58 0.74
Sweden 29 12 17 59% 31.3 26.1 0.54 0.65
Czech Republic 22 10 12 55% 21.1 19.8 0.57 0.61
Austria 25 13 12 48% 26.1 22.2 0.46 0.54
Netherlands 21 10 11 52% 20.7 23.1 0.53 0.48
Germany 26 13 13 50% 27.3 27.6 0.48 0.47
Slovakia 20 12 8 40% 17.3 17.0 0.46 0.47
Belgium 27 15 12 44% 26.5 26.0 0.45 0.46
United Kingdom 30 19 11 37% 20.6 24.6 0.53 0.45
Luxembourg 24 14 10 42% 22.2 n.a. 0.45 n.a.
France 25 13 12 48% 28.7 28.0 0.42 0.43
Portugal 25 18 7 28% 23.5 22.1 0.30 0.32
Spain 24 20 4 17% 20.3 17.7 0.20 0.23
Italy 24 20 4 17% 24.2 22.3 0.17 0.18
Mean 25.8 14.5 11.3 44% 23.5 22.2 0.48 0.51
Source: Structural Indicators EU - Social Cohesion (Eurostat: EU-SILC); Net Social Expenditure 2007; and own calculations
Figure 7: Linkage between social expenditure and relative poverty rate reduction among EU-countries, around 2003-2005
Gross public social expenditure Net total social expenditure
y = 10.368x + 19.0 R2 = 0.105
0 5 10 15 20 25 30 35
0% 10% 20% 30% 40% 50% 60% Poverty rate reduction
So
c
ia
l e
x
p
e
nd
it
ur
e
y = 7.073x + 19.1 R2 = 0.059
0 5 10 15 20 25 30
0% 10% 20% 30% 40% 50% 60% Poverty rate reduction
So
c
ia
l e
x
p
e
ndit
ur
e
Selected countries: Austria, Belgium, Czech Republic, Denmark, Finland, France, Germany, Ireland, Italy, Luxembourg, Netherlands, Portugal, Slovakia, Spain, Sweden, and the United Kingdom
Source: Structural Indicators EU - Social Cohesion (Eurostat: EU-SILC); Net Social Expenditure 2007; and own calculations
Table 9: Targeting effect of social expenditures on poverty reduction, around 2000-2003
Poverty rate total population (poverty line at 50% median income)
Social expenditures % GDP, 2003
Targeting effect
Year Private sector income HC*GAP
(1)
Disposable income HC*GAP
(2)
Absolute effect
(3)
Relative effect
(4)
Gross public
(5)
Net total
(6)
Absolute
(3):(5)
Absolute
(3):(6)
Ireland 1987 26.6 7.1 19.5 73% 15.9 14.3 1.22 1.37
Finland 2004 26.2 3.9 22.3 85% 22.5 20.6 0.99 1.08
Denmark 2004 24.0 3.5 20.5 85% 27.6 21.6 0.74 0.95
Belgium 1997 29.0 5.0 24.0 83% 26.5 26.0 0.91 0.92
Australia 2003 24.4 7.8 16.6 68% 17.9 20.6 0.93 0.81
UK 1999 27.5 7.9 19.6 71% 20.6 24.6 0.95 0.80
Sweden 2000 24.9 4.3 20.6 83% 31.3 26.1 0.66 0.79
Germany 2000 26.8 5.3 21.5 80% 27.3 27.6 0.79 0.78
Norway 2000 20.3 4.1 16.2 80% 25.1 21.7 0.65 0.75
France 1994 25.3 4.9 20.4 81% 28.7 28.0 0.71 0.73
Netherlands 1999 17.6 3.1 14.5 82% 20.7 23.1 0.70 0.63
Canada 2000 20.0 8.1 11.9 60% 17.3 21.2 0.69 0.56
United States 2004 21.2 11.8 9.4 44% 16.2 25.2 0.58 0.37
Mean 24.1 5.9 18.2 76% 22.9 23.1 0.80 0.79
Overall, the trends of the components of post-tax-transfer poverty can be summarized as follows. In most of welfare states, pre-tax-transfer poverty has increased during the 1980s and early 1990s. Most countries have increased the size of the welfare state during the same period. However, in many cases, the increase in the size of the welfare state is not large enough to offset the increase in pre-tax-transfer poverty. As a result, post-tax-transfer poverty has also - more or less - increased in these countries.38
7. Social policy areas
An important critique of aggregated social expenditure data is that it is not possible to see which individual program is responsible for a specific dynamic. Therefore we show social expenditures for various programs. We look at two vulnerable age groups: children and the elderly. We present linkages of their poverty rates with social expenditures for social programs as family and child benefits, and the public old age pensions and survivor schemes.
7.1 Children. In most EU-countries, relative poverty rates among children are
higher than for the entire population, but with much variation across countries. In Finland and Denmark child poverty rates are 10 percent, while a quarter of all children lives in poverty in Hungary, Italy, Latvia, Poland, Spain, and in the United Kingdom. These differences suggest that specific factors increase risks of poverty for children in some EU-countries.
We calculated both the absolute and the relative measures of poverty reduction through social transfers and taxes; see Figure 8. Greece, Spain, and Latvia produce rather poor antipoverty effects among children with their tax/transfer system (below 20 percent). The best-practices in 2005 can be found in Finland, Germany, Austria, Denmark, Sweden, France, and Slovenia with antipoverty effects over 50 percent.
Figure 8: Absolute and relative poverty 0-17 years, 2005
Children (0-17 years)
0 5 10 15 20 25 G reec e Sp ain La tv ia It a ly Li thua ni a Po rt u g al Polan d Es to n ia Ma lt a Slov ak ia Lu x e m b o u rg UK Hu n g a ry Cy pr u s Ire la n d Ne th e rl a n d s Be lg iu m Cz e ch Slov en ia Fr a n ce De n m a rk S w ed en Au st ri a Ge rm a n y Fi n la n d me a n E U -1 5 me a n E U -2 5 0% 10% 20% 30% 40% 50% 60% 70%
relative (right scale) absolute (left scale)
Note: In all cases the risk-of-poverty threshold (before and after social transfers and taxes) is set at 60
percent of the national median equivalized disposable income.
Source: Structural Indicators EU - Social Cohesion (Eurostat: EU-SILC); own calculations