DECOUPLED STRONTIUM AND LEAD ISOTOPES IN NORTH CAROLINA RIVERS
Amanda M. Crenshaw
A thesis submitted to the faculty at the University of North Carolina at Chapel Hill in partial fulfillment if the requirements for the degree of Master of Science in the Department of
Geological Sciences.
Chapel Hill 2020
Approved by:
Drew S. Coleman
Larry K. Benninger
© 2020
ABSTRACT
Amanda M. Crenshaw: Decoupled strontium and lead isotopes in North Carolina rivers (Under the direction of Drew S. Coleman)
Data show that the primary sources of Sr and Pb to North Carolina surface waters are
decoupled: Sr is interpreted to be derived from geologic sources, and Pb is interpreted to be
derived from anthropogenic sources. Strontium is isotopically linked to variations in exposed
bedrock across the state. The isotopic composition of Sr converges toward recent seawater values
at the coast. The concentration of Pb in the dissolved load increases downstream, but Pb remains
isotopically consistent throughout the state. These results suggest that, whereas the dissolved Sr
in surface water is primarily from bedrock sources such as groundwater and channel incision, the
Pb is derived from a more homogenous widespread source. Isotopic data suggest that the
dominant sources of dissolved Pb in North Carolina streams today are most likely a combination
of waste from coal combustion and remnant leaded gasoline contamination, with bedrock
ACKNOWLEDGEMENTS
Extreme gratitude is owed and given to all those who assisted in this research. Thanks to
my advisor, Dr. Drew Coleman, for his patient mentorship throughout my program, and to my
committee members, Dr. Larry Benninger and Dr. Xiaoming Liu, for their thoughtful guidance
and feedback. Thanks to Paige Cary, Elena Watts, and Angel Colon-Ramirez for their earlier
research that laid the groundwork for this study. Thanks to Samantha Lewis, Bailey Williamson,
and Steven Singletary from Robeson County Community College, and to Sarah Brooker and
Jordan Zabrecky at UNC-Chapel Hill, for help with sample collection and lab work. Thanks to
Ryan Mills, Josh Rosera, Connor Lawrence, and other members of Drew’s isotope geochemistry
research group for guidance and friendship. Thanks to Frank Weber and team at RTI
International for help with elemental analyses. Thanks to Phil Bradley at the NC Department of
Environmental Quality for help acquiring vital map files. Thanks to the North Carolina Policy
Collaboratory for funding this research. Thanks to the UNC-Chapel Hill Department of
Geological Sciences, especially Miss Deborah Harris and Dr. Megan Plenge, for support and
guidance no matter the topic. Finally, thanks to my spouse John, my daughter Abigail, my
parents, and our extended family for all their love, support, and patience. I would not be who or
TABLE OF CONTENTS
LIST OF TABLES ... vii
LIST OF FIGURES ... viii
LIST OF ABBREVIATIONS ... ix
INTRODUCTION ... 1
BACKGROUND AND GEOLOGIC SETTING... 2
Isotopic Fingerprinting... 2
North Carolina Bedrock Geology ... 3
Previous Isotopic Characterization of North Carolina Bedrock ... 5
North Carolina River Systems ... 6
Previous Isotopic Characterization of North Carolina Rivers ... 7
Historic Anthropogenic Pb Contaminants ... 9
Modern Anthropogenic Pb Contaminants ... 12
Combining Pb Isotopic and Trace Element Data ... 14
MATERIALS AND METHODS ... 16
Sample Collection ... 16
Isotopic Analysis ... 17
Elemental Analysis ... 18
GIS Analyses ... 18
Strontium... 20
Lead... 20
Major and Trace Element Concentrations ... 21
DISCUSSION ... 21
GIS Analyses ... 21
Strontium and Lead Concentrations and Elemental Correlations ... 22
Strontium and Lead Isotopic Variation ... 23
Sources of Dissolved Strontium... 24
Sources of Dissolved Lead ... 25
Further Analysis of Pb Sources Using [Pb] and Elemental Correlations ... 29
CONCLUSIONS... 31
LIST OF TABLES
Table 1: 207Pb/206Pb signature of Pb ore deposits used in Pb-gas ... 46
Table 2.a-2.c: All sample numbers with location information ... 47
Table 3.a-3.c: Data from isotopic and concentration analyses of Sr and Pb ... 50
Table 4.a-4.d: Data from concentration analyses of major and trace elements ... 53
LIST OF FIGURES
Figure 1: Generalized geologic map of North Carolina ... 33
Figure 2: Physiographic province map of NC ... 33
Figure 3: Isotopic fingerprint plot of NC bedrock Pb ... 34
Figure 4: Map of NC river basins and the ECD... 34
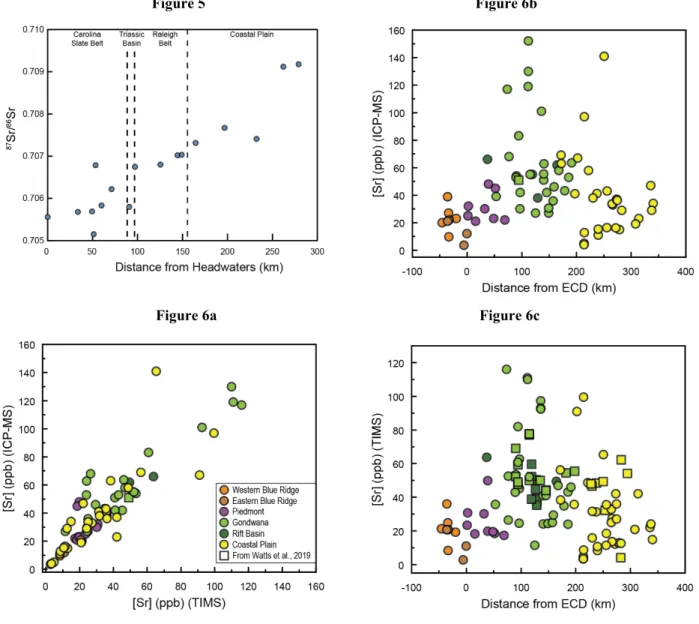
Figure 5: Isotopic Sr values in the Cape Fear River Basin ... 35
Figure 6a-c: Analyses of [Sr] in the dissolved load in NC rivers ... 35
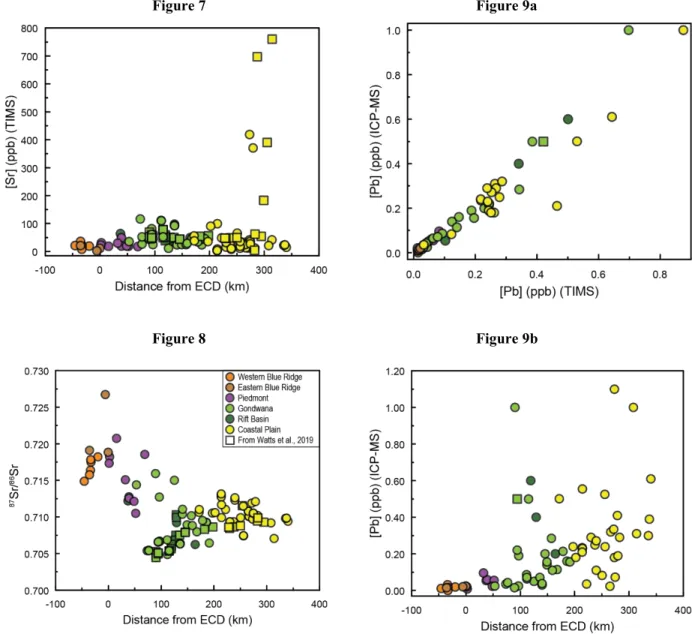
Figure 7: [Sr] vs. distance from the ECD ... 36
Figure 8: 87Sr/86Sr vs. distance from the ECD ... 36
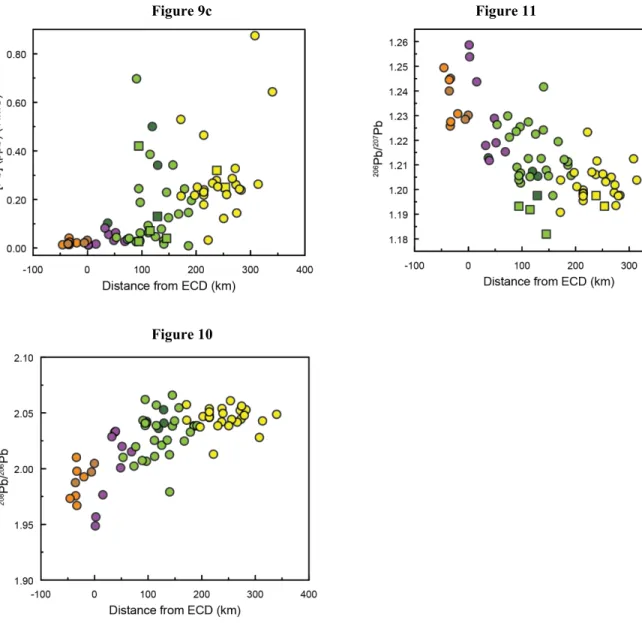
Figure 9a-c: Analyses of [Pb] in the dissolved load in NC rivers ... 36
Figure 10: 208Pb/206Pb vs. distance from the ECD ... 37
Figure 11: 206Pb/207Pb vs. distance from the ECD ... 37
Figure 12a-w: Concentrations for each element vs. distance from the ECD ... 38
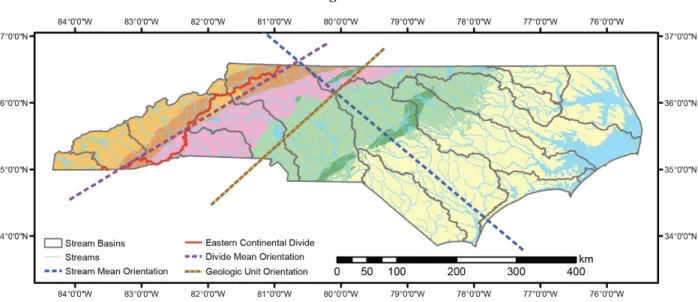
Figure 13: Map of NC with mean orientations of important features... 42
Figure 14: Isotope fingerprint plot of dissolved Pb from NC rivers ... 43
Figure 15: Isotope fingerprint plot of Pb in NC bedrock and rivers ... 43
Figure 16: 87Sr/86Sr vs. distance, relative to modern seawater ... 43
Figure 17a-f: Isotope fingerprint plots for Pb from NC rivers with data from various possible sources ... 43
Figure 18: Isotope fingerprint plot for Pb from NC rivers with coal data ... 45
LIST OF ABBREVIATIONS
ALAS Anthropogenic Lead ArchaeoStratigraphy (Hurst, 2000)
APP Appalachian Coal Basin
BRD Broad River Basin
CAT Catawba River Basin
CHO Chowan River Basin
CP Coastal Plain Province
CPF Cape Fear River Basin
EBR Eastern Blue Ridge Province
ECD Eastern Continental Divide
FBR French Broad River Basin
GDW Gondwana Terrane
HIW Hiwassee River Basin
ICP-MS Inductively coupled plasma-mass spectrometer
ICP-OES Inductively coupled plasma-optical emission spectrometer
ID-TIMS Isotope dilution-thermal ionization mass spectrometer
ILL Illinois Coal Basin
LBR Lumber River Basin
LTN Little Tennessee River Basin
NEU Neuse River Basin
NEW New River Basin
PAS Pasquotank River Basin
PRB Powder River Coal Basin
RB Triassic rift basin
ROA Roanoke River Basin
RTII Research Triangle Institute International
TAR Tar-Pamlico River Basin
WAT Watauga River Basin
WBR Western Blue Ridge Province
WOK White Oak River Basin
INTRODUCTION
The chemical and isotopic compositions of river water reflect interaction with porous
media within headwater sources, groundwater addition from effluent streams, bedrock of the
stream channel, and bedload and suspended load including sediment influx from the drainage
basin. The river’s dissolved load may reflect the age and mineral composition of the bedrock and
precipitation as well as anthropogenic and other influences including biologic interaction.
Distinguishing between sources to the load can be accomplished through comparison of stream
water data to data from those suspected sources.
Natural sources of Pb, Sr, and other elements in the dissolved load in streams include the
rock with which the water comes into contact and precipitation. In North Carolina, the surface
geology can be divided into six generalized geologic provinces with approximately N-S trending
boundaries (Fig. 1; Stewart and Roberson, 2007). The oldest rocks are exposed in the western
portion of the state and include igneous and metamorphic rocks. To the east, accreted
metamorphic terranes become progressively younger and are cut by Triassic-age rift basins. The
eastern third of the state exposes a sedimentary coastal plain with rocks ranging in age from
Cretaceous to Recent. If natural bedrock sources are the dominant contributors to the dissolved
load in streams, this pattern of changes in bedrock petrology and age yields predictable E-W
variations in chemical and isotopic bedrock contributions to surface waters.
Observed variation in chemical and isotopic composition of North Carolina surface
throughout the state (Cary, 2018). However, the limited early data for Pb suggest that it does not
show variations in isotopic composition that are consistent with bedrock sources. Preliminary
data indicate that Pb concentration generally increases downstream but remains isotopically
consistent throughout the state relative to natural sources (Cary, 2018). This suggests a
decoupling of Sr and Pb contributions to the dissolved load in North Carolina surface waters.
I propose to test the hypothesis that the sources of Sr and Pb are decoupled in North
Carolina surface waters, with Sr derived from geologic sources and Pb derived from
anthropogenic sources. In order to test this hypothesis, samples of river and stream water were
collected from across the state and analyzed for Sr and Pb concentrations and isotopic
compositions. Additionally, all samples were analyzed for major and trace element composition.
The composition of the dissolved load in North Carolina surface water was mapped and
referenced against the bedrock geology. The analyses of major and trace element concentrations
add context to the isotopic data and aid in identification of natural and anthropogenic influences
on streams.
BACKGROUND AND GEOLOGIC SETTING
Isotopic Fingerprinting
Isotopic fingerprinting is a well-established technique that uses the relative abundances of
isotopes within a system to compare samples of unknown sources with samples from known
sources. Strontium and Pb each have one or more naturally occurring radiogenic isotopes as well
as stable, non-radiogenic isotopes. 87Sr is the product of decay of 87Rb and is measured as a ratio
with the non-radiogenic 86Sr. Because the ionic radius and charge of Sr are similar to that of
calcium, Sr is readily found in rocks, minerals, and shells substituting for Ca. Rubidium is
abundances of Ca and K within bedrock vary predictably with rock type and age. Mafic igneous
rocks will tend to have low 87Sr/86Sr because they have low K/Ca (and therefore (Rb/Sr). In
contrast, felsic igneous rocks typically have a high 87Sr/86Sr because they are characterized by
high K/Ca. Marine carbonate rocks preserve the isotopic signal from the ocean at the time of
formation. The 87Sr/86Sr ratio in the modern ocean is 0.709178 (relative to NBS-987 87Sr/86Sr =
0.710248), and the high Ca and Sr concentration in coastal waters can overwhelm the signatures
of other sources (Watts et al., 2019).
Lead is an element with one stable non-radiogenic isotope (204Pb) and three stable
radiogenic isotopes (206Pb, 207Pb, and 208Pb). 206Pb is the daughter product of 238U that has a
half-life of 4,470 Ma (Baum et al., 2010). 238U is much more abundant than 235U (99.27 vs. 0.73
mol%, respectively) that decays to 207Pb and has a half-life of 704 Ma (Baum et al., 2010). 232Th,
essentially the only naturally occurring Th isotope (~100 mol%), decays to 208Pb with a 14,000
Ma half-life (Baum et al., 2010). Lead isotopic ratios therefore reflect the U-Th/Pb systematics
of their source and can be used for distinguishing natural sources (e.g., bedrock), and combustion
sources such as coal ash or leaded gasoline aerosol deposits (Shirahata et al., 1979; Hamelin et
al., 1990; Wang et al., 2019). Because of the differences in parent half-life, 206Pb/207Pb (as well
as 206Pb/204 Pb and 207Pb/204Pb) is sensitive to the age and U/Pb of the Pb source. In addition to
age information, the 206Pb/208Pb (and 208Pb/204Pb) ratio is also sensitive to the U/Th and Th/Pb
ratio of the source.
North Carolina Bedrock Geology
North Carolina bedrock exposes three generalized physiographic provinces of variable
age and rock type. These provinces are the Blue Ridge, Piedmont, and Coastal Plain (Fig. 2;
east: the Western Blue Ridge, Eastern Blue Ridge, Piedmont Terrane, Gondwana Terrane, and
the Coastal Plain. In addition, the Piedmont and Gondwana terranes are cut by Triassic basins
associated with the breakup of Pangea.
The Western Blue Ridge Province includes metamorphic and igneous rock formed as a
result of the Grenville orogeny during the formation of the supercontinent Rodinia, 1200-900 Ma
(Stewart and Roberson, 2007). The Eastern Blue Ridge Province is dominantly metamorphosed
igneous and sedimentary rock that began developing from the accretionary wedge between the
converging continents (Stewart and Roberson, 2007). The Eastern Blue Ridge Province also
includes metamorphosed volcanic and sedimentary rock that was deposited along the coast of
Laurentia 570-480 Ma after the breakup of Rodinia 700-600 Ma (Stewart and Roberson, 2007;
NCDEQ, 2015).
East of the Blue Ridge provinces, the Piedmont and Gondwana terranes (630-280 Ma) are
dominantly metamorphosed igneous and sedimentary rock that formed on or near the coasts of
the newly formed continents Laurentia and Gondwana, and were added to Laurentia. The rock of
the Piedmont terrane originated as an island arc during oceanic subduction beneath a piece of
continental crust of unknown origin (Stewart and Roberson, 2007). The convergent boundary
creating these volcanoes culminated with the collision of an accretionary wedge and the crustal
fragment into Laurentia (the Taconic orogeny), forming the Piedmont terrane and the ancestral
Appalachian Mountains 460 Ma (Stewart and Roberson, 2007). The Gondwana terrane initially
formed as a continental volcanic chain above a subduction zone along the early Gondwanan
coast (600-500 Ma). It was added to Laurentia around 330 Ma during the formation of Pangea
Pangea later began rifting apart, separating what is now North America from Africa about
220 Ma. Normal faulting in North America resulted in formation of rift basins, dominantly
Triassic in age (Stewart and Roberson, 2007). In North Carolina, these basins, geographically
small relative to other provinces, are bounded by the Piedmont and Gondwana terranes. Surface
exposure of the basins is dominated by sedimentary rock. The Triassic rift basins and the
surrounding terranes were intruded by a network of diabase dikes and sills (Stewart and
Roberson, 2007; NCDEQ, 2015). Following rifting, the newly formed passive margin at the
eastern edge of the Gondwana terrane began to accumulate the marine sedimentary deposits that
form the Coastal Plain, ranging in age from 145.5 Ma to Recent (Stewart and Roberson, 2007;
NCDEQ, 2015).
Previous Isotopic Characterization of North Carolina Bedrock
A strong relationship between bedrock age, rock type, and isotopic composition of Sr is
well-established in published literature. Generally, age and 87Sr/86Sr are positively correlated,
therefore older rock will have a higher 87Sr/86Sr signature than younger rock of similar
composition. Data show that this relationship holds true in North Carolina, with the Blue Ridge
provinces having the highest 87Sr/86Sr values relative to the rest of the state. Rock and mineral
values in one study of the North Carolina Blue Ridge Provinces range from 0.7067 to 0.7275,
with a median value of 0.7161 (Stueber and Murthy, 1966; Stueber, 1969). Analysis of granites
in central North Carolina show that the median 87Sr/86Sr decreases to around 0.7139 (Fullagar,
1979) or as low as 0.7107 (Coler et al., 1997). Diabase dikes in the rift basins and surrounding
provinces have relatively small surface exposure but are among the lowest bedrock 87Sr/86Sr
values in the state, with median 0.70475 (Watts et al., 2019). Sedimentary rock can exhibit a
parent rock from which clasts are derived. The marine sediments that comprise the bedrock of
the Coastal Plain are understood to reflect the Sr signature of seawater at the time of deposition,
which ranges from 0.7072 around 145 Ma and trends upward over time to the modern value of
0.7092 (Peucker-Ehrenbrink and Fiske, 2019).
The isotopic composition of Pb in North Carolina bedrock does not exhibit a clear pattern
as is seen with Sr. Studies analyzing bedrock in the Blue Ridge provinces report 206Pb/207Pb
values ranging from 1.1042 to 1.2799, with a median value of 1.1316. Those samples have
208Pb/206Pb values ranging from 2.0016 to 2.4238, with a median value of 2.1464 (n=35; Sinha et
al., 1996; Fisher 2010). Analyses of meta-igneous rock and diabase in the Piedmont and
Gondwana terranes show comparatively narrow ranges: 206Pb/207Pb from 1.1007 to 1.2061,
median 1.16437 and a range of 0.1054; 208Pb/206Pb from 2.0457 to 2.1446, median 2.0915 and a
range of 0.0989 (n=19; LeHuray, 1986; Callegaro et al., 2013). 206Pb/207Pb is highly correlated
with 208Pb/206Pb in rocks from central North Carolina (Fig. 3). However, this could be an artifact
of the limited rock types sampled in the cited studies. Available isotopic data for Pb in the
Coastal Plain are limited to stream sediment and groundwater surveys rather than whole rock
analyses. These were excluded from this analysis of the bedrock to surface water relationship
due to concerns that the data may include both natural and anthropogenic Pb sources. With the
wide range of Pb isotopic compositions of the westernmost provinces that encompasses the range
of reported values for central provinces, no predictive model for isotopic variance in bedrock Pb
can be presumed.
North Carolina River Systems
River basins in North Carolina flow either toward the Atlantic Ocean or the Gulf of
Carolina traverse several of the geologic provinces on the way to the Atlantic coast (Fig. 4). The
eastward-flowing basins, draining into the Atlantic Ocean and listed in descending order by area
within state boundaries are: Cape Fear, 23,734 km2; Yadkin-Pee Dee, 18,702 km2; Tar-Pamlico,
15,922 km2, Neuse, 15,701 km2; Roanoke, 9,047 km2; Pasquotank, 8,719 km2; Lumber, 8,623
km2; Catawba, 8,509 km2; Broad, 3,921 km2; White Oak, 3,578 km2; Chowan, 3,363 km2; and
Savannah, 444 km2 (calculated using shapefile boundaries from the North Carolina Department
of Environmental Quality [2017] and cut to include only portions inside North Carolina).
Because of the geography of North Carolina, with its large Intracoastal Waterway and Outer
Banks, the river basins that drain into the Atlantic Ocean have geographic expanses that include
significant water bodies, therefore the areas given above do not represent relative land mass. The
westward-flowing basins that originate in North Carolina eventually drain into the Gulf of
Mexico. Listed in descending order by area within state boundaries are: French Broad, 7,327
km2; Little Tennessee, 4,654 km2; New, 1,954 km2; Hiwassee, 1,669 km2; and Watauga, 530
km2.
Previous Isotopic Characterization of North Carolina Rivers
Watts et al. (2019) explored Sr isotopic variations in the Neuse and Cape Fear river
basins in eastern North Carolina (Fig. 5). They found exposed bedrock to be a good predictor of
Sr isotopic composition in the dissolved load, yet not without caveats. Both basins have their
headwaters in Gondwanan terrane bedrock – that would be predicted to yield high 87Sr/86Sr due
to the age (>600 Ma) and composition (high Rb/Sr) of the rocks. However, the Sr isotopic
compositions in the headwaters are the lowest measured along the lengths of the rivers (<0.706).
Watts et al. (2019) attributed the non-radiogenic isotopic compositions to a strong influence from
groundwater components in the area than their low surface exposure would predict (Woods, et
al., 2000). Downstream from the Triassic rift basins, the isotopic compositions of surface waters
climb and level off at values approximating seawater as the rivers traverse the Coastal Plain.
Watts et al. (2019) noted that the marine deposits of the Coastal Plain are generally high in [Sr]
and also relatively soluble compared to igneous rocks upstream, rapidly obscuring the isotopic
signature of upstream geology. Dissolved Sr in streams near the coast converge toward recent
seawater values (Watts et al., 2019).
Cary (2018) continued the work of Watts et al. (2019) and expanded the study area to
include all of North Carolina in order to analyze whether the conclusions from two large
watersheds would be supported on a larger spatial scale. Cary (2018) found that the 87Sr/86Sr
values in western North Carolina vary greatly from those of eastern North Carolina due to the
bedrock in the west being dominated by relatively old metamorphic and igneous rock, in contrast
to the relatively young sedimentary deposits dominating the eastern river basins. The highest
87Sr/86Sr values (0.721) in the state were found to occur in some of the westernmost sites, with
North Carolina’s oldest exposed bedrock. The values decrease eastward, correlated with the
decrease in geologic age of bedrock into the Piedmont and Gondwana terranes. This follows the
hypothesized trend of Sr isotopic variation based on the age and local bedrock, if Sr is
geologically sourced. The lowest 87Sr/86Sr values (0.704) correspond to locations both
geographically and geologically similar to those in the upper stream basins in Watts et al. (2019),
located in the Gondwana terrane. From there, the values in each study increase and converge
eastward toward recent seawater values. Overall, Cary (2018) found the Sr data to reflect
Cary (2018) also analyzed water samples for the isotopic composition of dissolved Pb.
Ranges of Pb isotopic ratios reported include 208Pb/206Pb (2.038-2.078) and 206Pb/207Pb
(1.182-1.213), both narrow ranges relative to the isotopic Pb variation in bedrock throughout the state
(LeHuray, 1986; Sinha et al., 1996; Fisher 2010; Callegaro et al., 2013). No significant isotopic
variation is found to correspond to changes in geology. Cary (2018) concluded that this isotopic
signature indicates that Pb in North Carolina surface water is primarily derived from an
anthropogenic source and suggests U.S. leaded gasoline as the primary contributor of Pb
contamination.
Historic Anthropogenic Pb Contaminants
Lead is increasingly present in the environment due to human activity including mining,
agriculture, and fossil fuel extraction and combustion. Significant sources of anthropogenic Pb
involve combustion or melting of Pb-bearing materials, causing Pb to aerosolize and allowing for
widespread deposition. Evidence of anthropogenic Pb contamination of the atmosphere from as
early as 5000 yr bp is recorded through the deposits of aeolian waste products of early smelting
technologies (Komárek et al., 2008). The record of changes in the flux of anthropogenic Pb into
water, soil, and the atmosphere are preserved within offshore and lacustrine basin sediments and
in glacial deposits (Shirahata et al., 1979; Hamelin et al., 1990; Rosman et al., 1993; Komárek et
al., 2008). As human populations and technologies advanced, the flux of anthropogenic Pb into
the environment generally increased, with the most significant increases occurring early in the
Industrial Revolution (1730 CE) and with the automobile boom around 1940 CE (Shirahata et
al., 1979).
Lead was used as an additive to commercial gasoline beginning in 1923 after it was
combustion engines while simultaneously increasing fuel efficiency (Nriagu, 1989; O’Brien and
Gethin-Damon, 2011). When gasoline combusts in an engine, Pb aerosolizes and may remain in
the atmosphere for 5-10 days before deposition, allowing for widespread dispersal (Sturges and
Barrie, 1987). The Clean Air Act of 1970 and its amendments in 1990 included the phaseout of
Pb-gas for road-use vehicles in the United States (Nriagu, 1989; U.S. EPA, 1998). However,
studies of Pb in soil show that it may have residence times of hundreds of years on some forest
floors, therefore pollution may remain long after deposition ceases (Erel et al., 1997).
Complicating the matter of tracing anthropogenic sources of Pb is that very little public
data exist about the composition of gasoline and its additives. Researchers have reconstructed
temporal changes in isotopic composition of aerosolized Pb and determined which ores were
used in additives in the US using data from aerosols, suspended ocean sediment, and glacial and
lacustrine deposits (Sherrell and Boyle, 1992; Teutsch et al., 2001). American Pb-gas has a
different isotopic composition than that from other continents and even other parts of North
America due to access to extensive Mississippi Valley-type Pb ore deposits. Mississippi Valley
Pb is significantly higher in 206Pb/207Pb relative to most other ores used in additives (Cheng and
Hu, 2010). Commonly cited isotopic ranges for North American Pb-gas mainly include findings
from research conducted on samples from the Sargasso Sea (Sherrell et al., 1992; 206Pb/207Pb
1.1854-1.1965 and 208Pb/206Pb 2.048-2.068) and California (Chow and Johnstone, 1965;
206Pb/207Pb 1.115-1.160 and 208Pb/206Pb 2.096-2.151).
A 1992 study suggested that isotopic data may be used to differentiate natural versus
anthropogenic inputs of Pb into the atmosphere, and cited 206Pb/207Pb data in the Eastern US
during the 1980’s ranging from 1.189 to 1.225 (Veron et al., 1992). On the basis of these values
“characteristic of Eastern US emissions,” further justified by their analysis of air mass transport
patterns relating emission sources to data collection points (Veron et al., 1992).
The Pb isotopic compositions reported in Veron et al. (1992) are not solely representative
of Pb-gas emissions, however. Veron et al. (1992) assert that by 1985, Pb additives to US
gasoline were no longer being sourced from the Mississippi Valley-type deposits, but from less
radiogenic sources including Mexico (206Pb/207Pb = 1.20) and Canada (206Pb/207Pb = 1.15). Were
leaded gasoline the only source of atmospheric lead at the time of this study, 206Pb/207Pb would
have been expected to drop below 1.20. Since composition remained high, with an Eastern US
average calculated to be 1.201, another industrial source, such as refining of Mississippi
Valley-type ores for steel production, may account for a larger proportion of atmospheric Pb as Pb-gas
additives changed sources and decreased in use (Veron et al., 1992). In 1987, however, a review
of global aeolian fluxes of natural and anthropogenic lead cited Pb-gas as creating three to six
times as much atmospheric input as any metal-refining industry, and 10-20 times the input of
coal power plants (Patterson and Settle, 1987).
Some researchers have attempted to summarize temporal trends in Pb isotopic variation
in emissions. Hurst (2000) developed the Anthropogenic Lead ArchaeoStratigraphy (ALAS) that
synthesized data from many studies in an attempt to summarize temporal variation of isotopes in
US anthropogenic lead from the 1950’s to the 1990’s. The resulting S-shaped curve shows a
trend of increasing 206Pb/207Pb values over time. Hurst’s (2000) model used data mostly collected
from California, but successful testing of his model as a calibration curve using samples from
CA, FL, IL, and NJ led him to argue for its wide applicability to the dating of samples from
across the United States during the period of greatest leaded gasoline emissions. Kaplan (2003)
1.168 in 1965, increasing to 1.218 in 1992. Data on other Pb isotopes, including 208Pb/206Pb, are
not included in Hurst’s model or in Kaplan’s additional work on its application as an age dating
tool.
Data on the composition of ores known to have been mined by Pb additive manufacturers
may be of some value. Ores used in production of Pb-gas additives sold in the US varied widely
in origin and included major sources in Mexico, Peru, and Australia, as well as Idaho, Utah, and
Missouri in the US. Table 1 gives representative 206Pb/207Pb values for a variety of Pb ores used
in manufacture of Pb-gas additives, which are assumed to cover the range of isotopic values
found in North American Pb-gas (Kaplan, 2003).
Modern Anthropogenic Pb Contaminants
Now that Pb-gas has been phased out worldwide, modern aerosol data are more easily
attributed to specific point sources, but water data remain highly influenced by remnant Pb-gas
deposits in many areas (Komárek et al., 2008; Sen et al., 2016). Unfortunately, as with Pb-gas,
other common anthropogenic sources of Pb including coal combustion and waste products,
mining and industrial waste, and fertilizers, are owned and used by private industry. Therefore,
public access to primary pollutant data is limited.
Some studies attempt to characterize isotopic signature of anthropogenic Pb from coal
and its combustion waste products. Lead aerosols studied in Tampa, FL in 1998, where there is a
clustering of Pb-emitting power plants, showed a more radiogenic composition than other
regions of the US. These analyses, conducted after Pb-gas was no longer in use, were consistent
with published data on isotopic ratios of major US coal mines, suggesting that coal power can be
a major contributor to aerosol Pb today (Bollhöfer and Rosman, 2001). Recent research in North
environment. In this study, Wang et al. (2019) compare the isotopic composition of sediments
near coal ash spills in North Carolina lakes to sets of representative samples from three major
coal sources in the US including the Appalachian Basin, Illinois Basin, and Powder River Basin.
Fly ash samples were found to have 206Pb/207Pb 1.2079-1.2479 and 208Pb/206Pb 1.9760-2.0413,
with different basins exhibiting statistically distinct trends within those ranges. The authors argue
that Pb isotopes in fly ash reflect the composition of its source coal, and that the signature is
distinctive enough to allow for its differentiation from other known anthropogenic sources
(Wang et al., 2019).
According to the U.S. Energy Information Administration, North Carolina is not
commercially producing any coal at present. The coal used in the state, the majority of which is
combusted to generate electricity, is transported from states east of the Mississippi (North
Carolina, 2019). In 2017, the coal burned in North Carolina power plants came mainly from
West Virginia (5,919,000 tons), Pennsylvania (5,506,000 tons), and Kentucky (716,000 tons)
(Annual Coal, 2019; North Carolina, 2019). Some of these deposits fall within the Appalachian
and Illinois basins analyzed as part of the Wang, et al. (2019) study cited above. The isotopic
ranges of coals from these states have been reported as 206Pb/207Pb 1.189-1.252 and 208Pb/206Pb
1.196-2.073, which fall along an isotopic fingerprint trend with international leaded gasoline
data, but average significantly higher in 206Pb/207Pb than Pb-gas (Chow and Earl, 1972).
Several other potential sources of anthropogenic Pb inputs were investigated for their
degree of influence on stream water. Local research has been done on the components of various
fertilizers, reporting relative concentrations of major and trace elements known to sometimes
contaminate agricultural products. The findings on trace elements of environmental concern,
expected, however, the fertilizers analyzed all had high percentages of one or both of the
nutrients P and K (Franklin et al., 2005). Industrial metal smelting, including for iron and steel
production, produce aerosols which can be major Pb sources, but which show a predominantly
localized influence on atmosphere, soil, and sediments (Komárek et al., 2008). North Carolina is
not a major producer of processed metals; therefore, this industry would contribute only point
source contamination locally. Mining and municipal waste management vary widely in
composition, quantity, type of and degree of observance to regulations, and access to meaningful
data. However, these potential pollution sources are considered here to be point sources of
contaminants, as their influence is unlikely to be widespread relative to the high-volume
aerosolized combustion products explored above.
Combining Pb Isotopic and Trace Element Data
Studies on waste from coal power plants show that the waste product fly ash can contain
all naturally-occurring elements, including Fe and Al as major components, and enrichment of a
variety of metals and metalloids that can be toxic to many species at elevated levels
(Bhattacharyya et al., 2011; Ramsey et al., 2019). Solubility of the fly ash and its specific
components can vary by source, with some waste samples containing water-soluble Pb and other
samples containing essentially insoluble Pb (Bhattacharyya et al., 2011; Izquierdo and Querol,
2012). Variability among samples may be due to differences in the coal, the combustion process,
and the cleaning process used to reduce particulate emissions. Bhattacharyya et al. (2011) found
that elemental solubility in fly ash is source-dependent in scale but with generally consistent
temporal trends, with some elements such as Al and Cr exhibiting increasing solubility in water
with time and Pb water-solubility decreasing over time. A study of residual contamination
(among others) in areas associated with the spill. Their analysis of in-situ waste-affected
sediments found evidence for long-term leaching of water- and acid-soluble components of fly
ash. They proposed that agitation of contaminated water in laboratory experiments may not
accurately reflect the rates of dissolution in streams (Ramsey et al., 2019). A study in North
Carolina, which included data from nine active coal-power plants, found that liquid waste that
leached soluble material from solid waste ponds was being released into nearby waterways. The
study found a significantly higher concentration of Pb in this waste-water from plants that use
flue gas desulfurization systems, indicating that contaminants being scrubbed to avoid air
pollution are to some degree ending up in river systems (Ruhl et al., 2012).
Studies attempting to trace contaminant sources using both isotopic and correlated trace
metal signatures have shown that combining these types of data is valuable in distinguishing
between potential sources for which data are available but overlap to some degree. Such research
has categorized sources of trace metal pollutants by industry, for example, the primary input of
Mn to the Atlantic Ocean (US steel production) and strongly correlated atmospheric inputs of Ni,
Zn, and Mn from US coal and oil combustion (Veron et al., 1992). Another study of trace metals
showed Pb-gas to account for approximately 75% of the worldwide input of Pb to the
atmosphere in 1983. However, this input was calculated based on limited available information
about gasoline production and consumption levels, and had to use assumptions about the
proportions of Pb in gasoline which varied by location (Nriagu and Pacyna, 1988). Because
industry samples were unavailable and inputs had to be calculated rather than analyzed, no
correlating trace metal data exist for the largest source of Pb contamination in this research.
et al. (1992) excluded Pb from its correlation analyses of trace metal aerosols out of concern that
it would obscure other sources.
The processes of refining Pb ore for use as a gasoline additive are proprietary to industry,
and are potentially variable by source, time, and economic factors including the value of other
components relative to the cost of their extraction. Thus, the composition of processed Pb-gas
additives is likely variable both spatially and temporally, and is unknown. During and after
combustion, the Pb component will not necessarily behave in the same way as other metal
constituents within gasoline. Lead may not exhibit consistent behavior either due to
fractionation, as is seen in fly ash (Bhattacharyya et al., 2011). Lead has been shown to have
high particle affinity. That is, it is readily adsorbed onto other particles. Aerosolized Pb,
deposited onto soil or transported in water, is especially likely to associate with iron oxides,
hydrous oxides, and colloidal organic matter (Teutsch et al., 2001; Helland et al., 2002).
Anthropogenic atmospheric Pb deposits are not likely to be correlated with Ca, Sr, or Ba
(Shirahata et al., 1980).
MATERIALS AND METHODS
Sample Collection
Stream water samples were collected across the state in a grid encompassing all major
river basins and geologic provinces. In grid blocks overlying multiple large basins, each basin
was sampled when possible. Materials with metal parts were avoided during sample collection
and preparation in order to avoid contamination. Water was collected in a plastic bucket on a
nylon rope after being rinsed with water from the collection site several times. A minimum of
125 mL was collected and filtered in the field through a 0.45 μm hydrophilic PVDF filter into a
immediately acidified to an approximate pH of 2 using concentrated ultrapure nitric acid in order
to prevent precipitation of dissolved solids prior to preparation for analysis.
Isotopic Analysis
Approximately 10 mL of each sample was spiked with a tracer enriched in 84Sr and dried
down to a salt before dissolution in 3.5 M HNO3. Strontium was isolated using Sr-Spec™ cation
exchange resin through a 35 μL resin bed after the methods of Lundblad (1994). Strontium
separates were dried in H3PO4 and loaded along with TaF5 emitter onto Re filaments. Strontium
was analyzed using the VG-Sector isotope dilution-thermal ionization mass spectrometer
(ID-TIMS) housed in the Department of Geological Sciences at UNC-Chapel Hill using five faraday
detectors in triple-dynamic mode. Correction for mass fractionation during analysis was
accomplished by monitoring 86Sr/88Sr = 0.1194, assuming exponential fractionation behavior.
During the course of analysis, NBS-987 yielded 87Sr/86Sr = 0.710262 ± 0.000020 (n = 25; 2𝜎𝜎)
and is the best estimate for the uncertainty in analyses (in run analytical precision is at least twice
as good as external reproducibility).
Approximately 50 mL of each sample was spiked with 205Pb and dried down to a salt
before dissolution in 1.1 M HBr for Pb analysis. Lead was isolated using established HBr
anion-exchange column chromatography using a double pass through a 35 μL resin bed. Lead separates
were dried in H3PO4 and loaded using a silica gel emitter onto Re filaments. Analysis of Pb was
done on the PhoeniX-X62 ID-TIMS housed in the Department of Geological Sciences at UNC,
using five faraday detectors in static mode. Correction for mass fractionation during analysis was
accomplished by analyzing similarly sized NBS-981 standards and is estimated to be 0.02 ±
Elemental Analysis
Water samples were analyzed at the Research Triangle Institute International (RTII) for
major and trace element concentrations following US EPA Method 200.8 (modified; U.S. EPA,
1994). The method volumes were adjusted to account for the use of a digestion block and a final
volume of 50 mL. In brief, a 50 mL aliquot of sample was pipetted into a polypropylene, SCP
Science DigiTUBE digestion tube. Ultrapure nitric and hydrochloric acids were added, and the
samples were placed in the digestion block with reflux caps on the tops of the tubes. Additional
tubes containing reagent and calibration blanks, selected sample and blank duplicates, and spiked
duplicates were likewise prepared. The digestion block maintains a precise temperature between
all cells and ensures that the samples never boil. After a two-hour heating period, the tubes were
removed, cooled to room temperature, spiked with internal standard, and then brought to a final
volume of 50 mL with deionized water. The tubes were capped, shaken, and a nominal 5 mL
aliquot was transferred to an autosampler tube for analysis by inductively coupled plasma - mass
spectrometry (ICP-MS) for trace element analysis, and inductively coupled plasma - optical
emission spectrometry (ICP-OES) for major elements. Uncertainties vary by element and are
reported in Table 3.
GIS Analyses
Shapefiles obtained from the U.S. Census Bureau (2017) and the North Carolina
Department of Environmental Quality (2015, 2016, 2017) were imported into ArcMap to create
cartographic representations of the study setting on which to display data. Geologic province
boundaries in the shapefiles were simplified and the boundaries were terminated at the state line.
were removed from the streams shapefile before analyzing the orientation of natural flowing
surface water.
The ArcMap spatial statistical analysis tool “Linear Directional Mean” was used on the
shapefiles to determine mean azimuths of relevant features including geologic boundaries and
streams. These azimuths were used in plotting data and performing further analyses. The Eastern
Continental Divide, in part located in the North Carolina mountains, was analyzed using the
boundaries between eastward- and westward-flowing stream basins. This orientation was used as
a reference line against which to plot locations of the samples.
Data Analysis
Data analysis was performed using code written in R. The data were projected from the
originally recorded locations in latitude and longitude into the North Carolina coordinate system
that also includes distance information. This allowed sample locations to be plotted as distances
from any point or line. The Eastern Continental Divide was randomly assigned a position of zero
(0) and sample locations were calculated as distance from the Eastern Continental Divide along
their mean azimuth. Distances for eastward-flowing basins (draining into the Atlantic Ocean)
were arbitrarily assigned positive values, and distances for westward-flowing basins (draining
into the Gulf of Mexico) were arbitrarily assigned negative values.
A Chi-squared analysis showed most of the major and trace elemental concentration data
to not be normally distributed, so non-parametric tests were used for correlation and statistical
analyses. The Spearman method was used to compute the correlation values and significance of
RESULTS
Strontium
Concentration analyses on ID-TIMS and ICP-MS are highly correlated, with a regression
of [Sr] stream data from ICP-MS vs. ID-TIMS yielding a slope of 1.000 and an R2 value of
0.7829 (Fig. 6a-c). The Sr concentration generally increases and diverges toward the east (Fig.
6a-b). The lowest values as recorded by ID-TIMS analysis (2.7-11.0 ppb, n=6) occur in samples
from the Eastern and Western Blue Ridge (n=3) as well as the southern Coastal Plain in the
upper Lumbar River basin (n=3). The highest values (371.0-418.6 ppb, n=2) occur in estuarine
samples and are excluded from analyses of stream water (Fig.7). The highest [Sr] in stream
samples (82-116 ppb, n=6) are found in samples from the Gondwana terrane (n=5) with one
additional near-estuary sample from the Coastal Plain (Table 2).
87Sr/86Sr ratios vary significantly across the state, ranging from 0.704873 to 0.726745
(Table 2). The highest and most radiogenic values are found in the western part of the state.
Values decrease eastward before rising again in waters of the coastal plain (Fig. 8). In the
easternmost samples, the Sr isotopic compositions converge toward recent seawater values
Lead
The analyses on ID-TIMS and ICP-MS are highly correlated, with a regression of [Pb]
stream data from ICP-MS vs. ID-TIMS yielding a slope of 1.121 and an R2 value of 0.9213 (Fig.
9a-c). The Pb concentration begins low on both sides of the Eastern Continental Divide but
begins to diverge to a wider range in the Piedmont Terrane and continuing eastward (Table 2,
Fig. 9b-c). The full range of concentrations as recorded by ID-TIMS analysis is 0.0088- 0.8751
ppb, with most lower values found in the western part of the state, then diverging and exhibiting
boundary between the Piedmont and Gondwana Terranes. This sharp increase first occurs in
samples from the Gondwana province and is sustained in samples from the rift basins and
Coastal Plain.
The isotopic composition of dissolved Pb in North Carolina surface waters shows little
differentiation by geology. Both 208Pb/206Pb (1.9486 - 2.0575, Fig. 10) and 206Pb/207Pb (1.1820 –
1.2744, Fig. 11) have fairly narrow ranges relative to bedrock and widespread homogeneity in
stream water across the state (Table 2).
Major and Trace Element Concentrations
Concentrations of various elements of interest (25 including Sr and Pb) were analyzed on
ICP-MS for trace elements and ICP-OES for major elements (Table 3). Most elements analyzed
show similar trends to [Sr] and [Pb], with concentrations generally increasing and diverging
toward the east. Some elements show little variation in concentration versus distance
downstream, including Tl, Mo, Ba, Se, Mg, and Na. Antimony, V, and Cr show the highest
concentrations within the Gondwana and rift basin samples, not in the Coastal Plain. Copper
shows a trend increasing and diverging in concentration through the Gondwana and rift basin
provinces, then decreasing and converging eastward through the Coastal Plain. Beryllium also
shows an unusual pattern, with a dip in values in some Gondwana samples, and a spike in the
western Coastal Plain (Figures 12a-w).
DISCUSSION
GIS Analyses
GIS analysis of the major geologic provinces shows their boundaries to have a mean
trend at an azimuth of approximately 43°. The mean azimuth of major streams is approximately
direction is essentially orthogonal to province boundaries and the drainages tend to cross the
boundaries as they progress downstream. The Eastern Continental Divide has a trend along mean
azimuth of approximately 59° within the study area (Fig. 13). Locations of sample sites were
calculated as distance from the Eastern Continental Divide along the mean azimuth of streams
(136°).
Strontium and Lead Concentrations and Elemental Correlations
The regression of [Sr] stream data from ICP-MS vs. ID-TIMS yielding a slope of 1.000
indicates an excellent match between concentration results from both instruments. The R2 value
of 0.7829 reflects the spread of values on either side of the mean, i.e. a degree of imprecision in
the analyses. Strontium concentration in the dissolved load generally increases and diverges
downstream, but with the lowest values in the central provinces elevated relative to the lowest
values in the mountains and Coastal Plain. Using only ICP data in order to obtain the most
accurate comparisons, 14 out of 24 major and trace elements show statistically significant
correlation (confidence level = 0.95) with [Sr]. Correlation tests used the Spearman
(nonparametric) method since most elemental data did not show a normal distribution; results for
all 24 elements plus Sr are listed in Table 4. Strontium shows the highest correlation with Mg,
Ca, Na, and Ba, in order of decreasing correlation.
The regression of [Pb] stream data from ICP-MS vs. ID-TIMS yielding a slope of 1.121
indicates that analyses on ICP-MS yielded higher concentration values than ID-TIMS. The R2
value of 0.9213 reflects that this pattern is consistent, with minimal variation. Lead concentration
shows a well-defined increase downstream. All Pb values measured in North Carolina stream
water remain well below the EPA action level for drinking water. However, levels of dissolved
Terrane, located about 90km from the mean Eastern Continental divide. The higher levels are
sustained in samples from the rift basin and Coastal Plain provinces. Using only ICP data in
order to obtain the most accurate comparisons, 18 out of 24 major and trace elements show
statistically significant correlation (confidence level = 0.95) with [Pb]. Correlation tests used the
Spearman (nonparametric) method; results for all 24 elements plus Pb listed in Table 4. Lead
shows the highest correlation with Cr, Al, Fe, Be, and Ni, in order of decreasing correlation.
Strontium and Lead Isotopic Variation
Analysis of the Sr in the dissolved load shows isotopic variation to exhibit a spatial trend.
The 87Sr/86Sr values in western North Carolina are relatively high, reaching a maximum of
0.726745. A considerable spread is seen in samples originating in the Piedmont and Gondwana
Terranes, with each province showing variability greater than 0.01. Overall, values decrease
eastward through the Piedmont Terrane before reaching a minimum of 0.704873 in the
Gondwana Terrane, at which point the values begin to trend upward. Rift basin values fall within
the range of Gondwana samples, and samples from the Coastal Plain province converge toward
the recent seawater value of 0.709 nearing the coast.
Isotopic analyses of Pb in the dissolved load also show a spatial trend, though the
relationships between isotopic composition, geologic province, and distance downstream are less
pronounced. Though there is a general decreasing trend in 206Pb/207Pb, a considerable amount
overlap is seen among values from the various provinces. The spread in 206Pb/207Pb also seems to
be consistent versus distance before narrowing within the Coastal Plain. A spatial trend is also
seen in a plot of 208Pb/206Pb versus distance downstream, with values increasing from west to
east. This trend again exhibits overlap regardless of geologic variation and a consistent spread
206Pb/207Pb there is a clear linear trend among surface water samples (Fig. 14). The higher
208Pb/206Pb and lower 206Pb/207Pb end of this trend is near the greatest concentration of North
Carolina bedrock values from the literature (see section 2.3 above). However, most bedrock Pb
data plot higher in 208Pb/206Pb and lower in 206Pb/207Pb relative to stream water (Fig. 15).
Sources of Dissolved Strontium
The findings on 87Sr/86Sr in this study are in agreement with those of Watts et al. (2019)
and Cary (2018), that showed dissolved Sr in surface waters to be isotopically controlled by local
geology. In the headwaters of the Neuse and Cape Fear River basins, dikes with low 87Sr/86Sr
likely direct groundwater flow along easily-weathered mafic rock but lack significant surface
exposure. This results in a high degree of influence by dikes on the dissolved load composition
relative to the more common and higher 87Sr/86Sr country rock. In the Coastal Plain, a gradual
convergence toward recent seawater isotopic ratios nearing the coast reflects the isotopic change
in seawater Sr over time during the deposition and lithification of marine sedimentary bedrock,
successively extending to the modern shoreline. The resulting statewide trend, shown in Fig. 16,
is highest in the west, decreasing toward the east with the lowest values found in the Gondwana
and rift basin provinces, then increasing and converging toward the modern seawater value of
0.709. Stream water Sr is closely related to isotopic patterns in bedrock age, type, and structure.
Elemental concentrations support these findings, as the highly correlated Mg, Ca, and Ba are all
alkaline earth metals that readily substitute with Sr in minerals, and Na is a major component in
the common mineral plagioclase feldspar along with Ca. The elements Sr, Mg, Ca, and Na are
also important constituents in seawater, from which the bedrock of the Coastal Plain was
deposited. These combined isotopic and elemental results support the conclusion that bedrock
Sources of Dissolved Lead
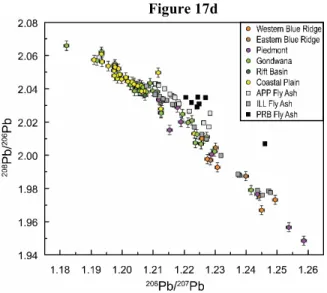
Lead isotope fingerprint plots (Figures 17a-f) show 208Pb/206Pb vs. 206Pb/207Pb for stream
water and potential geologic and anthropogenic influences. North Carolina bedrock values are
highly variable compared to the narrow ranges and linear trend of dissolved Pb from surface
water (Fig. 17a). Bedrock data from central North Carolina suggest a more consistent geologic
signature, and with a trend similar to that of water (Fig. 17b), yet the limitations on rock types
surveyed may contribute to the narrow ranges in values. Aside from a handful of isolated western
NC bedrock values, no geologic data could account for highest 206Pb/207Pb values in the water,
and those bedrock data are far from the dissolved Pb trend. Thus, our isotopic data are not fully
explained by geologic sources for which comparison data are available. Surface geology seems
to be of low importance, as data from the various geologic provinces show considerable overlap.
The Coastal Plain and Rift Basin values are statistically differentiated from the Blue Ridge
provinces, with each showing overlapping values among those pairings. The isotopic Pb values
in the Piedmont and Gondwana Terranes overlap all other provinces, and in fact represent the
extremes at each end of the linear trend. This indicates that major sources of dissolved Pb are
widespread, and location is not the primary control on isotopic differentiation. Additionally, the
dissolved Pb data most concentrated near bedrock Pb come from the Coastal Plain province, with
the largest spatial separation from available geologic data.
Stream water samples show the dissolved load to have a clear linear relationship. This is
inconsistent with derivation of Pb from geologic sources with variable U-Th/Pb and age. Rather,
this robust trend indicates that the primary control on the isotopic composition of dissolved Pb is
widespread and homogenous throughout the state. Only anthropogenic influences can create such
concentration of bedrock values is centered at one end of the dissolved Pb trend, and that central
North Carolina bedrock in particular show a near-linear trend overlapping with the lower
206Pb/207Pb end of the water data, their impact cannot be entirely discounted. The correlation
suggests that bedrock has a minor influence on the isotopic ranges of dissolved Pb, drawing
values toward higher 208Pb/206Pb and lower 206Pb/207Pb.
With data indicating an anthropogenic primary source for dissolved Pb, water data are
plotted with various possibilities on isotopic fingerprint plots (Figures 17c-f). In Figure 17c,
values accepted as the characteristic isotopic signature of US Pb-gas (Sherrell and Boyle, 1992;
Teutsch et al., 2001) are plotted as a zone in 208Pb/206Pb and 206Pb/207Pb. The range of 206Pb/207Pb
values given by the ALAS model, representing temporal change in anthropogenic Pb and in
which Pb-gas is a controlling factor of change, is indicated along that axis (Hurst, 2000; Kaplan,
2003). The isotopic trend of surface waters extends linearly toward lower 208Pb/206Pb and higher
206Pb/207Pb values, though its higher 208Pb/206Pb and lower 206Pb/207Pb values, dominantly from
samples collected from the sedimentary rock provinces of the Coastal Plain and rift basin,
coincide remarkably with Pb-gas (after Teutsch et al., 2001). Yet the trend given by Teutsch et
al. (2001) encompasses a much narrower range in 206Pb/207Pb than the ALAS model. About
two-thirds of the dissolved Pb data points fall within the range of the ALAS model, where the
maximum value is 1.218 (Hurst, 2000; Kaplan, 2003). Data from 1981 show that parts of the
eastern US had atmospheric 206Pb/207Pb of 1.224-1.225 (Patterson and Settle, 1987, Veron et al.,
1992), suggesting that the ALAS model may not fully represent the aerosol Pb signature of this
region. Therefore, if the signature in the eastern US was higher in 206Pb/207Pb than generalized
models, and if the relative 208Pb/206Pb to 206Pb/207Pb characterized by Sherrell and Boyle (1992)
indicate that the inputs of Pb-gas and its composition in this region have not been thoroughly
researched. Available data do not account for the highest 206Pb/207Pb values in stream samples.
Despite the potentially incomplete picture of Eastern US Pb-gas available in the literature, the
data suggest that Pb-gas remains a significant control on dissolved Pb in surface water in North
Carolina.
Lead signatures of fly ash from coal-burning power plants have recently been analyzed
by Wang et al. (2019). Fly ash data were categorized by the basins from which coal was
sourced, and each basin showed a slightly different signature in 208Pb/206Pb and 206Pb/207Pb.
Results from the Appalachian Basin (APP), Illinois Basin (ILL), and Powder River Basin (PRB)
coals are plotted with North Carolina Water in Figure 17d. Fly ash from both the Appalachian
Basin and Illinois Basin coals show a linear trend and plot along a similar slope to the water data
but are higher in 208Pb/206Pb relative to 206Pb/207Pb. The Powder River Basin coals have the
greatest difference in values from the water data and do not exhibit a trend on this plot.
Sediments analyzed from a lake in southeast North Carolina showed the strongest isotopic
correlation to APP coal, and were suggested to be significantly impacted by APP fly ash (Wang,
et al., 2019). Yet, of the fly ash sources analyzed in that study, the Illinois Basin coal is of
greatest interest because its trend is the most similar to dissolved Pb in streams statewide, and it
shows the greatest range in 206Pb/207Pb, though it does not reach the minimum or maximum
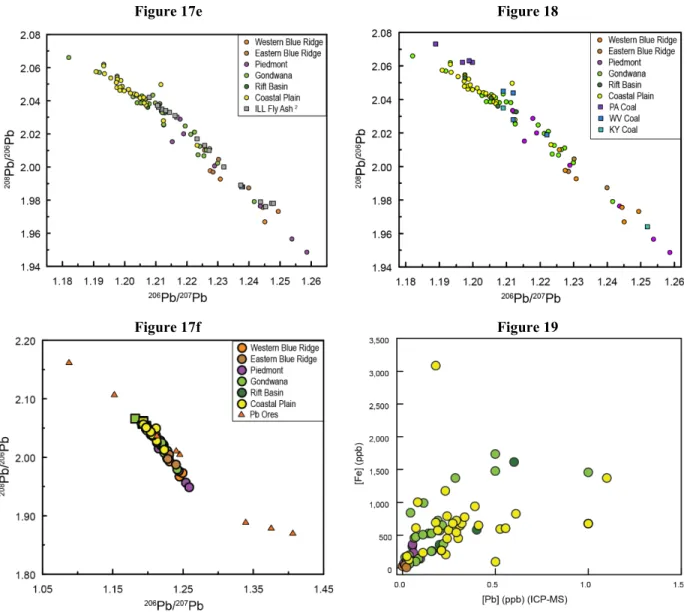
values found in water (Fig. 17e). However, isotopic coal data from the main sources used in
North Carolina energy production fall closer to the trend in surface water throughout the state,
especially the signatures from West Virginia and Kentucky coals (Fig. 18). The signature of
Pennsylvania coals is the highest in 208Pb/206Pb, and plotted against 206Pb/207Pb do not overlap
208Pb/206Pb and 206Pb/207Pb relative to the coals analyzed in Wang et al. (2019), ranges that are
strikingly similar to those in surface water data. The coal data are an especially significant match
at the higher 206Pb/207Pb values not attributable to published Pb-gas data. This isotopic evidence
from coals known to be burned in great quantities in North Carolina suggests that current coal
power production is also a significant control on the dissolved Pb signature in surface water.
Coal signatures have been established as having a similar Pb isotope relationship to that of
Pb-gas additives, though tending to trend higher in 206Pb/207Pb (Chow and Earl, 1972). If coal waste
and remnant Pb-gas are each contributing comparable quantities of labile Pb, the combined
influence of these two major sources would be expected to show a linear isotopic fingerprint as is
seen in water data in North Carolina.
Two samples from the same stream in the Yadkin-PeeDee Basin on the western edge of
the Piedmont province show values higher in 206Pb/207Pb than the nearest Pb-gas or coal values
in the literature. The geographic relationship between these samples and their relatively higher
206Pb/207Pb, though still linearly related to the rest of the dissolved Pb, suggests an upstream
point source of contamination mixing with the dominating sources discussed above. Industrial
processing of high 206Pb/207Pb ores, such as for steel production or metal refining, is the simplest
explanation. Dissolved Pb data are plotted with major Pb-ore source signatures in Figure 17f
(Wang et al., 2019). The three highest in 206Pb/207Pb are all located in states bounding the
Mississippi River, and are some of the closest large Pb deposits to North Carolina. The outliers
in dissolved Pb data suggest local industrial use of high 206Pb/207Pb ore, from which some waste
is mixing with the more significant signatures of gas and coal. The dominant control by
Further Analysis of Pb Sources Using [Pb] and Elemental Correlations
Incorporation of concentration data provides additional insight into sources influencing
dissolved Pb. An aspect of Pb concentration data indicating an anthropogenic source is the spike
in [Pb] within the Gondwana Terrane. Topographic variability is a control on land use, which
affects erosion rates and contaminant sources to streams. Widespread anthropogenic deposits are
subject to the patterns of weathering and erosion in the area of deposition. The Piedmont terrane,
at the base of the Appalachian Mountains and to the west of the Gondwana Terrane, is
characterized by significantly variable topography, including rolling hills and somewhat isolated
areas of small mountains. In contrast, the hills of the Gondwana Terrane have gentler slopes,
shallowing toward the boundary with the Coastal Plain (Stewart and Roberson, 2007). A high
percentage of the Blue Ridge and Piedmont provinces are forested, and would therefore have
relatively low erosion rates compared to areas with more agricultural and urban development
(McKerrow, 2006). The Gondwana Terrane is relatively higher than the Piedmont Province in
percentages of agricultural and urbanized land, land use types that increase erosion and
contaminant sources to streams (McKerrow, 2006).
The spike in Pb concentration, beginning near the boundary between the Piedmont and
Gondwana Terranes about 90 km downstream of the Eastern Continental Divide, may reflect
differences in topography and land use between the two provinces, as well as the resulting
erosional pattern. The rift basin province exists in two thin zones, parallel to other geologic
provinces and perpendicular to stream flow. The western of the two is bounded by the Piedmont,
is dominantly forested, and Pb concentration data are similar to Piedmont values. The eastern
basin is also highly forested and is located near the boundary between the Gondwana and Coastal
Terrane, with higher but more varied values than the western basin and other provinces to the
west. The Coastal Plain province, with gentle topography and dominantly sedimentary bedrock,
is especially high in agricultural land use (McKerrow, 2006). The resulting pattern of Pb
concentrations covers a wide range, trending higher to the east, with the lower values in the
range increasing steadily throughout the Coastal Plain.
Elemental correlations support an anthropogenic source for dissolved Pb. Atmospheric
Pb, which is overwhelmingly anthropogenic in origin, shows high particle affinity towards Fe (as
oxides; Teutsch et al., 2001), with which the Pb data from North Carolina surface waters are
highly correlated (Fig. 19). Data reporting correlations of Pb to other anthropogenic atmospheric
inputs suggest oil combustion as a major source of Ni and both coal combustion and steel
processing as significant sources of Cr (Nriagu and Pacyna, 1988). Our data suggest that as Ni
and Cr can be aerosolized during other anthropogenic processes involving atmospheric Pb
inputs, combustion of Pb-gas is also a potential source of these components. However, this study
by Nriagu and Pacyna did not collect data on major or trace components of Pb-gas (the
dominating source of atmospheric Pb at the time of that study), nor did it assess inputs for Al or
Be, with which our dissolved Pb were also highly correlated.
Another anthropogenic source is agricultural production. Unfortunately, robust data on
the chemistry of various agricultural influences are not available. This requires information on
what fertilizers are being applied, in what regions of NC and in what quantities, along with
isotopic analyses of the Pb present. However, elemental correlations provide the basis for a
simple analysis of the impact of fertilizer use on dissolved Pb. Fertilizer products are applied
mainly to increase the concentration of the nutrients N, P, and/or K in soils. Lead shows only
(nitrogen levels were not analyzed). This suggests that variation in [Pb] is unlikely to be
significantly attributable to fertilizer use. Existing data are insufficient to speculate on the degree
of influence from agricultural products on North Carolina dissolved Pb. Without a robust survey
of fertilizer use in North Carolina agriculture, including chemical analyses of types of fertilizers
used as well as the volumes and locations of the use of each, no firm conclusions about their
influence may be drawn. Acknowledging the absence of such data, however, we suggest that
agricultural practices are improbable as a major control on dissolved Pb because the variety of
fertilizers applied is unlikely to have a widely distributed and minimally varying isotopic Pb
signature, as is required by the robust water trend.
CONCLUSIONS
This study of the dissolved load in North Carolina surface waters finds Sr sourced
primarily from bedrock, with significant seawater contribution approaching the coast. Strontium
isotopes vary widely in the middle of the state where a network of mafic dikes is proposed to
exert structural control on groundwater flow and have disproportionate influence on the
dissolved load relative to surface exposure. Elemental correlations Sr support the evidence from
isotopic analysis.
In contrast, Pb is widespread and isotopic values from the central terranes show
significant overlap with all provinces, indicating that location and geology are not the dominant
controls on isotopic differentiation and suggesting that Pb is derived primarily from
anthropogenic sources. The Pb data are isotopically closely related to North American leaded
gasoline, regardless that it was phased out for road-use vehicles in the 1990’s. On an isotopic
fingerprint plot, the values from water which are lower in 206Pb/207Pb show the strongest
coal burned in North Carolina power plants. Bedrock appears to be a minor contributor of Pb;
however, as water moves away from its source, this Pb isotopic signature is quickly
overwhelmed as [Pb] rises. Elemental correlations with Pb are also indicative of anthropogenic
sources, and support the findings from isotopic evidence. The combined isotopic record in the
literature of Pb-gas additives from the 20th century and eastern US coals still burned in power
plants today suggest a mixture of waste from these sources dominates the dissolved Pb in North
Figure 1
Figure 1: Map of the generalized geologic provinces of North Carolina; after Stewart and Roberson (2007) and NCDEQ (2015)
Figure 2
Figure 3
Figure 3: An isotopic fingerprint plot of North Carolina bedrock, plotted as 208Pb/206Pb vs. 206Pb/207Pb. Western NC
data from Sinha et al. (1996) and Fisher (2010), and central NC data are from LeHuray (1986) and Callegaro et al. (2013)
Figure 4