UNDERSTANDING ASSOCIATIONS OF ALCOHOLIC BEVERAGE CONSUMPTION WITH WEIGHT STATUS
Jennie Lauren Butler
A dissertation submitted to the faculty of the University of North Carolina at Chapel Hill in partial fulfillment of the requirements for the degree of Doctor of Philosophy in the Department
of Nutrition in the Gillings School of Global Public Health.
Chapel Hill 2016
Approved by: Barry Popkin Jennifer Poti
iii
ABSTRACT
Jennie Lauren Butler: Understanding Associations of Alcoholic Beverage Consumption with Weight Status
(Under the direction of Barry M. Popkin and Jennifer M. Poti)
Contradictory findings exist on associations between alcoholic beverage consumption with Waist Circumference (WC) and Body Mass Index (BMI). Confounding by dietary intake and variation in associations by drinking level and/or alcoholic beverage type likely contribute to mixed literature. The overarching goal of this dissertation was to shed light on inconsistencies in the alcohol and obesity literature by investigating confounding by dietary intake and associations of changes in alcohol intake with WC and BMI change.
iv
heavy drinking and WC and BMI in women were strengthened after adjustment for carbohydrate and sugar intakes.
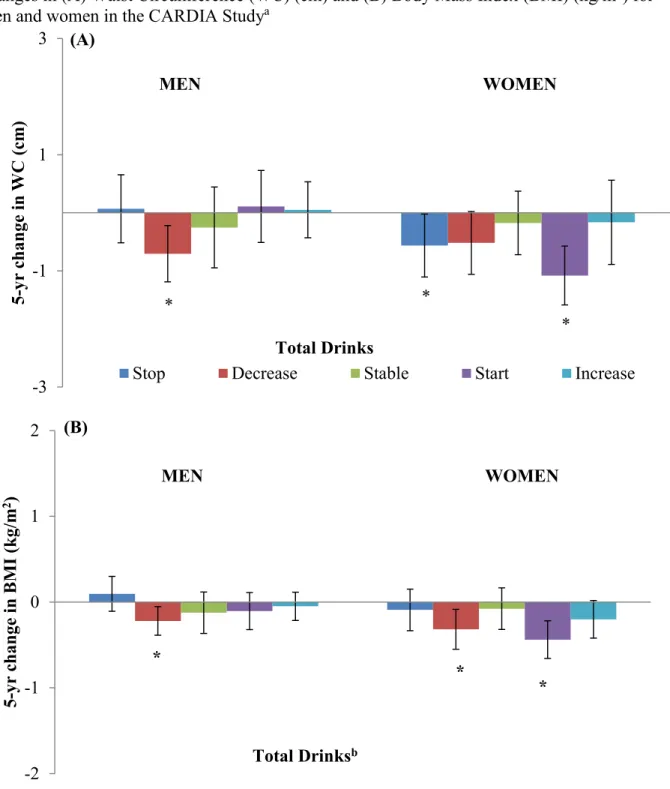
Next a prospective study of data from 1,894 men and 2,252 women utilizing 25 years of Coronary Artery Risk Development in Young Adults (CARDIA) study data investigating associations of 5-yr changes in alcohol intake with 5-yr WC and BMI change was conducted. Random effects linear regression models were used to determine whether 5-yr changes in drinking were associated with 5-yr WC and BMI change. In men, decreasing drinking,
particularly stopping excessive drinking was associated with lower 5-yr WC gains. In women, increasing wine intake and decreasing liquor intake was associated with lower 5-yr WC and BMI gains.
v
ACKNOWLEDGEMENTS
I would like to express my most sincere and heartfelt gratitude to my dissertation
vi
being supportive and available and for teaching me how to use SAS. Thank you for allowing me a safe space to talk about and reinforce the statistical concepts I was learning and applying. I am an auditory learner and being able to discuss statistical techniques with you was critical to my success.
In addition, I wish to acknowledge faculty mentors Drs. Beth Mayer-Davis, Linda Adair and Meghan Slining, and fellow cohort members, students and friends Cassandra Johnson, Rachel Bordogna, Melecia Wright, Pasquale Rummo, Fei Dong, Mellissa Cunningham, Victor Zhong, Lily Pedraza, Nancy Lopez Olmedo, Tania Aburto and Ben Tzeel for emotional,
professional and social support. Huge thanks to Drs. Shuwen Ng and Lindsey Smith-Tallie and to Emily Yoon, Phil Bardsely, Donna Miles and the entire Global Food Research Program team. In addition thank you to my family and friends for continued love and support.
I would also like to acknowledge the funding sources that supported this work: HHSN268201300025C, HHSN268201300026C, HHSN268201300027C,
HHSN268201300028C, HHSN268201300029C, and HHSN268200900041C from the National Heart, Lung, and Blood Institute and the Intramural Research Program of the National Institute on Aging; Robert Wood Johnson Foundation (RWJF 67506, 68793,70017, 71837), the National Institutes of Health (NIH R01DK098072; R01HL104580), a National Institutes of Health National Research Service Award (NIH-NRSA 2T32DK007686-21), and the Carolina Population Center (CPC 5 R24 HD050924) .
vii
TABLE OF CONTENTS
LIST OF TABLES………..….x
LIST OF FIGURES………..………...xi
LIST OF ABBREVIATIONS………..………...xii
CHAPTER 1.INTRODUCTION………...…..1
Overview……….……….…....1
Research Aims………...……..……2
CHAPTER 2.LITERATURE REVIEW..……….………...4
What is known about the relationship between alcohol intake and WC and BMI?….…...4
Why is daily drinking important in associations of alcoholic beverage intake with WC and BMI?……….………...……...…...6
Why consider confounding by dietary intake?………..……...7
Why is alcoholic beverage type important in associations of alcoholic beverage intake with WC and BMI?………8
Why do studies need to examine changes in alcohol intake over time in relation to WC or BMI changes?...………9
CHAPTER 3. ASSOCIATIONS BETWEEN ALCOHOLIC BEVERAGE CONSUMPTION, DIET AND OBESITY MEASURES IN US ADULTS, NHANES 2003-2012………...…12
Overview……….………...…………...….12
Introduction……….………...……...….13
Methods..……….………...………...….14
viii
Results....……….………...…18
Discussion.……….…...………...…...…...19
CHAPTER 4. ASSOCIATIONS OF 5-YEAR CHANGES IN ALCOHOLIC BEVERAGE INTAKE WITH 5-YEAR CHANGES IN WAIST CIRCUMFERENCE AND BMI IN THE CORONARY ARTERY RISK DEVELOPMENT IN YOUNG ADULTS (CARDIA) STUDY.………..………...…33
Overview……….………...…..33
Introduction……….………...…………...….34
Methods..……….………...…35
Changes in total alcohol intake……….…………..……...…38
Changes in drinking level……….………..……...38
Changes in alcoholic beverage type……….……...……...39
Anthropometrics……….……….……...…...….39
Statistical Analyses……….………...40
Covariates………..……….………...………...….41
Results....……….………..….42
Discussion..……….………..….44
CHAPTER 5.SYNTHESIS………..……….…………...…..60
Overview of findings………...…..…60
Understanding dietary intake in associations of alcohol intake with WC and BMI..………..………..…..………..61
Differential associations of alcohol intake with WC and BMI by sex………….………...…63
Associations between daily drinking level and changes in alcohol intake with WC and BMI………...………..65
Variation in findings by alcoholic beverage type………....………..67
ix
Significance and public health impact……….………...………...70
Future Directions……….…...………...71
APPENDIX 3.1 SUPPLEMENTAL METHODS……….……….………...74
APPENDIX 3.2 SUPPLEMENTAL ANALYSES………..……...………...75
APPENDIX 3.3 TABLE OF DIFFERENCES IN ENERGY INTAKE AND MACRONUTRIENT CONTRIBUTIONS BETWEEN DRINKERS AND NON-DRINKERS, NHANES 2003-2012……...…...…..………...76
APPENDIX 3.4 TABLE OF DIFFERENCES IN WC AND BMI OF DRINKERS COMPARED TO NON-DRINKERS IN MEN, NHANES 2003-2012……...………...…...78
APPENDIX 3.5 TABLE OF DIFFERENCES IN WC (CM) AND BMI (KG/M2) OF DRINKERS COMPARED TO NON-DRINKERS IN WOMEN, NHANES 2003-2012………...………...79
x
LIST OF TABLES
Table 3.1 Survey weighted distribution of covariates by sex and daily
drinking level, NHANES 2003-2012………...……...………...24 Table 3.2 Associations between daily drinking level, diet and obesity
measures, NHANES 2003-2012……...……….…..27 Table 3.3 Differences in energy intake (kcal/d) and macronutrient contributions (%)
between drinkers and non-drinkers, NHANES 2003-2012………...…...………..29 Table 3.4 Differences in WC (cm) and BMI (kg/m2) of drinkers compared
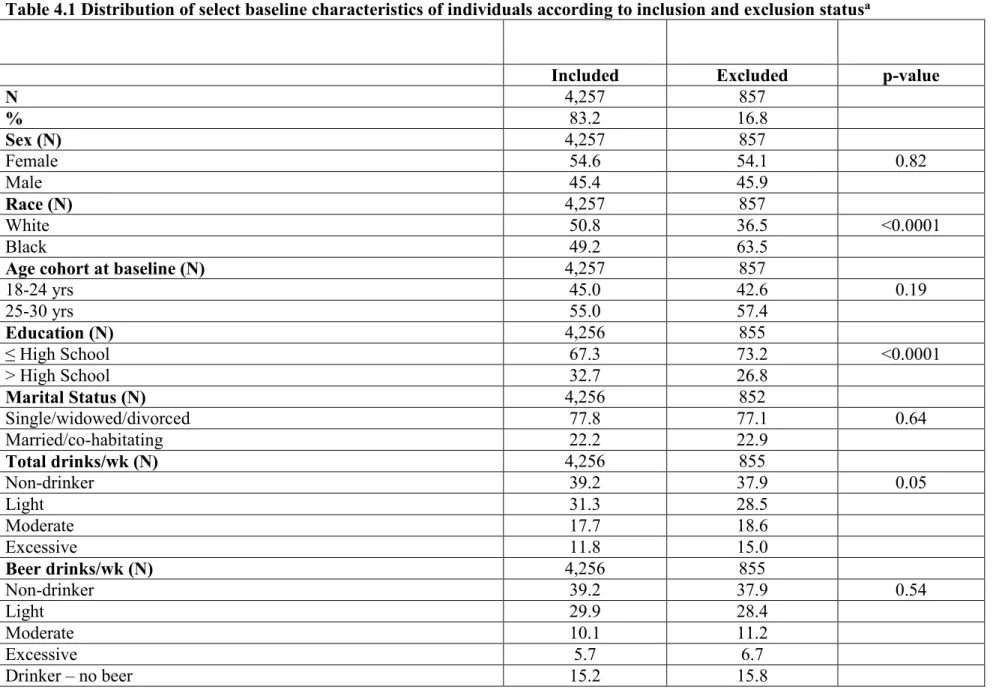
to non-drinkers, NHANES 2003-2012……...……....……..31 Table 4.1 Distribution of select baseline characteristics of individuals
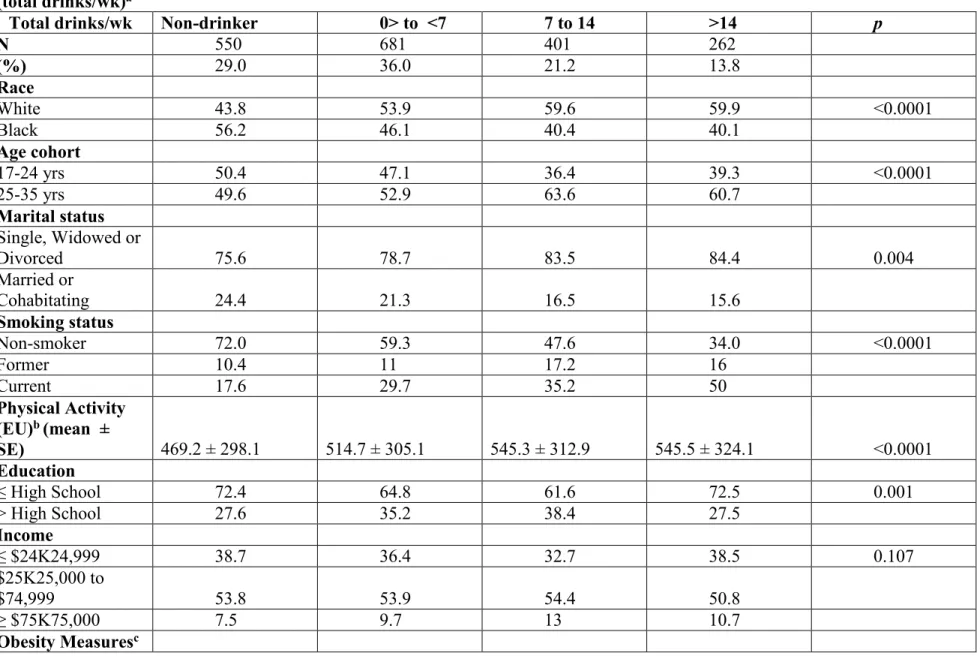
according to inclusion and exclusion status...……...…...…49 Table 4.2 Baseline characteristics of men in the CARDIA study 1985-1986,
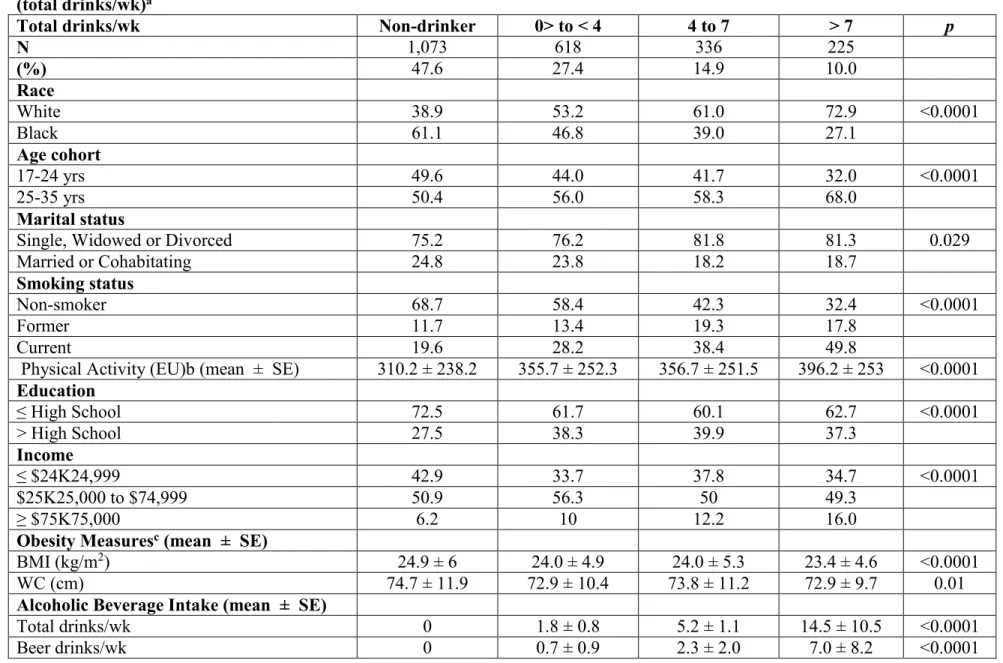
according to baseline alcoholic beverage intake (total drinks/wk)...51 Table 4.3 Baseline characteristics of women in the CARDIA study 1985-1986,
xi
LIST OF FIGURES
Figure 4.1 Adjusted associations of 5-year changes in total alcoholic beverage intake with 5-year changes in Waist Circumference (WC) (cm) and Body Mass Index
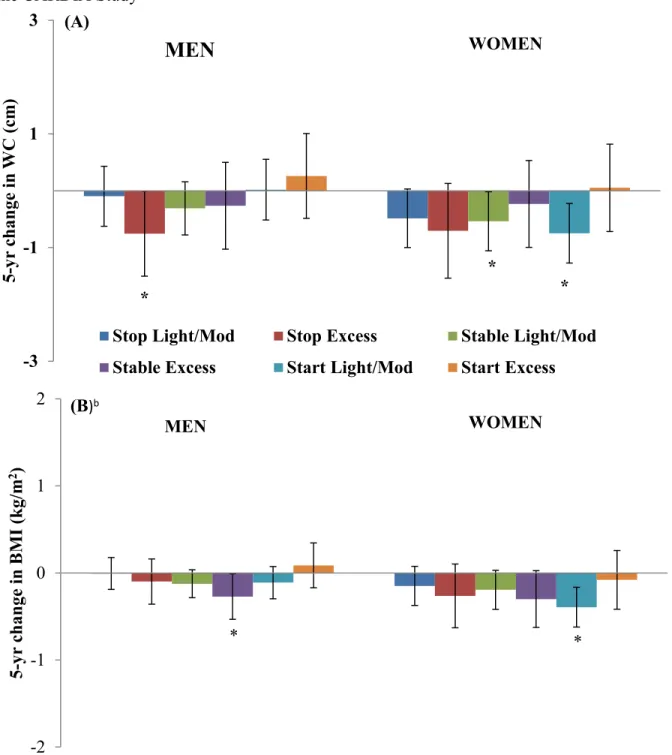
(BMI) (kg/m2) for men and women in the CARDIA Study………...56 Figure 4.2 Adjusted associations of 5-year changes in drinking level with 5-year
changes in Waist Circumference (WC) (cm) and Body Mass Index (BMI) (kg/m2)
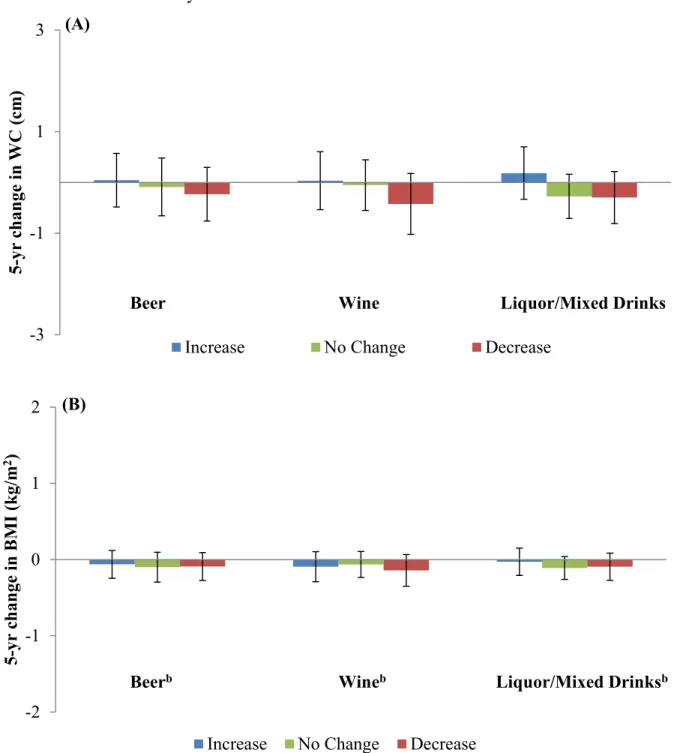
for men and women in the CARDIA Study………..………….……57 Figure 4.3 Adjusted associations of 5-year changes in alcoholic beverage intake
by type with 5-year changes in Waist Circumference (WC) (cm) and Body
Mass Index (BMI) (kg/m2) in men in the CARDIA Study.………...…………58 Figure 4.4 Adjusted associations of 5-year changes in alcoholic beverage intake
by type with 5-year changes in Waist Circumference (WC) (cm) and Body
xii
LIST OF ABBREVIATIONS AND SYMBOLS
β Beta
% Percent
% Carb Carbohydrate contribution to total energy intake % Prot Protein contribution to total energy intake % Fat Fat contribution to total energy intake
AL Alabama
ANOVA Analysis of Variance AUQ Alcohol Use Questionnaire BP Blood Pressure
BMI Body Mass Index BMR Basal Metabolic Rate
CA California
CARDIA Coronary Artery Risk Development in Young Adults CDC The Centers for Disease Control
CI Confidence Intervals cm Centimeters
DGA Dietary Guidelines for Americans drinks/d Drinks per day
drinks/wk Drinks per week EU Exercise Units ethanol/d Ethanol per day
xiii GED General Equivalency diploma grams/d Grams per day
HbA1c Hemoglobin A1c h/d Hours per day
Hg Mercury
HS High School
IL Illinois
kcal Kilocalories
kcal/d Kilocalories per day
kg Kilograms
kg/m2 Kilograms per meters squared MEC Mobile Examination Center Mex-Am Mexican American
mg/DL Milligram per deciliter mm Millimeters
MN Minnesota
NHANES National Nutrition and Health Examination Survey NHB Non-Hispanic black
NHW Non-Hispanic white
NIAAA National Institute on Alcohol Abuse and Alcoholism Non-alc Bev Non-alcoholic Beverage
obs Observations
oz Ounce
xiv SBP Systolic Blood Pressure
TX Texas
US United States
USDA United States Department of Agriculture
vs. Versus
WC Waist Circumference WWEIA What We Eat in America
yr Year
1
CHAPTER 1. INTRODUCTION
Overview
The 2014 National Survey on Drug Use and Health indicates that 87.6% of US adults reported consuming alcohol in their lifetime; 71.0% reported annual and 56.9% reported monthly drinking. [1] Of those, 24.7% reported binge drinking in the past month. The history of alcoholic beverage consumption dates back centuries. Alcoholic beverages are likely one of the first
processed beverages consumed in the US and are now ubiquitously consumed across the country. [2] While moderate alcoholic beverage consumption has been inversely associated with obesity, weight gain, and increases in obesity measures over time, excessive alcohol use has been positively associated with obesity risk and WC and BMI gains.[3] Yet, contradictory findings exist regarding the relationship between alcoholic beverage consumption and measures of weight status; mixed literature is likely due to a variety of factors.
One reason for inconsistent findings could be that the differing definitions of alcohol intake are used across studies. In observational research, the metrics used for alcoholic beverage consumption and obesity and weight-related outcomes vary across studies. For example,
2
weight-related measures into one conclusive statement. However, it may not appropriate to reconcile relationships between alcohol intake and various measures of weight status into one conclusive finding.
Research Aims
The overarching goal of this research project was to examine associations between alcohol intake and weight status, using two dimensions of alcohol consumption (i.e., number of alcoholic beverages and beverage type) and two weight-related outcomes (i.e., waist
circumference (WC) and body mass index (BMI)), while taking into account confounding by dietary intake, changes in alcohol intake and changes in WC and BMI over time.
3
Aim 1: Determine cross-sectional associations between drinking level with diet, WC and
BMI among US adults.
First, we used NHANES data and a series of multivariable linear regression models to test associations between the number of drinks per day (categorized by sex-specific daily drinking levels) and total energy, food and non-alcoholic beverage energy (kcal/d) and the percent contribution of macronutrients and sugar to non-alcoholic energy (% kcal/d) in drinkers compared to non-drinkers. Next, we used multivariable linear regression models, with and without adjustment for dietary intake variables, to test associations between daily drinking level with WC and BMI in drinkers compared to non-drinkers.
Aim 2: Identify associations between change in alcoholic beverage intake and change in
WC and BMI. Determine whether variation in associations exists by beverage type.
4
CHAPTER 2. LITERATURE REVIEW
Over the last two decades increases in alcoholic beverage intake in the US have been reported. According to NHANES data the proportion of drinkers on any given day increased from 12.8% in 1989-91 to ~23% from 2006 through 2012. Alcoholic beverage calorie intakes among drinkers increased from approximately 300 kcal/d to 441 kcal/d over the same time period. According to these estimates, drinkers in the US may consume the equivalent of 3.7 glasses of wine (18.4 oz), 2.9 cans of beer (35.3 oz) or 4.4 shots of liquor (6.6 oz of liquor) on any given day. [4] Furthermore, the percentage contribution of alcoholic beverage intake to total energy intake among consumers on any given day has increased from 14.0% to 17.2% over the last 20 years. Concurrent with these trends in alcoholic beverage calories, secular increases in waist circumference (WC) and body mass index (BMI) have been reported in the US. [5-7] Yet, associations between alcohol intake and WC and BMI are unclear.
What is known about the relationship between alcohol intake and WC and BMI?
5
moderate consumption has no or inverse associations with obesity or overweight. [10] The Poli review did not separate findings for alcoholic beverage intake in relation to WC, which is a measure of abdominal obesity, from that of BMI, a measure of general obesity. [10]
Additionally, because WC is a measure of visceral fat it is thought to be a better indicator of cardio metabolic health risks. [11]Thus, it is important to understand whether associations of alcohol intake with WC differ from associations with BMI. Another review, presented
conflicting observational evidence regarding associations between grams/d of ethanol intake and abdominal obesity (WC) vs. general obesity (BMI) in men and women. [3] Zhou et al
6
Why is daily drinking important in associations of alcoholic beverage intake with WC and
BMI?
The 2015-2020 Dietary Guidelines for Americans (DGA) recommends that alcoholic beverages be consumed in moderate levels of ≤2 drinks per day (drinks/d) for men and ≤ 1 drink/d for women.[13] In fact, these recommendations have been in place since the 1990 issue of the DGA. The Centers for Disease Control (CDC) includes heavy and binge drinking
behaviors under the definition of excessive drinking. Heavy drinking is defined as >2 drinks/d for men and > 1 drink/d for women. Binge drinking is defined as ≥5 drinks on a single occasion for men and ≥4 drinks on a single occasion for women. [14] Increases in excessive drinking coupled with a trend in increasing calories consumed from alcoholic beverages in the US over the past two decades have been reported. [15-17] Given that excessive drinking and overweight and obesity are of public health concern, and the theory that alcoholic beverage consumption may be a risk factor for obesity, an examination of associations between daily drinking level and weight status in the US is warranted. [7, 8] However, we could find no studies that examined associations of sex-specific DGA defined drinking levels and WC and BMI.
non-7
drinkers .[22, 23] In another study of Australian men, those who consumed ≥ 5 drinks/d had statistically significantly higher estimates of BMI and WC as compared to non-drinkers. [24] In Korean drinkers, results seem to be more consistent across sex groups, men who consumed ≥ 7 drinks/d and women who consumed ≥ 3 drinks/d had higher odds of abdominal obesity as
compared to those who drank 1 to 2 drinks/d. [25] Similarly, in a study of current drinkers in the US a statistically significant increasing trend in BMI, although small in magnitude, was observed with increasing frequency categories of drinking (from 1 drink/d to ≥ 4 drinks/d) in men and women. [26] While reviews of the literate have reported that moderate and regular consumption of alcoholic beverages may be protective against obesity and excessive drinking may contribute to obesity, the definitions of moderate and excessive drinking vary from study to study. [8, 21] Defining alcohol intake based on national recommendations makes findings more easily
translatable at the policy and practice levels. A current gap in the literature is whether the sex-specific daily drinking level recommendations in the US are associated with WC and BMI as compared to non-drinkers.
Why consider confounding by dietary intake?
Dietary intake has been hypothesized to be a key confounder in associations between alcohol intake and obesity measures. [9, 27, 28] Alcoholic beverage consumption has been linked to poor diet quality, altered dietary composition and lower intake of carbohydrates, sugar and select food and non-alcoholic beverage groups as compared abstention. [29-32]
Clinical studies indicate that gustatory neural pathways and opioid or dopaminergic systems related to food reward may influence food consumption following alcoholic beverage
8
strong association between alcohol consumption and sweet taste, suggesting that alcoholic beverage consumption may be negatively associated with added sugar intake from highly palatable, energy dense foods. [37-39] It has been suggested that drinkers may replace food (i.e. meals and snacks) and non-alcoholic beverages with alcoholic beverages. This replacement would, in part, be evidenced by lower intake of foods and non-alcoholic beverages in drinkers as compared to non-drinkers. [22, 23, 29, 30, 40, 41] Yet, associations between alcohol intake and food, non-alcoholic beverages, macronutrient and sugar intakes are not well established. We aimed to fill this literature gap by determining associations of sex-specific daily drinking level recommendations in the US with energy, macronutrient and sugar intakes using NHANES data. These findings can be used to inform future research can be used to inform future studies
elucidating associations of alcohol intake with subsequent dietary intake.
Why is alcoholic beverage type important in associations of alcoholic beverage intake with
WC and BMI?
A 2011 systematic review of the literature emphasized the lack of conclusive evidence regarding associations of alcohol intake with weight gain and suggested that future research examining differing types of alcoholic beverages in associations between alcohol intake and body weight was warranted. [9] Alcoholic beverages (i.e. beer, wine, liquor and mixed drinks) contain non-alcohol ingredients that differ according to beverage type and may have differing effects on energy intake, metabolism, weight gain and adiposity. [42-47] For example,
polyphenols in beer and wine have been inversely associated with body weight and BMI. [3] Specifically, resveratrol in red wine and isohumulone in beer may have beneficial effects on lipid metabolism which might lead to lower WC and BMI gains. [3, 8, 9, 48-50].
9
beer, wine, liquor/mixed drinks) is associated with WC or BMI gains [8-10, 44, 45, 51-58]. Studies in the Mediterranean, Denmark, Japan, France and Sweden have reported conflicting and differing associations across sex groups and by alcoholic beverage subtype with WC and BMI outcomes. [47-51] A recent meta-analysis on the topic of beer consumption and obesity reported that there was inadequate evidence to determine whether beer intake at baseline or changes in beer intake was associated with WC and BMI change. [45] Prospective studies examining change in alcohol intake in relation to weight gain, although still not conclusive, tend to suggest that increasing alcohol intake, overall and by type, is associated with weight gain in men, but not associated or negatively associated with weight gain in women, over 1, 3 and 4 year study periods. [58-60] While wine intake has been negatively associated with weight gain, positive associations with liquor consumption have been reported. [9, 55, 58] Additional studies
assessing beer, wine and liquor/mixed drink intake in relation to changes in WC and BMI among US adults are needed to build the evidence base. [8, 58, 59, 61-63]
Why do studies need to examine changes in alcohol intake over time in relation to WC or
BMI changes?
The current evidence base is made up of prospective studies that define alcoholic beverage consumption at baseline and estimate associations with WC and BMI <5 years and up to 13 years subsequent to baseline. [8, 45] Drinking behaviors change over time and these changes may be due to immeasurable time-invariant factors such as individual health
10
statistically significant associations between change in alcohol intake and WC or BMI gains over 3 and 8.5 year periods. [61, 62] Of the few studies with statistically significant associations, one reported that maintaining high intakes of beer was negatively associated with 10 year BMI change in men and women. [63] Likewise, 3.7 year increases in total alcohol intake have been significantly associated with lower WC gain over the same time period with no associations by beverage type. [64] A major gap in the literature is whether or not changes in alcohol intake are related to changes in WC and BMI and if variation in associations by alcoholic beverage type exists.
Additionally, studying within-person change in alcoholic beverage intake by type may provide less biased estimates of associations by capturing immeasurable time-invariant
characteristics of health and culture. [8, 9, 44] Differential associations of beer, wine and liquor intake with individual diet, lifestyle and socio-demographic characteristics have been reported. These associations may be related to underlying health consciousness in wine drinkers as compared to beer and liquor/mixed drinkers. [27] In the US wine drinking has been associated with higher intakes of food and beverage groups supported by the DGA, and whereas beer and spirit intake have been associated with foods and nutrients that should be consumed in
time-11
12
CHAPTER 3. ASSOCIATIONS BETWEEN ALCOHOLIC BEVERAGE
CONSUMPTION, DIET AND OBESITY MEASURES IN US ADULTS, NHANES 2003-2012
Overview
13
Introduction
Between 2012 and 2013, 70.7% of adults in America reported alcoholic beverage
consumption and 68.8% were considered to be overweight or obese. [70, 71] There is a wealth of conflicting epidemiologic findings regarding the relationship between alcoholic beverage
consumption and obesity measures such as waist circumference (WC) and body mass index (BMI). Differences in dietary intake between drinkers and non-drinkers have been cited as one reason for inconclusive results. [8, 9, 27] The 2015-2020 Dietary Guidelines for Americans (DGA) recommends that alcoholic beverages be consumed in moderate levels of ≤2 drinks per day (drinks/d) for men and ≤ 1 drink/d for women.[13] While moderate and regular
consumption of alcoholic beverages may be protective against obesity, excessive drinking may contribute to obesity among some individuals. [8, 21] The Centers for Disease Control (CDC) includes heavy and binge drinking behaviors under the definition of excessive drinking. Heavy drinking is defined as >2 drinks/d for men and > 1 drink/d for women. Binge drinking is defined as ≥5 drinks on a single occasion for men and ≥4 drinks on a single occasion for women. [14] Increases in excessive drinking coupled with a trend in increasing calories consumed from alcoholic beverages in the US over the past two decades have been reported. [15-17] Given that excessive drinking and overweight and obesity are of public health concern, an examination of associations between daily drinking level, diet and obesity measures in the US is warranted. [8]
14
replace food (i.e. meals and snacks) and non-alcoholic beverages with alcoholic beverages. This replacement would, in part, be evidenced by lower intake of foods and non-alcoholic beverages in drinkers as compared to non-drinkers. [22, 23, 29, 30, 40, 41] Yet, associations between drinking level, as defined by the DGA and CDC recommendations with food, non-alcoholic beverages, macronutrient and sugar intakes are not known.
In men, positive, inverse and null findings have been reported across studies of alcohol and obesity measures. [8, 9, 26, 40] In women, numerous studies have reported that drinking ≥ 2 drinks/d is negatively associated with obesity measures. [9, 19, 22, 28, 72, 73] Residual
confounding by dietary intake has been cited as one reason for conflicting findings because some studies fail to adjust for dietary components as confounders in statistical analyses. [8, 9, 27, 28] The overarching aim of this study was to determine the associations of alcoholic beverage consumption with WC and BMI utilizing the current US sex-specific daily drinking level recommendations to categorize drinkers. Associations between drinking level and total energy, non-alcoholic energy (food plus non-alcoholic beverages), food, non-alcoholic beverages and macronutrient and sugar contributions to non-alcoholic energy were determined. To examine the robustness of relationships between drinking level and obesity measures, associations were examined with and without adjustment for dietary intake variables.
Methods
The National Health and Nutrition Examination Survey (NHANES) is a repeated, cross-sectional survey of the civilian, non-institutionalized US population administered by the National Center for Health Statistics division of the Center for Disease Control and Prevention and
15
physical examinations via a Mobile Examination Center (MEC). NHANES dietary recalls are interviewer-administered using the USDA Automated Multiple-Pass Method and include one in-person 24-hour dietary recall and a second recall collected 3 to 10 days later by phone. [74-78] The MEC physical examinations includes anthropometric measurements of height, weight and waist circumference administered by trained professionals. [79, 80]
The current study subsample was derived from adults aged 20 - 79 years with complete alcoholic beverage intake questionnaires and 2 days of dietary recall data deemed reliable by study investigators from five pooled cycles of NHANES from 2003 – 2012 (n=17,182). Adults missing anthropometric outcomes were excluded (WC: n=405; BMI: n=29). Pregnant and breastfeeding women and adults who reported following a medical or intentional weight loss diet in the past year or those missing information on intentional weight loss were excluded (n=3,888). Participants missing complete covariate data (n=957) were excluded. The final analytic sample included 11,903 men (n=6,018) and women (n=5,885). This secondary data analysis was exempt from institutional review board approval. Analyses were conducted in the Fall of 2015.
Measures
16
drinks/day)”; women were classified as "non-drinker", "moderate drinker (1 drink/day)", "heavy drinker (2 to 3 drinks/day)" or "binge drinker (≥ 4 drinks/day)". [13, 14, 86]
Dietary intake data were utilized from What We Eat in America (WWEIA) portion of NHANES. USDA Nutrient information for WWEIA-NHANES comes fromthe USDA Food and Nutrient Database for Dietary Studies , based on nutrient values in the USDA National Nutrient Database for Standard Reference. [87] Non-alcoholic energy intake was calculated as the sum of non-alcoholic beverages plus food kilocalories per capita per day (kcal/d). Non-alcoholic
beverage intake was calculated as the sum of calories from all beverages excluding beer, wine, liquor and mixed drinks (kcal/d). Macronutrient intakes were calculated as the sum of the grams of each macronutrient from food and non-alcoholic beverage groups, multiplied by 4 kcal/g, 4 kcal/g and 9 kcal/g for carbohydrates, protein and fat, respectively. Sugar intake was calculated as the total grams of sugar from food and non-alcoholic beverage groups foods multiplied by 4 kcal/g. The final carbohydrate intake variable was calculated by subtracting sugar intake from total carbohydrate intake. All dietary intake variables were calculated from the average of two 24-hour dietary recalls. Implausible energy intakes are an inherent limitation of using dietary recall data to estimate energy intakes. [88-90] The revised Goldberg method was used to identify implausible energy intakes and categorize adults as dietary underreporters, overreporters, or accurate reporters, as described in Appendix 3.1.
17
For unadjusted descriptive analyses weight status was categorized as healthy weight (BMI <= 24.99 kg/m2), overweight (BMI 25.0 - 29.99 kg/m2), or obese (BMI >=30 kg/m2). Abdominal obesity was defined as WC >88 cm (women) or >102 cm (men).
Statistical Analyses
All analyses used survey commands within Stata, version 14 (Stata Corp, College Station, TX) to account for complex survey design and incorporate survey weights. Analyses were stratified by sex and included the following covariates: age group (20–39, 40–59, 60-79 years), race/ethnic group (non-Hispanic white [NHW], non-Hispanic black (NHB), Mexican American (Mex-Am), and other races/ethnicities), education (less than high school (< HS), high school graduate (HS), greater than high school education (>HS)), family income based on the federal poverty level (FPL) thresholds for supplemental assistance programs available to adults (0–130% FPL, 131–299% FPL, ≥ 300% FPL), smoking status (current, never, or former), marital status (single/never married, formerly married, currently married/cohabitating), physical activity level (low, moderate, high), average hours of sedentary activity per day (continuous), dietary misreporting status (over reporter, accurate reporter, under reporter), survey year of data
collection (2003-2004, 2005-2006, 2007-2008, 2009-2010, 2011-2012), self-reported history of major chronic disease (cardiovascular disease, stroke or cancer(y/n) ), day of first dietary recall (weekend/weekday), and day of second dietary recall (weekend/weekday).
18
Statistical significance was defined based on P<0.05, with Bonferroni correction for multiple comparisons.
To test associations between daily drinking level and diet and obesity measures of each drinking level category compared to non-drinkers, a series of multivariable linear regression models were used to regress outcome variables (continuous) on drinking level (indicator
variables for non-drinker (0/1), moderate (0/1), heavy (0/1) and binge (0/1) drinking categories). Models with dietary outcomes as dependent variables were adjusted for age, race/ethnicity, education, physical activity level, survey year, chronic disease status, day of dietary recall 1, day of dietary recall 2, smoking, and dietary misreporting status. Models with obesity measures as dependent variables were adjusted for age, race/ethnicity, education, marital status, physical activity level, survey year, day of recall 1, day of recall 2, daily sedentary time, smoking status, FPL% and dietary misreporting status. A change in estimate of >10% was used as an a priori
criterion to indicate confounding bias from dietary intake variables in regression models.
Results
The survey weighted distribution of covariates by sex and drinking level are presented in Table 3.1. The unadjusted associations of diet and obesity measures by sex and drinking level are presented in Table 3.2.
non-19
drinking counterparts. Heavy drinking (2 -3 drinks/d) women consumed less energy from non-alcoholic beverages (β:-56 kcal/d; 95% CI: -74,-38) than non-drinkers. Carbohydrates and sugar contributed less to total non-alcoholic energy intake all drinking subgroups as compared to non-drinkers.
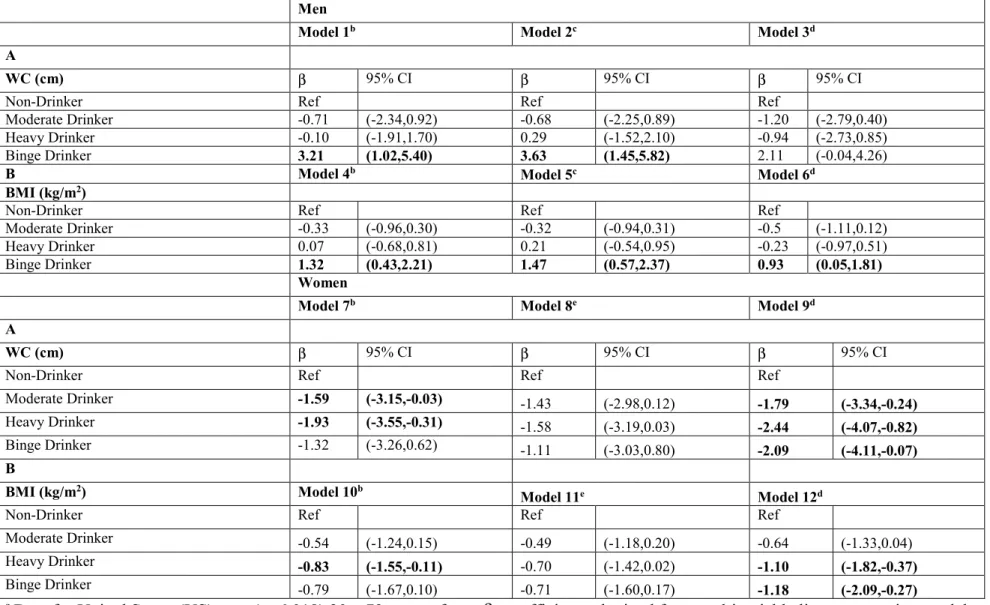
Adjusted differences in obesity measures of drinkers compared to non-drinkers are presented in Table 3.4. Differences in WC and BMI in binge drinking men, compared to non-drinkers, were + 3.21 cm (95% CI: 1.02,5.40) and +1.32 kg/m2 (95% CI: 0.43,2.21) (Model 1). Associations were strengthened after adjustment for food intake (Model 2) and attenuated and not significant for WC after adjustment for carbohydrate and sugar intakes (Model 3).
Compared to non-drinkers, WC was 1.93 cm (95% CI: -3.55,-0.31) and 2.44 cm (95% CI: -4.07,-0.82) lower in heavy drinking women in Model 1 and Model 3, respectively. Differences in BMI were -0.83 kg/m2 (95% CI: -1.55,-0.11) and -1.10 kg/m2 (95% CI: -1.82,-0.37)in heavy drinking women, compared to non-drinkers, in Model 1 and Model 3, respectively (Table 3.4). In comparison to non-significant associations for binge drinkers in Model 1 and Model 2,
differences between binge drinkers and non-drinkers were strengthened and significant (β:-2.09 cm; 95% CI: -4.11,-0.07 and -1.18 kg/m2; 95% CI: -2.09,-0.27) for WC and BMI, respectively) after adjustment for non-alcoholic beverage energy (Model 3).
Discussion
20
important insight into why associations between alcoholic beverage consumption and obesity measures differ by drinking level and sex.
21
these findings by suggesting that differences in diet composition may be related to differential substitution of food in binge drinking men and non-alcoholic beverages in heavy drinking women.
Associations between excessive drinking and dietary intake, support the hypothesis that diet confounds associations between alcoholic beverage consumption and obesity measures. [93] Furthermore, differential confounding by dietary intake in men compared to women was
observed in this study. Positive associations between binge drinking and obesity measures in men were strengthened after adjustment for food intake and attenuated and no longer significant after adjustment for carbohydrate and sugar intakes. Negative associations between heavy drinking and obesity measures in women were strengthened after adjustment for carbohydrate and sugar intakes and not significant after adjustment for non-alcoholic beverage intake. Biological and observational research support contrasting associations observed by sex in the current study. [94, 95] There is a strong body of evidence indicating that ethanol metabolism, bioavailability and a dose response of alcohol’s effect on body processes differs between men and women, even after adjustment for body weight. Women have higher body fat composition and lower body water content than men of the same body weights which has been linked to differential sex-specific ethanol metabolism. [94, 95] Moreover, female sex has been associated with wine consumption; whereas beer consumption has been associated with male sex. [17] The ethanol by volume content of wine is higher than that of beer and high ethanol intakes could alter lipid metabolism leading to loss of adipose tissue and negative associations between drinking level and obesity measures observed among women. [9, 28]
22
women drinkers. These differences might contribute to contrasting relationships between alcoholic beverage consumption and obesity measures by sex. Concurrent with lower food intakes, excessive drinking men had higher total energy intakes as compared to their non-drinking counterparts which might equate to excess energy intake and ultimately weight gain. [31, 40, 91] On the other hand, heavy drinking appears to be associated with substitution of non-alcoholic beverages in women which might lead to negative energy balance and negative
differences in obesity measures as compared to non-drinkers. [22, 32, 40] However, the cross-sectional nature of this study precludes inferences of causation. Future research aimed at elucidating the effects of food, non-alcoholic beverage and carbohydrate and sugar intake, by sex, on associations between drinking level and obesity measures among excessive drinkers is warranted.
A strength of this study was the use of WC and BMI as obesity measures. The use of varying definitions of anthropometry across studies could be one reason for inconsistent findings regarding the relationship between alcoholic beverage consumption and obesity. Furthermore, the current study identified drinkers based on the use of the NHANES AUQ which captured drinking behaviors over the past 12 months. While misclassification of drinkers is still possible, the use of a long term questionnaire captures drinkers who might have been misclassified as non-drinkers with a shorter term assessment tool. The dietary intake data used in this study were obtained from 24-hour recalls which may be subject to systematic underreporting bias.[96] A strength of this study was the use of the revised Goldberg method to adjust for dietary
23
activity data is that such data may be subject to recall bias bias which may lead to
misclassification of dietary misreporters. A strength of this study was that the magnitude and direction of associations for excessive drinking men and heavy drinking women and diet and obesity outcomes were robust to a series of supplemental analyses (see Appendix 3.2-5). Additionally, the current study is nationally representative and multiple surveys were pooled to ensure adequate sample size to examine drinking subgroups by sex.
2
4
Table 3.1 Survey weighted distribution of covariatesby sex and daily drinking level, NHANES 2003-2012a
Men Women
Drinking Level Non-Drinker Moderate Heavy Binge Non-drinker Moderate Heavy Binge
N 817 2,627 1,345 1,229 1,767 1,826 1,744 548
% 11.4 ± 0.7 45.4 ± 1.1* 22.9 ± 0.9* 20.3 ± 0.9*
23.3 ± 1 33.6 ± 1* 33.2 ± 0.9* 9.8 ± 0.5*
Age group
20-39 years 37.2 ± 2.7 34.0 ± 1.7 48.1 ± 2.0 62.2 ± 2.3 31.6 ± 1.6 27.1 ± 1.5 49.6 ± 1.9 66.2 ± 2.8
40-59 years 35.4 ± 2.5 42.6 ± 1.5 39.0 ± 2.0 31.4 ± 1.9 36.6 ± 1.6 44.7 ± 1.6 38.8 ± 1.8 30.5 ± 2.7
60-79 years 27.4 ± 2.3 23.4 ± 1.4 12.9 ± 1.1 6.4 ± 1.1 31.8 ± 1.8 28.1 ± 1.4 11.6 ± 0.9 3.4 ± 0.7
p-value 0.0566 <0.0001 <0.0001 0.1198 <0.0001 <0.0001
Race/ethnicityc
NHW 65.7 ± 3.3 77.1 ± 1.7 71.4 ± 1.8 63.6 ± 3.0 59.5 ± 3.0 77.8 ± 1.6 74.8 ± 1.6 69.6 ± 3.2
NHB 14.6 ± 1.9 9.1 ± 0.9 10.4 ± 1.1 7.3 ± 1.0 16.6 ± 1.7 9.6 ± 0.9 10.3 ± 1.0 11.0 ± 1.8
Mex-Am 5.6 ± 0.9 4.9 ± 0.5 9.1 ± 1.1 18.1 ± 2.1 10.6 ± 1.4 4.5 ± 0.6 6.0 ± 0.7 10.9 ± 2.0
Other 14.1 ± 2.0 8.8 ± 1.0 9.1 ± 1.1 10.9 ± 1.4 13.2 ± 1.4 8.2 ± 0.9 8.8 ± 0.9 8.5 ± 1.3
p-value 0.0001 0.0013 <0.0001 0.0065 <0.0001 0.0019
Educationd
<HS 20.1 ± 2.0 9.9 ± 0.8 14.5 ± 1.4 23.7 ± 1.5 23.9 ± 1.6 8.9 ± 0.7 10.9 ± 1.0 19.3 ± 2.7
HS 30.4 ± 2.8 18.9 ± 1.4 22.2 ± 1.4 32.7 ± 2.3 29.3 ± 1.8 18.3 ± 1.4 21.2 ± 1.4 29.7 ± 3.2
>HS 49.5 ± 3.0 71.2 ± 1.6 63.3 ± 1.9 43.7 ± 2.5 46.7 ± 1.9 72.7 ± 1.7 68.0 ± 1.7 51.0 ± 3.9
p-value <0.0001 0.0003 0.1974 0.0012 <0.0001 0.3620
Household incomee
0-130% 21.0 ± 2.0 11.9 ± 0.9 17.7 ± 1.7 28.3 ± 1.8 30.5 ± 1.6 12.4 ± 1.0 17.0 ± 1.4 37.4 ± 3.4
131-299% 34.3 ± 2.3 21.4 ± 1.1 26.3 ± 1.8 30.2 ± 2.1 33.4 ± 1.7 25.1 ± 1.6 25.7 ± 1.5 26.7 ± 2.9
≥300% 44.7 ± 2.4 66.8 ± 1.6 56.0 ± 2.1 41.5 ± 2.5 36.2 ± 2.1 62.5 ± 1.7 57.3 ± 1.9 35.9 ± 3.2
p-value <0.0001 0.0035 0.0208 0.0226 <0.0001 0.0891
Marital Status
Never married 23.0 ± 2.3 16.2 ± 1.3 26.0 ± 2.1 31.2 ± 2.3 15.2 ± 1.6 12.2 ± 1.1 20.2 ± 1.7 31.8 ± 3.6
Formerly married 8.7 ± 1.3 9.8 ± 0.9 11.4 ± 1.2 14.8 ± 1.7 21.8 ± 1.4 19.5 ± 1.2 19.7 ± 1.3 16.0 ± 1.8
2
5
Men Women
Drinking Level Non-Drinker Moderate Heavy Binge Non-drinker Moderate Heavy Binge
p-value 0.0050 0.1532 < 0.0001 0.2364 0.0543 <0.0001
Smoking Status
Never Smoker 67.6 ± 2.2 54.9 ± 1.6 39.8 ± 2.3 35.6 ± 2.2 75.8 ± 1.9 64.1 ± 1.4 50.7 ± 1.9 37.6 ± 3.9
Former Smoker 19.6 ± 1.8 30.0 ± 1.4 26.6 ± 1.9 20.1 ± 1.7 11.1 ± 1.3 23.9 ± 1.4 22.8 ± 1.7 14.6 ± 2.1
Current Smoker 12.8 ± 1.4 15.1 ± 1 33.6 ± 2.1 44.4 ± 2.2 13.1 ± 1.3 12.0 ± 1.2 26.5 ± 1.5 47.8 ± 3.6
p-value <0.0001 <0.0001 <0.0001 0.0172 <0.0001 <0.0001
History of Chronic Diseasef
No 84.7 ± 1.8 84.8 ± 1 90.5 ± 1.2 95.4 ± 0.7 85.0 ± 1.3 87.5 ± 1 89.5 ± 1.1 89.7 ± 1.9
Yes 15.3 ± 1.8 15.2 ± 1 9.5 ± 1.2 4.6 ± 0.7 15.0 ± 1.3 12.5 ± 1 10.5 ± 1.1 10.3 ± 1.9
p-value 0.9749 0.0044 <0.0001 0.3812 0.0151 0.0619
Dietary Misreportingg
Accurate Reporter 66.5 ± 2.7 74.1 ± 1.3 70.1 ± 1.8 69.3 ± 2.0 65.4 ± 1.5 71.6 ± 1.5 70.6 ± 1.6 65 ± 3.2
Under Reporter 23.5 ± 2.0 16.4 ± 0.9 17.3 ± 1.5 14.9 ± 1.6 28.6 ± 1.5 19.5 ± 1.3 20.8 ± 1.5 23.7 ± 2.9
Over Reporter 10.1 ± 1.9 9.5 ± 0.9 12.6 ± 1.2 15.8 ± 1.6 6.0 ± 0.8 8.9 ± 0.9 8.5 ± 0.9 11.2 ± 1.8
p-value 0.0171 0.0712 0.0060 0.0145 0.0002 0.0262
PALh
Low 71.9 ± 2.4 63.7 ± 1.6 70.3 ± 1.8 71.3 ± 1.8 80.5 ± 1.4 70.3 ± 1.8 70.3 ± 2.1 70.0 ± 3.2
Moderate 17.7 ± 2.0 18.6 ± 1.1 15.4 ± 1.4 12.5 ± 1.6 14.1 ± 1.3 20.5 ± 1.8 18.6 ± 1.3 18.3 ± 2.5
High 10.4 ± 1.5 17.7 ± 1.5 14.2 ± 1.6 16.2 ± 1.6 5.4 ± 0.8 9.2 ± 1 11.1 ± 1.4 11.7 ± 2
p-value 0.0012 0.1615 0.0160 0.0505 <0.0001 0.0005
Sedentary Time (h/d)
Mean ± SE 4.0 ± 0.1 3.9 ± 0 3.8 ± 0.1 4.0 ± 0.1 3.8 ± 0.1 3.8 ± 0.1 3.9 ± 0 3.9 ± 0.1
a Data for United States (US) men (n=6,018) and women (n=5,885) 20 – 79 years of age. Values are % ± SE unless mean specified. All values take into account
survey design and sample weights. National Health and Nutrition Examination Survey (NHANES);
b P-values for chi2 tests of survey weighted unadjusted percentage distributions of categorical covariates in drinkers compared to the percentage distribution of
2
6
c Non-Hispanic White (NHW); Non-Hispanic Black (NHB); Mexican American (Mex-Am)
d Graduated from high school (HS) or obtained general equivalency diploma (GED)
e Household income expressed as percentage of the Federal Poverty Level (FPL)
f Self-reported history of cardiovascular disease, stroke or cancer
g Implausible energy intakes were identified using the revised Goldberg method
h Physical Activity Level (PAL)
2
7
Table 3.2 Associations between daily drinking level, diet and obesity measures, NHANES 2003-2012a,b
Drinking Level
Men Women
Drinking Level Non-drinker Moderate Heavy Binge Non-drinker Moderate Heavy Binge
Diet Outcomes
Total Energy (kcal/d) 2365 ± 40 2506 ± 23* 2620 ± 33* 2797 ± 46* 1718 ± 21 1811 ± 19* 1881 ± 22* 1960 ± 44*
Non-alcoholic Energy
(kcal/d)c 2365 ± 40 2403 ± 21 2406 ± 31 2486 ± 37 1718 ± 21 1770 ± 19 1792 ± 21* 1801 ± 43
Food Energy (kcal/d)c
1990 ± 36 2068 ± 20 2027 ± 27 2057 ± 31 1441 ± 20 1528 ± 19* 1539 ± 19* 1478 ± 35
Non-alcoholic Beverage
Energy (kcal/d)c 375 ± 11 335 ± 7* 378 ± 10 429 ± 14* 278 ± 8 242 ± 9* 253 ± 6* 323 ± 14*
% Fat Contributionc
33.4 ± 0.4 34.1 ± 0.2 33.2 ± 0.3 32.1 ± 0.3* 33.2 ± 0.3 33.9 ± 0.2 33.9 ± 0.2 32.5 ± 0.5
% Protein Contributionc
15.6 ± 0.2 16.1 ± 0.1* 15.6 ± 0.1 15.5 ± 0.1 15.5 ± 0.2 15.7 ± 0.1 15.5 ± 0.1 14.7 ± 0.3*
% Carbohydrate
Contributionc,d 28.9 ± 0.4 26.4 ± 0.2* 24.6 ± 0.2* 23.4 ± 0.3* 28.2 ± 0.3 27.0 ± 0.2* 26.2 ± 0.2* 24.2 ± 0.4*
% Sugar Contributionc
23.5 ± 0.4 20.7 ± 0.2* 19.6 ± 0.3* 20.0 ± 0.4* 24.8 ± 0.3 23.0 ± 0.3* 21.2 ± 0.3* 22.1 ± 0.6* Obesity Measures
Abdominal Obesity (%)
No 53.2 ± 2.9 58.7 ± 1.6 60.8 ± 2.1 61.7 ± 2.2 30.6 ± 1.6 42.8 ± 2 47.1 ± 1.9 48.7 ± 3.7
Yes 46.8 ± 2.9 41.3 ± 1.6 39.2 ± 2.1 38.3 ± 2.2 69.4 ± 1.6 57.2 ± 2 52.9 ± 1.9 51.3 ± 3.7
p-value 0.0789 0.0296 0.0231 0.0167 <0.0001 <0.0001
Waist Circumference (cm)
Mean ± SE 101.4 ± 0.9 100.3 ± 0.4 98.9 ± 0.6 100.3 ± 0.8 96.9 ± 0.6 92.9 ± 0.7* 91.5 ± 0.6* 92.3 ± 0.9*
Weight Status (%)
BMI <= 24.99 29.7 ± 2.5 29.2 ± 1.4 29.2 ± 1.8 28.7 ± 1.8 29.9 ± 1.7 41.6 ± 1.9* 46.4 ± 1.8* 45.4 ± 3.9*
BMI 25.0 - 29.99 34.0 ± 2.5 41.4 ± 1.4 40.3 ± 1.8 36.8 ± 2.1 30.3 ± 1.6 29.2 ± 1.5 25.4 ± 1.7 24.5 ± 3.1
BMI >=30 36.4 ± 2.6 29.4 ± 1.5 30.5 ± 1.9 34.6 ± 2.1 39.8 ± 1.5 29.2 ± 1.5* 28.1 ± 1.7* 30.0 ± 2.4*
p-value 0.0221 0.0824 0.7120 0.0260 <0.0001 0.0002
BMI (kg/m2)
2
8
a Data for United States (US) men (n=6,018) and women (n=5,885) 20 – 79 years of age. Values are % ± SE unless mean ± SE
specified. All values take into account survey design and sample weights. National Health and Nutrition Examination Survey (NHANES)
b P-values for chi2 tests of survey weighted unadjusted percentage distributions of categorical variables in drinkers compared to the
percentage distribution of covariates in each drinking category. For continuous covariates and one-way tabulations, paired t-tests were used to compare means of non-drinkers to moderate, heavy or binge drinkers. Differences were considered statistically significant at P<0.05, after Bonferroni correction for multiple comparisons as indicated in boldface.
c Excludes energy from alcoholic beverages
d Excludes energy from sugar
2
9
Table 3.3 Differences in energy intake (kcal/d) and macronutrient contributions (%) between drinkers and non-drinkers, NHANES 2003-2012a
Men Women
β 95% CI β 95% CI
A
Total Energy (kcal/d)
Non-Drinker Ref (0,0) Ref (0,0)
Moderate Drinker 51 (-16,118) -22 (-58,15)
Heavy Drinker 100 (28,172) 22 (-21,66)
Binge Drinker 192 (115,268) 77 (3,150)
B
Non-alcoholic Energy (kcal/d)b
Non-Drinker Ref (0,0) Ref (0,0)
Moderate Drinker -34 (-102,34) -48 (-86,-9)
Heavy Drinker -92 (-163,-21) -54 (-100,-9)
Binge Drinker -100 (-180,-20) -74 (-153,6)
C
Food Energy (kcal/d)b
Non-Drinker Ref (0,0) Ref (0,0)
Moderate Drinker -1 (-62,60) -16 (-54,21)
Heavy Drinker -60 (-124,5) 1 (-45,48)
Binge Drinker -72 (-142,-1) -47 (-113,20)
D
Non-alcoholic Beverage Energy (kcal/d)b
Non-Drinker Ref (0,0) Ref (0,0)
Moderate Drinker -33 (-60,-7) -31 (-52,-11)
Heavy Drinker -32 (-62,-3) -56 (-74,-38)
Binge Drinker -29 (-64,7) -27 (-62,9)
E
% Fat Contributionb Ref (0,0) Ref (0,0)
3
0
Men Women
Moderate Drinker -0.28 (-1.25,0.70) 0.34 (-0.32,1.00)
Heavy Drinker -0.95 (-1.91,0.02) -0.78 (-1.90,0.33)
Binge Drinker F
% Protein Contributionb Ref (0,0) Ref (0,0)
Non-Drinker 0.56 (0.16,0.96) 0.30 (-0.08,0.68)
Moderate Drinker 0.22 (-0.20,0.64) 0.30 (-0.08,0.68)
Heavy Drinker 0.26 (-0.10,0.62) -0.17 (-0.75,0.42)
Binge Drinker G
% Carbohydrate Contributionb,c Ref (0,0) Ref (0,0)
Non-Drinker -2.29 (-3.13,-1.45) -0.74 (-1.43,-0.06)
Moderate Drinker -3.85 (-4.81,-2.89) -1.28 (-1.99,-0.57)
Heavy Drinker -5.36 (-6.31,-4.40) -3.02 (-3.93,-2.12)
Binge Drinker H
% Sugar Contributionb Ref (0,0) Ref (0,0)
Non-Drinker -2.32 (-3.28,-1.35) -1.27 (-2.14,-0.40)
Moderate Drinker -4.05 (-5.03,-3.07) -3.75 (-4.57,-2.93)
Heavy Drinker -4.33 (-5.39,-3.27) -3.82 (-5.39,-2.25)
a Data for United States (US) men (n=6,018) and women (n=5,885) 20 – 79 years of age. Estimates obtained from a series of
sex-specific multivariable linear regression models which take into account survey design and sample weights. National Health and Nutrition Examination Survey (NHANES); All models adjusted for age, race/ethnicity, education, physical activity level, survey year, chronic disease status, day of recall 1, day of recall 2, dietary misreporting and smoking. Continuous dietary outcomes vary for each regression model as follows: A: total energy; B: non-alcoholic energy (food plus non-alcoholic beverage energy); C: energy from food; D: energy from non-alcoholic beverages; E: percentage contribution from fat to non-alcoholic energy; F: percentage contribution from protein non-alcoholic energy; G: percentage contribution from carbohydrates to non-alcoholic energy; H: percentage
contribution from sugar to non-alcoholic energy. Estimates are the difference in kilocalories per capita per day (kcal/d) or percentage contribution compared to non-drinkers (%).
b Excludes energy from alcoholic beverages
3
1
Table 3.4 Differences in WC (cm) and BMI (kg/m2) of drinkers compared to non-drinkers, NHANES 2003-2012a
Men
Model 1b Model 2c Model 3d
A
WC (cm) β 95% CI β 95% CI β 95% CI
Non-Drinker Ref Ref Ref
Moderate Drinker -0.71 (-2.34,0.92) -0.68 (-2.25,0.89) -1.20 (-2.79,0.40)
Heavy Drinker -0.10 (-1.91,1.70) 0.29 (-1.52,2.10) -0.94 (-2.73,0.85)
Binge Drinker 3.21 (1.02,5.40) 3.63 (1.45,5.82) 2.11 (-0.04,4.26)
B Model 4b Model 5c Model 6d
BMI (kg/m2)
Non-Drinker Ref Ref Ref
Moderate Drinker -0.33 (-0.96,0.30) -0.32 (-0.94,0.31) -0.5 (-1.11,0.12)
Heavy Drinker 0.07 (-0.68,0.81) 0.21 (-0.54,0.95) -0.23 (-0.97,0.51)
Binge Drinker 1.32 (0.43,2.21) 1.47 (0.57,2.37) 0.93 (0.05,1.81)
Women
Model 7b Model 8e Model 9d
A
WC (cm) β 95% CI β 95% CI β 95% CI
Non-Drinker Ref Ref Ref
Moderate Drinker -1.59 (-3.15,-0.03) -1.43 (-2.98,0.12) -1.79 (-3.34,-0.24)
Heavy Drinker -1.93 (-3.55,-0.31) -1.58 (-3.19,0.03) -2.44 (-4.07,-0.82)
Binge Drinker -1.32 (-3.26,0.62) -1.11 (-3.03,0.80) -2.09 (-4.11,-0.07)
B
BMI (kg/m2) Model 10b
Model 11e Model 12d
Non-Drinker Ref Ref Ref
Moderate Drinker -0.54 (-1.24,0.15) -0.49 (-1.18,0.20) -0.64 (-1.33,0.04)
Heavy Drinker -0.83 (-1.55,-0.11) -0.70 (-1.42,0.02) -1.10 (-1.82,-0.37)
Binge Drinker -0.79 (-1.67,0.10) -0.71 (-1.60,0.17) -1.18 (-2.09,-0.27)
a Data for United States (US) men (n=6,018) 20 – 79 years of age. β co-efficients obtained from multivariable linear regression models
3
2
Continuous anthropometric outcomes vary for each regression model as follows: A: Waist Circumference (WC); B: Body Mass Index
(kg/m2). All estimates are the difference in cm2 or kg/m2 for WC and BMI, respectively, as compared to non-drinkers.
b adjusted for age, race/ethnicity, education, marital status, physical activity level, dietary misreporting, survey year, day of recall 1,
day of recall 2, daily sedentary time, smoking status, FPL%
c adjusted for covariates plus food intake (continuous)
d adjusted for covariates plus percentage contribution of carbohydrates to total energy intake (continuous) and percentage contribution
of sugar to total energy intake (continuous)
33
CHAPTER 4. ASSOCIATIONS OF 5-YEAR CHANGES IN ALCOHOLIC BEVERAGE INTAKE WITH 5-YEAR CHANGES IN WAIST CIRCUMFERENCE AND BMI IN THE
CORONARY ARTERY RISK DEVELOPMENT IN YOUNG ADULTS (CARDIA) STUDY
Overview
Contradictory associations of alcohol intake with Waist Circumference (WC) and Body Mass Index (BMI) are likely due to residual confounding, selection bias and variation in associations by drinking level and alcoholic beverage type. This study aimed to shed light on inconsistent findings by examining 5-yr changes in alcohol intake in relation to 5-yr WC and BMI change. This prospective study included 4,146 participants (1,894 men and 2,252 women) enrolled in the Coronary Artery Risk Development in Young Adults (CARDIA) study at baseline (1985-1986) and followed over 25 years (2010-2011). Longitudinal random effects linear
regression models were used to test whether changes in alcohol intake (versus stable non-drinking) over a 5-yr period were associated with 5-yr WC and BMI change. Associations with changes in drinking level and changes by beverage type were also examined. In men, a 5-yr decrease in total alcohol intake, particularly stopping excessive drinking (β:0.78 cm; (95% CI: -1.53, -0.03 cm) was associated with lower 5-yr WC gains (β:-0.70 cm (95% CI: -1.19, -0.22 cm) compared to stable non-drinking. In women, compared to stable non-drinkers, increasing wine (β:0.57 cm; 95% CI: 1.06, 0.09 cm) and decreasing liquor/mixed drink (β:0.87 cm; 95% CI: -1.43, -0.31 cm) intake was associated with lower 5-yr WC gains. In women, contrasting
34
Introduction
An increasing trend in energy consumed from alcoholic beverages coupled with secular increases in waist circumference (WC) and body mass index (BMI) have been reported in the US over the past two decades. [5-7] Yet, positive, null and negative associations of alcohol intake with WC, BMI, and changes in WC and BMI have been reported. Residual confounding, selection bias and variation in associations by drinking level and alcoholic beverage type have been cited as potential contributors to contradictory findings. [8, 41, 97]
Residual confounding by unmeasured characteristics that differ within and across drinking categories may underlie inconsistent findings. [8, 98, 99] Non-drinkers have been reported to engage in less physical activity, consume more calories and belong to lower socio-economic subgroups as compared to drinkers [100] Further, in the US wine drinking has been associated with higher educational attainment and higher intakes of food and beverage groups supported by the Dietary guidelines for Americans [101]. Beer and liquor intake has been associated with foods and nutrients that should be consumed in moderation (i.e. fat, sugar, sodium) and excessive drinking. [7, 66-69, 101, 102] Thus, dietary intake and physical activity may be key omitted confounders in epidemiologic studies of alcohol and obesity outcomes. [8, 45] People may self-select into alcohol consumption behavior patterns based on
socio-demographic characteristics and inherent individual traits. [103, 104] If unaccounted for, residual confounding and self-selection may bias associations of alcohol intake with WC and BMI and contribute to inconsistencies in the alcohol and obesity literature. [98, 105]
35
add to the mixed literature. Positive and null associations of excessive drinking and BMI gains have been reported. [8, 25, 26] There is evidence that stopping heavy drinking or maintaining stable light or moderate drinking may underlie positive and negative associations of within-person changes in total alcohol intake with WC and BMI change in men and women,
respectively. [20, 55] With regard to alcoholic beverage type, the non-alcohol components (i.e., polyphenols) of beer and wine have been inversely associated with weight and BMI. [3] Yet, positive and negative associations of beer intake and changes in beer intake with weight and BMI gains have been found. [45, 63] While wine intake has been negatively associated with weight gain, positive associations with liquor consumption have been reported for both sexes. [9, 58] However, results are limited and inconclusive regarding associations of within-person changes in alcohol consumption levels and alcoholic beverages by type (i.e. decreasing beer or wine intake) and changes in WC and BMI. [8-10, 44, 45, 51-58]. Furthermore, we could find no study that examined within-person changes in drinking level in relation to changes in WC in men and women.[8]
36
increases in liquor/mixed drinks positively associated with 5-yr WC and BMI change.
Methods
The CARDIA study is an ongoing, prospective study of the determinants and evolution of cardiometabolic risk starting in young adulthood. A total of 5,115 young adults aged 18-30 years were enrolled at baseline in 1985–1986 with balance according to race (African American and white), sex, education (≤high school and >high school), and age (18-24 and 25-30 years) from the population in each of four metropolitan areas: Birmingham, AL; Chicago, IL; Minneapolis, MN; and Oakland, CA. Follow-up examinations occurred in 1987-1988 (Exam Year 2), 1990-1991 (Exam Year 5), 1992-1993 (Exam Year 7), 1995-1996 (Exam Year 10), 2000-2001 (Exam Year 15), and 2005-2006 (Exam Year 20) and 2010-2011 (Exam Year 25); retention at each exam year was 91% 90%, 86%, 81%, 79%, 74%, 72% and 72%, respectively. The CARDIA study methods are described in detail elsewhere. [106, 107] Each study participant provided written informed consent, and data were collected under protocols approved by the Institutional Review Boards at each study center and at the University of North Carolina at Chapel Hill.
This study included six CARDIA exams (1985–1986, 1990-1991, 1995-1996, 2000-2001, 2005-2006, 2010-2011). All adults with socio-demographic data at baseline were considered eligible participants excluding one participant who withdrew from the study (N=5,114). As has been done in previous studies, to minimize bias resulting from illness that may affect body weight, we excluded participants with hypertension (≥6.5% or taking
37
every exam were excluded from the analytic sample (N=61). For individuals included in the analytic sample, observations were excluded at given exam years if participants were pregnant or breastfeeding (obs=278) or had implausible energy intakes (<600 kcal/d or >6000/d kcal for women and <800 kcal/d or >8000 kcal/d for men) (n= 322) at an exam or if they were missing exposure (obs=1,311 alcohol intake), outcome (obs = 32 WC, 130 BMI), or covariate data at a given exam year (obs=1 education, 4 marital status, 80 smoking, 47 physical activity, 1,130 dietary intake). We excluded observations at exams where participants were missing data on disease diagnosis (=90) and censored participants with diabetes, hypertension or self-reported cancer during follow-up at the year in which the disease was reported (obs =3,230). Our final analytic sample consisted of 4,257 participants (men and women) n=4,146 at year 0; 3,471 at year 5; 2,461 at year 10; 2,028 at year 15; 1,628 at year 20 and 1,311 at year 25 for a total 15,045 person observations.
Excluded participants (N=857) were more likely to be black, obese and belong to the lowest education subgroup at year 0 as compared to those included (Table 4.1).
CARDIA assessed alcoholic beverage consumption at each examination using an Alcohol Use Questionnaire (AUQ) that queried participants regarding annual, monthly, weekly and daily alcoholic beverage intake. Alcoholic beverage consumption was defined based on the following questions: “Did you drink any alcoholic beverages in the past year?”; “How many drinks of wine (5 oz glass) do you usually have per week?”; “How many drinks of beer (12 oz glass) do you usually have per week?”; “How many drinks per week do you usually have of hard liquor (1 1/2 oz)?”
38
categories using alcoholic beverage intake at exam year 0. Category definitions were based on the National Institute on Alcohol Abuse and Alcoholism (NIAAA) guidance on drinking levels. [54, 61, 109-111] Based on the sum of the usual intake of beer, wine, and liquor/mixed drinks per week (drinks/wk) as reported on the AUQ at exam year 0, men were classified as “non-drinker”, “light drinker” (<7 drinks/wk), “moderate drinker” (7 to 14 drinks/wk), or “excessive drinker” (>14 drinks/wk), and women were classified as “non-drinker”, “light drinker” (<4 drinks/wk), “moderate drinker” (4 to 7 drinks/wk), or “excessive drinker (> 7 drinks/wk). [109, 110]
Changes in total alcohol intake
Alcoholic beverage intake data were collected at all examinations. To capture 5-yr changes in alcohol intake we chose to use alcohol intake data from the six examinations
administered with 5-yr time intervals from one exam to the next (i.e. exam years 0, 5, 10, 15, 20 and 25). Participants were categorized by the 5-yr change in total drinks/wk from one exam year to the next as follows: “Stable non-drinking” (0 drinks/wk at previous and current exam), “Start drinking” (change from 0 drinks/wk at previous exam to > 0 drinks/wk at current exam), “Increase drinking” (drinks/wk at previous exam < drinks/wk at current exam ), “Stable
drinking” (drinks/wk > 0 and drinks/wk at previous exam equal to drinks/wk at current exam), “Stop drinking” (change from >0 drinks/wk at previous exam to 0 drinks/wk at current exam ), “Decrease drinking” (drinks/wk at previous exam > drinks/wk at current exam).
Changes in drinking level
39
exam), “Start light/moderate drinking” (non-drinker at previous exam and light or moderate drinker at current exam), “Start excessive drinking” (non-, light or moderate drinker at previous exam and excessive drinker at the current exam), “Stable light/moderate drinking (light or moderate drinker at previous exam and light or moderate drinker at current exam), “Stable excessive drinking (excessive drinker at previous exam and excessive drinker at current exam), “Stop light/moderate drinking” (light or moderate drinker at previous exam and non-drinker at current exam), “Stop excessive drinking” (excessive drinker at previous exam and non-, light or moderate drinker at the current exam).
Changes in alcoholic beverage type
To examine associations between 5-yr changes in beer, wine and liquor/mixed drink intake with changes in WC and BMI over the same period, participants were categorized according to weekly consumption of each beverage type as follows: “Stable non-drinking” (0 drinks/wk at previous and current exam), “Increase” (beer, wine or liquor/mixed drinks/wk at previous exam < beer, wine or liquor/mixed drinks/wk at current exam), “Stable” (no change in beer, wine or liquor/mixed drinks/wk from previous to current exam), “Decrease” (beer, wine or liquor/mixed drinks/wk at previous exam > beer, wine or liquor/mixed drinks/wk at current exam).
Anthropometrics
At each exam, height, weight, and WC were measured in replicate in light clothing without shoes according to standardized protocol. [106, 112] Height was measured to the nearest 0.2 cm via portable Seca stadiometer, and weight was measured to the nearest 0.1 kg via