AN EVALUATION OF THE EFFECTIVENESS
OF IGNITION INTERLOCK IN CALIFORNIA
TECHNICAL REPORT
September 2005
Authors: David J. DeYoung, Helen N. Tashima, and Scott V. Masten
Research and Development Branch
© California Department of Motor Vehicles, 2005 Licensing Operations Division
2. REPORT DATE
4. TITLE AND SUBTITLE 5. FUNDING NUMBERS
6. AUTHOR(S)
7. PERFORMING ORGANIZATION NAME(S) AND ADDRESS(ES) 8. PERFORMING ORGANIZATION REPORT NUMBER
11. SUPPLEMENTARY NOTES
9. SPONSORING/MONITORING AGENCY NAME(S) AND ADDRESS(ES)
13. ABSTRACT (Maximum 200 words)
19. SECURITY CLASSIFICATION OF ABSTRACT 20. LIMITATION OF ABSTRACT 15. NUMBER OF PAGES 16. PRICE CODE 14. SUBJECT TERMS
1. AGENCY USE ONLY (Leave blank) 3. REPORT TYPE AND DATES COVERED
10. SPONSORING/MONITORING AGENCY REPORT NUMBER
12a. DISTRIBUTION/AVAILABILITY STATEMENT 12b. DISTRIBUTION CODE
18. SECURITY CLASSIFICATION OF THIS PAGE
17. SECURITY CLASSIFICATION OF REPORT
maintaining the data needed, and completing and reviewing the collection of information. Send comments regarding this burden estimate or any other aspect of this collection of information, including suggestions for reducing this burden, to Washington Headquarters Services, Directorate for Information Operations and Reports, 1215 Jefferson Davis Highway, Suite 1204, Arlington, VA 22202-4302, and to the Office of Management and Budget, Paperwork Reduction Project (0704-0188), Washington, DC 20503.
An Evaluation of the Effectiveness of Ignition Interlock in California: Technical Report
David J. DeYoung, Helen N. Tashima, and Scott V. Masten
California Department of Motor Vehicles Research and Development Section P.O. Box 932382
Sacramento, CA 94232-3820
CAL-DMV-RSS-05-217
ignition interlock, suspended drivers, drunk drivers, drunk driving countermeasures, outcome evaluation
100 September 2005
Office of Traffic Safety
7000 Franklin Bloulevard, Suite 400
Sacramento, CA 94223-1899 AL0357
This study is one of two studies of ignition interlock in California mandated by the California Legislature (AB 762). The first study, published in 2002, was a process evaluation that examined the degree to which ignition interlock has been implemented in California. This current study is an outcome evaluation that examines the effectiveness of ignition interlock in reducing alcohol-related crashes and convictions, and crashes overall (alcohol and non-alcohol). The results of the study show that interlock works for some offenders in some contexts, but not for all offenders in all situations. More specifically, ignition interlock devices work best when they are installed, although there is also some evidence that judicial orders to install an interlock are effective for repeat DUI offenders, even when not all offenders comply and install a device. California’s administrative program, where repeat DUI offenders install an interlock device in order to obtain restricted driving privileges, is also associated with reductions in subsequent DUI incidents. One group for whom ignition interlock orders do not appear effective is first DUI offenders with high blood alcohol levels.
PREFACE
This report is the second of a two-study evaluation of ignition interlock in California that was mandated by the California Legislature (AB 762 -Torlakson), and funded in part by the California Office of Traffic Safety. The report was prepared by the Research and Development Branch of the California Department of Motor Vehicles under the administrative direction of Clifford J. Helander, Chief. The opinions, findings and conclusions expressed in the report are those of the authors and not necessarily those of the State of California.
ACKNOWLEDGMENTS
The authors would like to acknowledge with appreciation the many individuals who contributed to this study. Clifford J. Helander, Chief of the Research and Development Branch, provided general direction, and Debbie McKenzie, Associate Governmental Program Analyst, prepared the graphs and organized the final report. Mike Gebers, Research Program Specialist II, provided input on statistical and programming issues, and Eric Chapman, Research Program Specialist I, assisted with training student assistants in data collection and input procedures. Several student assistants provided valuable assistance in collecting and inputting data, especially Rosa Serrato, Kristen Mantzey and Michael Lopez. Jim Meyer modified a SAS software program that matched control to treatment cases.
There were also many individuals at courts throughout the state that assisted in collecting data from court records. The authors are especially grateful to: Jill Ramirez, Solano County Superior Court; Steven Fernandez, Stuart Marsh, and Cherie Garasolo, Orange County Superior Court; Tricia McCoy and Terry McNally, Kern County Superior Court; Kathy Bailey and Donna Kunz, San Diego County Superior Court; Margaret Corioso, Monterey County Superior Court; Roberta Stibbard and Terri Cain, Santa Clara County Superior Court; John Zeis, Shasta County Superior Court; and Greg Blair and Janice Teramura, Los Angeles County Superior Court.
Finally, the data for the sample of drivers who installed ignition interlock devices on their vehicles were provided by interlock providers Chick Richardson, David Nico, Joe Sheram, Karen Early and Sam Satya.
TABLE OF CONTENTS PAGE PREFACE... i ACKNOWLEDGMENTS... i INTRODUCTION ... 1 Background ... 1
IID Programs & Evaluations... 2
Ignition Interlock in California ... 4
METHODS... 6
Selection of Subjects... 6
Research Design... 10
Analysis ... 13
RESULTS... 14
Study 1: DWS-DUI Offenders with an IID Order or Restriction ... 14
Study 2: DWS-DUI Offenders with an IID Order ... 21
Study 3: DWS-DUI & DUI Offenders Installing an IID ... 28
Study 4: DUI First Offenders with an IID Order or Restriction... 39
Study 5: DUI Second Offenders with an IID Order or Restriction ... 46
Study 6: Second DUI Offenders Installing an IID with Restricted Licenses ... 52
CONCLUSION AND RECOMMENDATIONS ... 60
Conclusions ... 61 Recommendations ... 62 REFERENCES... 65 APPENDIX ... 66 LIST OF TABLES NUMBER 1 Mean Propensity Scores, Days in Study and Sample Sizes for Study Groups ... 12
2 Cox Regression Model, Study 1, Days to First Subsequent DUI Conviction ... 16
3 Cox Regression Model, Study 1, Days to First Subsequent DUI Incident... 18
4 Cox Regression Model, Study 1, Days to First Subsequent Crash ... 20
5 Cox Regression Model, Study 2, Days to First Subsequent DUI Conviction ... 22
6 Cox Regression Model, Study 2, Days to First Subsequent DUI Incident... 24
7 Cox Regression Model, Study 2, Days to First Subsequent Crash ... 27
8 Cox Regression Model, Study 3, Days to First Subsequent DUI Conviction ... 30
9 Cox Regression Model, Study 3, Subsequent DUI: IID Effects on Offender Type... 31
TABLE OF CONTENTS (Continued) LIST OF TABLES (Continued)
NUMBER PAGE
10 Cox Regression Model, Study 3, Days to First Subsequent DUI
Incident... 33 11 Cox Regression Model, Study 3, Subsequent DUI Incident: IID
Effects on Offender Type ... 35 12 Cox Regression Model, Study 3, Days to First Subsequent Crash ... 37 13 Cox Regression Model, Study 3, Subsequent Crashes: IID Effects
on Offender Type ... 38 14 Cox Regression Model, Study 4, Days to First Subsequent DUI
Conviction ... 40 15 Cox Regression Model, Study 4, Days to First Subsequent DUI
Incident... 42 16 Cox Regression Model, Study 4, Days to First Subsequent Crash ... 45 17 Cox Regression Model, Study 5, Days to First Subsequent DUI
Conviction ... 47 18 Cox Regression Model, Study 5, Days to First Subsequent DUI
Incident... 49 19 Cox Regression Model, Study 5, Days to First Subsequent Crash ... 51 20 Cox Regression Model, Study 6, Days to First Subsequent DUI
Conviction ... 54 21 Cox Regression Model, Study 6, Days to First Subsequent DUI
Incident... 56 22 Cox Regression Model, Study 6, Days to First Subsequent Crash ... 58
LIST OF FIGURES
NUMBER PAGE
1 Final survival model: Number of days to first subsequent DUI
conviction for DWS-DUI offenders receiving an IID order/restriction
versus DWS-DUI offenders not receiving an IID order/restriction ... 16 2 Final survival model: Number of days to first subsequent DUI
incident for DWS-DUI offenders receiving an IID order/restriction
versus DWS-DUI offenders not receiving an IID order/restriction ... 18 3 Final survival model: Number of days to first subsequent crash
for DWS-DUI offenders receiving an IID order/restriction versus
DWS-DUI offenders not receiving an IID order/restriction... 20 4 Final survival model: Number of days to first subsequent DUI
conviction for DWS-DUI offenders receiving an IID order
versus DWS-DUI offenders not receiving an IID order ... 23 5 Final survival model: Number of days to first subsequent DUI
incident for DWS-DUI offenders receiving an IID order versus
TABLE OF CONTENTS (Continued) LIST OF FIGURES (Continued)
NUMBER PAGE
6 Final survival model: Number of days to first subsequent crash for DWS-DUI offenders receiving an IID order versus DWS-DUI
offenders not receiving an IID order... 28 7 Final survival model: Number of days to first subsequent DUI
conviction for drivers installing an IID versus drivers not installing
an IID ... 30 8 Final survival model: Number of days to first subsequent DUI
incident for drivers installing an IID versus drivers not installing
an IID ... 34 9 Final survival model: Number of days to first subsequent crash
for drivers installing an IID versus drivers not installing an IID ... 37 10 Final survival model: Number of days to first subsequent DUI
conviction for first DUI offenders receiving a court IID order/restriction versus first DUI offenders not receiving an IID order/restriction... 41 11 Final survival model: Number of days to first subsequent DUI
incident for first DUI offenders receiving a court IID order/restriction
versus first DUI offenders not receiving an IID order/restriction... 43 12 Final survival model: Number of days to first subsequent
crash for first DUI offenders receiving a court IID order/restriction
versus first DUI offenders not receiving an IID order/restriction... 45 13 Final survival model: Number of days to first subsequent
DUI conviction for second DUI offenders receiving a court IID order/restriction versus second DUI offenders not receiving an
IID order/restriction ... 48 14 Final survival model: Number of days to first subsequent DUI
incident for second DUI offenders receiving a court IID order/restriction versus second DUI offenders not receiving an IID order/restriction... 50 15 Final survival model: Number of days to first subsequent
crash for second DUI offenders receiving a court IID order/restriction
versus second DUI offenders not receiving an IID order/restriction... 52 16 Final survival model: Number of days to first subsequent
DUI conviction for second DUI offenders installing an IID with restriction versus second DUI offenders not installing an
IID with license suspension ... 55 17 Final survival model: Number of days to first subsequent DUI
incident for second DUI offenders installing an IID with
license restriction versus second DUI offenders not installing an
IID with license suspension ... 57 18 Final survival model: Number of days to first subsequent
crash for second DUI offenders installing an IID with license restriction versus second DUI offenders not installing an IID
INTRODUCTION Background
The mixture of alcohol and driving presents a major public health problem in the United States. The National Highway Traffic Safety Administration (NHTSA) reports that in 2002, 17,419 people died in alcohol-involved crashes in the United States, and that alcohol was involved in 41% of all traffic fatalities (National Highway Traffic Safety Administration, 2002). The National Safety Council states that 3 of every 10 Americans will be involved in an alcohol-involved collision in their lifetimes, and estimates that such crashes cost the United States $29.1 billion in 2000 (National Safety Council, 2001). The magnitude of the drinking and driving problem in California is revealed in crash data reported by the California Highway Patrol (CHP), which show that 1,308 people died and 31,806 were injured in alcohol-involved crashes in California in 2001 (California Highway Patrol, 2001).
There is a long history of efforts to control drinking and driving in North America and Europe. For several decades, the courts and motor vehicle departments have prescribed fines, jail terms and driver license suspension/revocation (S/R) in an effort to better control the risk posed by drinking drivers. These traditional penalties are meant to incapacitate the drinking driver, so that for at least some period of time they cannot reoffend, and also to deter them from reoffending in the future. Somewhat more recently, efforts have also been directed toward rehabilitating drinking drivers, by requiring them to participate in alcohol education and treatment programs, such as the drinking driver treatment programs that DUI offenders in California are required to attend.
These traditional countermeasures have had some success in reducing alcohol-involved crashes, especially during the early 1980s through the mid-1990s, when increasing attention was focused on drunk driving through the formation of grass roots organizations such as MADD, and significant new anti-DUI legislation was enacted. From 1982 until 1997, alcohol-involved fatalities declined 33% in the United States (Subramanian, 2003). However, the proportion of fatalities in alcohol-involved crashes reached a nadir in 1997, and increased slightly in 2000 and 2001.
This leveling off and then slight increase in alcohol-involved crashes during the past several years has policy makers and traffic safety professionals concerned, and searching for new countermeasures to better control drinking drivers. One new class of countermeasures targets offenders’ vehicles, rather than the offenders themselves. One advantage of such vehicle-based countermeasures is that they do not rely upon rehabilitating the drinking driver, but instead focus upon removing the drivers access to their vehicle, either completely, through vehicle impoundment/immobilization/ forfeiture, or after drinking, through the installation of ignition interlock devices (IIDs). IIDs are devices that consist of an alcohol breath testing unit that is linked to the ignition switch of a motor vehicle. The vehicle cannot be started until the driver
provides a breath sample, and if the sample contains more than a predetermined amount of alcohol, the device locks the vehicle’s ignition, thereby preventing the person from driving.
Although IIDs have yet to be used widely, the devices are not new, having been the focus of research and development since the 1960s (National Highway Traffic Safety Administration, 1990). The early devices proved easy to circumvent, and so did not gain wide acceptance, but as development has continued, IIDs have become increasingly sophisticated, and more difficult to bypass. Newer devices contain features such as the rolling retest, which requires drivers to provide breath tests at random intervals, to discourage drinking drivers from asking sober people to blow into the IID to start the vehicle. However, while IIDs have become more sophisticated, they are not the “silver bullet” that will finally solve the drinking and driving problem. Even if the devices were foolproof, circumvention is as easy as finding another vehicle to drive that is not equipped with an IID (International Council on Alcohol, Drugs and Traffic Safety, 2001).
IID Programs & Evaluations
A number of states developed and implemented pilot-IID programs beginning in the mid-1980s, including California, which was the first state to enact legislation that authorized judges to order DUI offenders to install IIDs (Fulkerson, 2003). Many of these programs were evaluated in order to determine whether IIDs are an effective countermeasure for drunk driving, but only a handful of studies were done with sufficient methodological rigor to yield results that are reliable.
California’s ignition interlock pilot program was one of the first to be evaluated. This study compared a group of drivers convicted of driving-under-the-influence (DUI) who were ordered to install an IID, and who did so, with a matched comparison group of DUI offenders. While the matching and study design helped control some of the potential biases, there are limitations to the study and its results should be viewed cautiously. This study found that there was no statistically significant difference in the subsequent DUI conviction rate between DUI offenders who installed IIDs and DUI offenders who did not (EMT Group, 1990).
The findings from the California study that IIDs have no impact on DUI recidivism were supported by a study of a pilot IID program implemented in Oregon in 1988. This program consisted of an eleven-county region where DUI offenders could apply for a restricted license by installing an IID, and also where DUI offenders who were ready to reinstate their driver licenses could choose between an additional 6-month period of license suspension, or license reinstatement if they installed an interlock. This study, while not employing random assignment, did use statistical controls to attempt to control bias, and so like the California study should be viewed as somewhat, but not fully, controlling bias. Jones, the study’s principal investigator, summarized the results by stating that IIDs are effective while installed, but not more effective than license suspension (Jones, 1992).
Several other credible studies have been conducted of ignition interlock programs implemented in other states, and these studies, contrary to the California and Oregon studies, show that IIDs can be effective in reducing DUI recidivism. Two studies conducted shortly after the California and Oregon studies, examined ignition interlock programs in North Carolina (Popkin et al., 1992) and Ohio (Elliot & Morse, 1993). The North Carolina study was not well controlled, so its findings should be regarded as suggestive rather than definitive. This study compared a group of relatively low-risk second DUI offenders with IIDs to second DUI offenders who were granted a conditional driver license, and found that those offenders receiving IIDs had a lower rate of subsequent DUI convictions than offenders in the comparison group. Interestingly, the DUI recidivism rates for the interlock group were similar to a group that included DUI offenders who began the relicensing process but did not complete it, and those offenders who were offered a license if they installed an interlock, but refused to do so. This group, who remained unlicensed, recidivated at the same rate as the interlock group, suggesting that the effects of IID are no better than licensing actions. The Ohio study was better controlled, and in this way is more similar to the California and Oregon studies. This study examined a population of multiple DUI offenders in Hamilton County Ohio, comparing drivers who installed IIDs with drivers with suspended driver licenses. The results showed that drivers installing interlocks had significantly fewer subsequent DUI convictions than suspended drivers, although this positive effect vanished once the IIDs were removed from the vehicles.
A more recent study, notable for its use of random assignment in a scientifically rigorous design, examined multiple DUI offenders in Maryland who had petitioned a medical advisory board for driver license reinstatement (Beck et al., 1999). The study randomly assigned drivers to a 1-year term of IID use, or to a control group that included participation in an alcohol program. The results from this study demonstrated that drivers installing an IID had significantly lower rates of subsequent DUI convictions than drivers in the control group during the period that the interlock remained installed on the vehicle, but that this positive effect disappeared once the devices were removed. These findings should be regarded as the most definitive to date on the effects of IIDs on DUI recidivism, although they only generalize to a relatively small, specific group (i.e., multiple DUI offenders willing to install an IID to become relicensed).
Three additional ignition interlock studies deserve mention. The first study evaluated the effects of an ignition interlock program that was implemented in Alberta, Canada in 1990 (Weinrath, 1997). This study found that drivers installing an IID were significantly less likely to be convicted for a subsequent DUI than suspended drivers in the comparison group, and also less likely to be involved in an injury crash. The second study examined multiple DUI offenders in Illinois, some of who were required to install IIDs in their vehicles (Raub et al., 2003). The results demonstrated that drivers in the interlock group were significantly less likely to be rearrested for DUI during the year that the interlock was installed in their vehicle than drivers in the comparison group,
although the recidivism rate of the interlock group rose to the comparison group’s rate once the IID was removed. The final study presents preliminary results from an evaluation of a pilot ignition interlock program recently implemented in Sweden (Bjerre, 2003). This study is unique in that it examines biological markers of alcohol use at periodic intervals to measure changes in drinking. Early results indicate that drivers participating in the ignition interlock program showed a decline in alcohol use as measured by biological markers, as well a decline in recidivism, relative to drivers in a comparison group.
The results of research conducted to date of ignition interlock programs implemented throughout North America are somewhat mixed, although the preponderance of evidence suggests that IIDs are effective in reducing DUI recidivism, by as much as 40-95%, at least as long as they remain installed on vehicles (International Council on Alcohol, Drugs and Traffic Safety, 2001). Most studies showing positive results of interlock also show that there is no social learning associated with the devices—that is, once removed from the vehicle, recidivism climbs back up.
While the weight of the research evidence to date shows that IIDs can be effective in reducing DUI recidivism, there are significant problems in utilizing IIDs effectively, and important questions about the devices remain unanswered. Perhaps the biggest roadblock in implementing a successful interlock program is getting the devices into vehicles; most studies show that only a small minority of drivers will install IIDs, even when ordered to do so by the courts (DeYoung, 2002; International Council on Alcohol, Drugs and Traffic Safety, 2001). In addition, while the devices appear to reduce DUI recidivism, little is known about their impact on crashes, and which types of offenders the devices work most effectively for.
Ignition Interlock in California
The first use of IIDs in California was authorized by the Farr-Davis Safety Act of 1986, which established a pilot program in four counties in the state where judges could order DUI offenders to install an interlock on their vehicles as a condition of probation. The law also mandated that the pilot program be evaluated, and included a sunset provision so that IIDs would not be used indefinitely in California if they were shown to be ineffective.
As discussed previously, California’s interlock program was evaluated (EMT Group, 1990) and found to be ineffective. Despite the fact that the evaluation results did not show IIDs to be an effective DUI countermeasure in California, subsequent legislation (AB 2040) authorized the use of interlock devices statewide. Like the Farr-Davis Safety Act, this new law allowed judges to discretionarily order IIDs for DUI offenders. However, it soon became clear that judges were not using interlock as a sentencing option for most eligible DUI offenders, so the Legislature enacted AB 2851 in 1993, which eliminated the discretionary nature of the previous interlock law, and required judges to order IIDs for all repeat DUI offenders. Even with this new mandatory law, judges ordered IIDs for only 20-25% of repeat DUI offenders.
In order to develop a more robust interlock program in California that had sufficient numbers of participants that the effectiveness of the devices could be evaluated, the Research and Development (R&D) Branch at the Department of Motor Vehicles (DMV) convened an interagency task force to critically examine the interlock laws, and recommend changes. As a result of this effort, the California Legislature enacted AB 762 (see Appendix), which shifted the focus of “mandatory” IID law from repeat DUI offenders to drivers convicted of driving on a DUI-suspended driver license (DWS-DUI). The rationale behind this shift is that while DUI offenders with suspended driver licenses may or may not continue to drive in violation of their suspension, DWS-DUI offenders have already demonstrated that they will drive and pose a risk on the highways, and thus need more corrective measures. This shift in focus was in response to judicial concerns over the logical inconsistency of prior laws.
Although the Legislature has enacted subsequent legislation concerning IID (AB 2227), the thrust of AB 762 remains intact. Under the current IID laws, judges must order IIDs for DWS-DUI convictees, and for drivers arrested for DWS-DUI who are convicted of a less serious driving while suspended (DWS) offense. Judges may also order IIDs for DUI offenders at their discretion. In addition to this judicial IID program, there is a discretionary IID program administered by the DMV. Under this administrative program, multiple DUI offenders may, after serving half of their license suspension period, install an IID and apply to the DMV for a restricted driver license. These IID laws became effective July 1999.
The legislation that created the current IID program also contains a provision that requires the DMV to conduct rigorous, scientific evaluations of IIDs and report the findings to the Legislature. The first evaluation is a process study, which examines the degree to which interlock laws have been implemented in California. This study was completed and delivered to the Legislature in July 2002. The results of the process evaluation showed that the ignition interlock laws have been poorly implemented; judges order IIDs for only a fraction of the DWS-DUI offenders who are required by law to receive such an order, only a minority of offenders ordered to install an IID do so, and few repeat DUI offenders opt to shorten their license suspension by installing an IID and applying to DMV for a restricted driver license (DeYoung, 2002). While some recommendations were made in the final report of the process study for changes in court reporting of IID orders, and the monitoring of offenders ordered to install an IID, the main recommendation was to delay further modifications to California’s interlock laws until the results of the second study, an outcome evaluation, were available to guide any changes.
This report describes this second, Legislatively-mandated study, of California’s ignition interlock program. It employs the most rigorous methods possible to evaluate the effectiveness of IIDs in reducing DUI recidivism, and improving traffic safety in California. The results of this study, used along with those of the Legislatively-mandated process study of IIDs, provide important information that can guide law and policy regarding the most effective and efficient use of ignition interlock in California.
METHODS
California’s ignition interlock program is really several different programs, because California law regarding IIDs both mandates and authorizes their use with different types of offenders in different circumstances. For example, judges are required to order IIDs for drivers convicted of DWS-DUI, while repeat DUI offenders can choose to install an interlock after serving half of their license suspension period in order to obtain a restricted license. Because of this variation in the use of IIDs, this outcome evaluation is comprised of six smaller studies, each of which examines the effectiveness of the devices used in a specific context. Taken together, these six studies provide a comprehensive picture of the effectiveness of IIDs as a traffic safety countermeasure in California. These six studies are described below.
Selection of Subjects
Study 1: DWS-DUI offenders with an IID order or restriction
California law requires judges to order drivers convicted of DWS-DUI and drivers arrested for DWS-DUI but convicted of a lesser DWS offense, to install an IID on their vehicle. This is a central part of California’s ignition interlock program, and represents the only mandatory use of the devices in the state. However, the process evaluation of California’s IID program showed that judges often restrict drivers to driving an IID-equipped vehicle, rather than order them to install an interlock device, because offenders either have no vehicle, or cannot pay for an IID. Thus, study 1, which examines the effectiveness of IIDs for DWS-DUI offenders ordered by the court to install a device, or restricted to driving an IID-equipped vehicle, is the main evaluation of California’s interlock program.
Subjects were initially identified using court conviction data reported to DMV and stored on the department’s driver license database. All drivers who were convicted of DWS-DUI between January 2000 and July 2002 were included in the initial selection process. The next step in forming the sample involved excluding some subjects, because data on their driving records is unreliable, and including them in the study could yield misleading results. For obvious reasons, drivers who were reported deceased, and drivers who lived outside California, were removed from the sample. In addition, drivers who did not have a California driver license were excluded, due to the difficulty in tracking any subsequent crashes and convictions on their driving records. One group of drivers who were not excluded were subjects whose record indicated that the court ordered them to install an IID, but who failed to comply by actually installing a device. It is important to include such “dropouts,” because they represent part of the effect of California’s ignition interlock program. All sanctions, whether they involve jail, fines or license suspension, involve offenders who fail to comply, and these non-compliers should be included in any evaluation of the sanction in order to give a complete picture of its effects. Two other studies, which are described later in the
paper, examine only those offenders who actually installed an interlock, and this provides information on the efficacy of the devices themselves (as opposed to California’s program utilizing them).
After removing deceased, out-of-state and unlicensed drivers, those subjects who were ordered to install an IID or restricted to driving an IID-equipped vehicle were identified using court sentencing information contained on DMV’s driver license database. In addition, it was important to identify and develop a comparison group of drivers who were convicted of DWS-DUI and who did not receive a court order to install an interlock device or a restriction to driving an IID-equipped vehicle. This comparison group was identified using court sentencing information contained on the driver license database.
Study 2: DWS-DUI offenders with an IID order
As was mentioned in the description of study 1, the intent of California’s mandatory IID law is that judges order all offenders convicted of DWS-DUI to install an interlock device, but that for reasons of cost and non-possession of a vehicle, many offenders are instead simply restricted to driving a vehicle equipped with an IID. In order to assess the effectiveness of just court orders to install an IID, study 2 identified a sample of offenders who received a court order to install an interlock device, removing restricted drivers from the sample. Thus, while study 1 examines California’s mandatory IID program as it is presently implemented, study 2 evaluates California’ mandatory program as it was intended to be implemented.
Subjects for study 2 were initially identified from DMV records by selecting all drivers who received a DWS-DUI conviction between January 2000 and July 2002. As with study 1, the next step was to identify and remove drivers who were reported deceased, who lived outside of California, or who did not have a California driver license.
Because of the way court sentencing information is reported to DMV, it was not possible to use DMV records to identify those DWS-DUI convictees in the sample who received a court order to install an IID, from the larger group who received either a court order to install an IID or who were restricted to driving an IID-equipped vehicle. Instead, it was necessary to develop a subsample of offenders with an IID order/restriction, track them back to the adjudicating court, and then use court records to identify those who had a court order to install an interlock device.
It was infeasible to track offenders back to all courts in the state, because some courts did not keep sufficiently detailed records, and also because such a strategy would have been excessively time-consuming and expensive. Instead, a subsample of drivers was selected who were adjudicated by seven counties in the state, representing Southern and Northern California, inland and coast, and large urban areas and rural jurisdictions. These seven counties were; Kern, Los Angeles, Monterey, Orange, San Diego, Shasta and Solano.
It was necessary to select a comparison group of drivers who did not receive an order to install an IID. The comparison group was selected from the same overall DWS-DUI conviction sample that was convicted in one of the seven counties in the state, but drivers in the comparison group did not receive an order to install an IID, or a restriction to driving an IID-equipped vehicle.
Study 3: DWS-DUI & DUI offenders installing an IID
While studies 1 and 2 evaluate California’s IID program as implemented, and as intended, respectively, study 3 is fundamentally different in that it examines the efficacy of the devices. This is important, because while California’s IID program may not be effective due to problems with implementation, the devices may effectively reduce DUI recidivism when installed. If such a situation exists, it would be important to revise California’s program to more effectively utilize IIDs. Conversely, if the IIDs are shown to be ineffective, there would be no point in using them as a DUI countermeasure.
Because DMV’s driver license database does not contain information on drivers who install an IID, and court records only sporadically contain such data, it proved necessary to rely on records maintained by ignition interlock providers. Five interlock manufacturers/installers representing the interlock companies licensed to provide IIDs in California were contacted, and asked to provide identifying information on all offenders for whom they installed IIDs after January 2000. Once data for these drivers were obtained, the identifying information was used to locate their driving record on DMV’s driver license database.
Using driver record data, drivers who were reported deceased, who lived outside California, or who did not have a California driver license, were removed from the sample. Drivers were also removed from the sample if their IID was installed after January 2003, because there would be insufficient time for subsequent traffic convictions and crashes to accrue and be posted to their DMV record.
As with the other studies, it was important to identify and develop a comparison group of drivers who did not experience the sanctions. Comparison group drivers for this study consisted of drivers who were convicted of the same offense (i.e., DWS-DUI or DUI) as drivers in the interlock-installed group, who were neither ordered to install an IID, nor restricted to driving an IID-equipped vehicle. Comparison group drivers were identified using DMV’s driver license database, and consisted of drivers convicted of DWS-DUI or DUI between January 2000 and January 2003.
Study 4: DUI first offenders with an IID order or restriction
California law allows, but does not require, judges to order first DUI offenders to install IIDs in their vehicles, with special consideration given to first DUI offenders who had a blood alcohol concentration (BAC) level of .20% or higher at the time of their arrest. The rationale underlying this law is that first DUI offenders with such a high BAC level
are likely problem drinkers or alcoholics, and that IIDs can minimize their risk on the highways.
The sample of first DUI offenders was initially identified using conviction information on DMV’s database. When the department receives data from a court showing a conviction for DUI, this information is posted to the offender’s driving record, and information about the conviction and the offender is also written to a separate file consisting of drivers convicted of DUI. This file, referred to as the BAC tape, was the source used to identify first DUI offenders for this study.
Using driver record information, those drivers who were convicted of their first DUI offense between January 2000 and January 2003, and whose record indicated that the court either ordered them to install an IID, or restricted them to driving an IID-equipped vehicle, were selected. Drivers whose record indicated that they were deceased, resided outside California, or did not possess a California driver license were removed from the sample. Since the law states that judges should give heightened consideration to prescribing interlocks for those first offenders with BACs of .20% or higher at the point of arrest, first offenders in the sample whose driver record contained BAC information (approximately 88%) were identified, and those whose record showed that their BAC at arrest was .20% or higher were selected for the sample.
In order to evaluate the effectiveness of IIDs for first offenders, a comparison group was created. Drivers in the comparison group were also selected from the BAC tape, and consisted of offenders receiving their first DUI conviction during the same time frame as the first offenders in the IID group. Drivers were ultimately selected for inclusion in the comparison group if their record indicated that their BAC at the time of arrest was .20% or higher, and the court neither ordered them to install an IID, nor restricted their driving to vehicles equipped with an interlock device.
Study 5: DUI second offenders with an IID order or restriction
Prior California law required judges to order second DUI offenders to install an IID in their vehicle. This mandatory law was subsequently amended to target DWS-DUI offenders, rather than repeat DUI offenders, but current law still allows judges to order repeat offenders to install an interlock, and judges do issue such orders to some extent. Study 5 is an evaluation of the effectiveness of IID orders/restrictions for second DUI offenders, and can be compared to study 1, which focuses on the somewhat different population of DWS-DUI offenders.
The methods used to sample second DUI offenders were very similar to those outlined above for the first DUI sample in study 4. The BAC tape was used as the sampling frame, and using this data file all drivers convicted of DUI between January 2000 and January 2003 were initially selected. Driver record data were gathered for the drivers initially selected, and using these data, those drivers with a prior DUI conviction within the previous seven years were identified and selected. Court conviction data on the driver record were used to identify those second DUI offenders who were either
ordered by the court to install an IID in their vehicle, or who were restricted to driving a vehicle equipped with an interlock device. Finally, the sample was refined by removing those drivers who were reported deceased, who resided outside of California, or who had no California driver license.
In order to provide a baseline with which to compare the traffic safety effects of an IID order/restriction, a comparison group of drivers was created, using the BAC tape. Second DUI offenders whose driver record indicated that they were neither ordered by the court to install an IID, nor restricted to driving an interlock-equipped vehicle, were identified. As with the IID ordered/restricted group, drivers who were reported deceased, resided outside California, or who were unlicensed, were removed from the comparison group.
Study 6: DUI second offenders installing an IID
While most of California’s IID laws either require or allow the court to order DWS-DUI or DUI offenders to install an IID, there is another law that leaves the choice of IID installation up to the offenders themselves. This law allows repeat DUI offenders who have served half of their period of license suspension/revocation, to install an IID and apply to the DMV for a restricted driver license. This final study, study 6, examines the effectiveness of IIDs for repeat DUI offenders who choose to install an IID. Note that this study is different from the others, with the exception of study 3, in that it evaluates the efficacy of interlock devices for those drivers who actually install them.
DMV’s driver license database was used to develop the second DUI offender sample for study 6. When a second DUI offender installs an interlock device and applies to the department for a restricted driver license, certain codes are placed in the database to record this event. Thus, using these codes, DMV records were searched to identify those second DUI offenders installing an IID and applying for a restricted driver license between January 2000 and July 2001. One year was added to the initial selection date to correspond to the eligibility requirement of IID.
Once the initial second DUI offender sample was identified, it was necessary to use driver record data to remove those drivers who were reported deceased, who lived outside of California, or who did not possess a California driver license. In addition, it was necessary to develop a comparison sample that would serve as a baseline for assessing the traffic safety effects of interlock installation. A comparison sample was developed using DMV records to identify second DUI offenders who remained suspended, rather than opting to install an IID and obtain a restricted driver license. As with the other analyses, the comparison sample for study 6 excluded deceased, unlicensed and out-of-state drivers.
Research Design
The same research design was used in all six studies that comprise this outcome evaluation to answer questions about the effectiveness of ignition interlock in
California. This design compares the rates of DUI convictions and crashes for drivers who are “treated” with interlock, to the rates for a very similar group of drivers in the comparison group who did not install an interlock, or receive an IID order/restriction. The logic of this design is that, all other things being equal, if IIDs are an effective traffic safety countermeasure, then this should be reflected in a lower rate of subsequent DUI convictions/crashes on the records of treated drivers, relative to drivers in the comparison group, who do not receive an IID treatment. The key to this design is, “all other things being equal.”
If all other things are not equal, then there can be other, extraneous factors, that can influence differences in subsequent driving behavior between the IID treated drivers and the comparison drivers, besides that of IID treatment. For example, if drivers treated with interlock have worse prior driving records than comparison drivers, we would expect that IID treated drivers would have worse subsequent driving records, apart from the interlock treatment that they received. In short, these extraneous pre-existing differences between the groups could bias the results, rendering the findings misleading or ambiguous.
The gold standard in research is to randomly assign subjects to the groups being compared, so that extraneous factors are spread evenly among the groups. Unfortunately, as in almost all of the prior research on ignition interlock, random assignment was infeasible in the present study. Instead, the drivers in this study selected themselves into IID treatment or comparison groups, and/or were selected by judges into the groups. This selection process could have produced treatment and comparison groups that were different to begin with, in ways that may have influenced the results.
In order to attenuate as much of this potential pre-existing group bias as possible, statistical controls were used at two levels, firstly to match control drivers to treated drivers, and secondly to remove bias during the analysis by using covariates in the statistical models. The use of covariates will be discussed in more detail in the analysis section of the paper, while this section will describe the matching process.
Comparison drivers were matched to treated drivers through the use of propensity scores, following the work of Rosenbaum and Rubin (1985). Propensity scores can be thought of as predicted values, and as used here they reflect the probability that a driver was in the IID treatment group. Propensity scores were calculated for all drivers in the IID treatment and comparison groups using SAS PROC LOGISTIC to perform logistic regression analysis, incorporating demographic and prior driving variables as predictors in the model.
Once propensity scores were computed for all drivers, the next step was to match control drivers to treated drivers based on two criteria, propensity score and the number of days in the study. The latter criterion was included to ensure that the follow-up periods were the same for the two groups. A program was developed using SAS software to perform the matching. For each study, the program first selected a
driver in the IID treatment group, and then chose from the much larger pool of comparison drivers, all those drivers who had a days-in-study value that was within 15 days of the corresponding value for the treated driver. In the next step, the program compared the propensity scores of each comparison driver from the initially selected pool of such drivers, to the score for the selected treated driver, and then selected the control driver with the closest propensity score to include in the final sample of comparison drivers. In this way, the comparison drivers selected for the final sample were as similar as possible to the IID treated drivers on those dimensions used to form the propensity scores, thus helping to reduce potential pre-existing group differences that might bias the study results. The final sample sizes, average propensity scores, and average days in study are presented in Table 1.
Table 1
Mean Propensity Scores, Days in Study and Sample Sizes for Study Groups Mean propensity score Mean days in study Sample size Study 1 Interlock 0.069345 724.49 6742 Comparison 0.069292 724.53 6742 Study 2 Interlock 0.049961 767.25 1691 Comparison 0.045008 767.72 1691 Study 3 Interlock 0.043136 602.18 4219 Comparison 0.043090 602.18 4219 Study 4 Interlock 0.028961 766.21 1227 Comparison 0.028207 766.15 1227 Study 5 Interlock 0.088445 786.95 5416 Comparison 0.088410 786.99 5416 Study 6 Interlock 0.029028 653.49 600 Comparison 0.029025 653.34 600
While the use of propensity score matching and covariates in the statistical modeling are valuable in reducing bias, they cannot reduce all bias, because it is impossible to know all of the dimensions on which the groups differ that might affect study results, and to have data on these dimensions. Because of this, the study results should be viewed as portraying relationships between IID treatment and subsequent traffic safety
measures, rather than providing definitive evidence that IID treatment results in a particular traffic safety outcome.
Analysis
Prior to running the statistical models, descriptive statistics were calculated for all variables to check for outliers, missing data and potential multicollinearity problems. Means and variances were calculated for all covariates and outcome measures, and group means and variances were calculated and compared between the groups.
The same analytical procedures were used in each of the six studies in the evaluation. For each study, statistical models were developed separately for each of the three outcome measures: days to first subsequent DUI conviction, days to first subsequent DUI incident (alcohol-involved arrest, conviction or crash), and days to first subsequent crash. The statistical technique used to analyze these measures was Cox regression, a particular type of survival analysis.
Cox regression analyzes the time to some event or outcome, in the case of this study, the number of days to first subsequent DUI conviction, incident or crash. An important aspect of Cox regression is that covariates can be used in the model. In the Cox models developed for this study, demographic and prior driving measures were included as covariates to help control bias, and in a hierarchical fashion, group (IID treatment versus comparison) was entered after the covariates to assess whether IID treatment affected the particular traffic safety outcome measure being analyzed, after controlling for the covariates. A significant treatment effect is indicated by a significant chi-square for the effect, with the direction of the effect shown by the sign of the parameter estimate and associated hazard ratio. Because Cox regression omits the baseline hazard from the partial likelihood equations used to estimate the treatment and other effects in the model, and instead focuses on estimating the coefficients for the variables in the model, it was not necessary to specify a distributional form for the three outcome measures.
The first step in conducting the statistical modeling for each outcome measure in each study was to select the covariates to use in the model. This was done by first examining for each potential covariate, its simple correlations with the group variable, and with the outcome measure, and selecting the covariate if its relationship with both measures was significant. Next, SAS PHREG was used to run a backward elimination stepwise Cox regression analysis, using all potential covariates identified in the first step as predictors, and the particular outcome measure of interest as the outcome (e.g., days to first subsequent DUI conviction, etc.). Those covariates that were found to be significant in the stepwise model were used in the final Cox regression model. Note that most of the prior driving covariates were measured 3 years prior to the reference date of IID installation/order/restriction, except for major convictions (usually alcohol involved), which were measured 7 years prior.
After the covariates were selected, SAS PROC LIFETEST was used to produce Kaplan-Meier estimates of the sample (i.e., no covariates) survivor, log negative log survivor, and hazard plots. These plots were used to examine the raw survivor and hazard functions for the IID treatment and comparison groups, not adjusted for the covariates,
which provided information on the groups’ survival over time, and times at which they were at particular risk of recidivating. The plots were also used to check whether the hazards of the groups were proportional over time, a requirement of Cox regression. In addition to using sample plots to check the proportional hazards assumption, this assumption was also examined by calculating differences between the log negative log functions for the different levels of each covariate and treatment group in the model, as discussed by Singer and Willett (2003). Based on these initial steps, a final statistical check of the proportional hazards assumption was performed by using SAS PROC PHREG to run Cox models that included covariate x time (e.g., days to first subsequent DUI conviction), and group by time interactions, with the form of the interaction informed by the initial plots. As Allison (1995) points out, a violation of the proportional hazards assumption is not fatal, but simply one of several possible model misspecifications that, in this case, is appropriately handled by leaving the significant interaction(s) in the final model.
With the preliminary steps taken care of, final Cox regression models were developed for each outcome measure, in each of the six studies. The models included all of the covariates, entered as a block, followed by any covariate x time interactions, then the treatment group, and finally any treatment group x time interactions. The models fit the covariates first and then entered the treatment group variable, in order to assess the relationship between IID treatment and the three variables DUI convictions, DUI incidents, and crashes, after adjusting for the covariates. Ties in event times were handled by the exact method. The significance of an interlock treatment effect was judged by a chi-square that was significant at p = .05, with the direction of the effect revealed by the sign of the associated parameter estimate and the hazard ratio. Finally, fitted survivor and hazard graphs were produced to provide a visual representation of the effects of IID treatment on the outcome measure, controlling for the covariates. The adequacy of each Cox regression model was assessed through several diagnostic tests. Deviance residuals were calculated and plotted to check for outliers. In addition, likelihood displacement statistics were produced to look for cases that would produce unusually large changes in the log likelihood of the model if they were removed, and dfbeta statistics were calculated to look for cases that would strongly affect parameter estimates if removed.
RESULTS
Study 1: DWS-DUI offenders with an IID order or restriction
As a part of the various data screening procedures for study 1, ANOVA and contingency tables were used to assess how the IID treatment group and the comparison group differed on prior driving history and demographic variables. Differences between the groups that were statistically significant provided clues as to how pre-existing group differences might affect the study results. The results of the analyses comparing the groups showed that the offenders in the IID treatment group had, on average, higher numbers of 3-year prior traffic convictions, 7-year prior alcohol/drug major convictions, 3-year prior injury crashes, 3-year prior
alcohol/drug-related crashes, and 3-year prior DWS convictions. Although these differences were statistically significant, they were relatively small in size. These results indicate that offenders in the IID treatment group were riskier than drivers in the comparison group, and that IID treatment group offenders could be expected to have higher recidivism rates than comparison offenders apart from any effects of the IID treatment. These results also indicated that it was important to include covariates in the Cox regression model that assessed the effectiveness of IID orders/restrictions.
Days to first subsequent DUI conviction
Simple correlations were computed between the prior driving history and demographic variables, and days to first subsequent DUI conviction and treatment group, in order to assess which variables could be used as covariates in the Cox regression models. There were three variables that had statistically significant correlations with both days to first subsequent DUI conviction and treatment group, and these variables were: 3-year prior traffic convictions, 7-year prior alcohol/drug major convictions, and 3-year prior DWS convictions.
In order to determine which of these variables were significant in the context of all three variables considered together, and which could be eliminated from consideration due to significant shared variance, all three variables were entered into a backward elimination stepwise Cox regression model predicting days to first subsequent DUI conviction. The results from this analysis showed that two of the three variables were statistically significant, and should be used as covariates in the final Cox regression model. These two significant variables were 3-year prior traffic convictions and 7-year prior alcohol/drug major convictions.
Once the covariates were selected, procedures were run to check the adequacy of one of the main assumptions underlying the Cox regression model, the proportional hazards assumption. This assumption specifies that the hazard rates for the levels or groups defined by each predictor variable are proportional over time. This assumption was examined first by creating difference plots of the log negative log function for each level of a predictor variable (Singer & Willett, 2003). In addition, SAS PROC LIFETEST was used to produce sample survivor and hazard plots, which provided clues as to the form of any possible non-proportionality.
The final, and definitive test for checking the proportional hazards assumption was to create interaction terms of each predictor x time (days to first subsequent DUI) in a Cox regression model, and determine whether the interaction was statistically significant. When the statistical interaction tests were run for the two covariates and treatment group variable, in a Cox regression model predicting days to first subsequent DUI conviction, the results showed that none of the interactions were significant, and thus that the proportional hazards assumption was not violated.
SAS PHREG was used to fit the final Cox regression model for days to first subsequent DUI conviction, incorporating the two covariates and treatment group variable as predictors. The results are shown in Table 2.
Table 2
Cox Regression Model, Study 1, Days to First Subsequent DUI Conviction
Variable
Parameter
estimate Chi-square P value
Hazard ratio
3-yr prior traffic convictions 0.0428 4.336 0.0373 1.044
7-yr prior alc/drug major conv 0.2227 57.598 < .0001 1.249
Treatment group 0.0187 0.095 0.7577 1.019
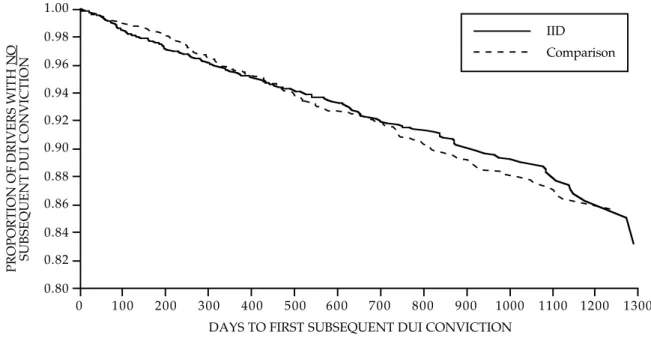
While the two covariates are statistically significant, the group effect is clearly not significant, with a p value = .76. Thus, this analysis shows that there is no difference in the number of days to first subsequent DUI conviction between DWS-DUI offenders receiving an IID order or restriction, and DWS-DUI offenders not receiving such an order or restriction. In other words, the issuance of an order to install an IID, or an IID restriction, by the court did not affect the recidivism rate of DWS-DUI offenders. This can be seen visually in Figure 1, below.
Figure 1 shows the proportion of drivers in the IID treatment and comparison groups who survive, or who do not have a subsequent DUI conviction during the study
follow-0.84 0.86 0.88 0.90 0.92 0.94 0.96 0.98 1.00
PROPORTION OF DRIVERS WITH
NO
SUBSEQUENT DUI CONVICTION
0 100 200 300 400 500 600 700 800 900 1000 1100 1200 1300 1400 DAYS TO FIRST SUBSEQUENT DUI CONVICTION
Figure 1. Final survival model: Number of days to first subsequent DUI conviction for DWS-DUI offenders receiving an IID order/restriction versus DWS-DUI offenders not receiving an IID order/restriction.
Comparison IID
up period. Note that a higher line for a group represents a lower DUI recidivism rate, since more drivers survive without a subsequent DUI conviction.
The most salient aspect of Figure 1 is that the survival rates for the two groups are very close together, confirming the result from the statistical analysis that showed that there was no difference between the IID treatment and comparison groups in days to first subsequent DUI conviction.
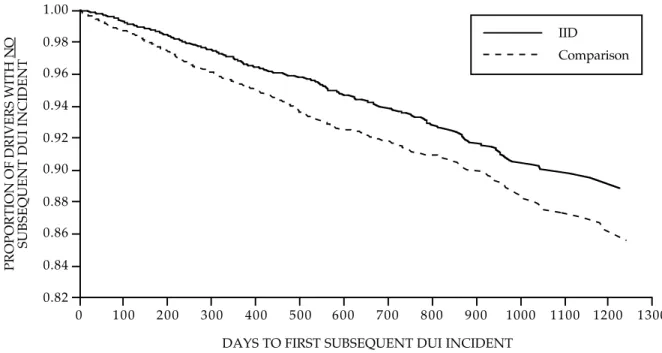
Days to first subsequent DUI incident
SAS was used to compute simple correlations between each of the prior driving history and demographic variables that could be used as covariates, and days to first subsequent DUI incident, and the treatment group variable. There were five prior driving history/demographic variables that had statistically significant correlations with both treatment and subsequent DUI incidents, and these were: gender, 7-year prior alcohol/drug major convictions, 3-year prior traffic convictions, 3-year prior DWS convictions, and 7-year prior alcohol-related crashes.
The five variables identified as potential covariates were used as predictors in a backward elimination stepwise Cox regression analysis, where days to first subsequent DUI incident served as the outcome. The results of this analysis revealed that two variables—gender and 7-year prior alcohol/drug major convictions—were significant within the context of all five variables considered together. These two variables were used as covariates in the main Cox regression analyses of subsequent DUI incidents. Once the covariates were identified and selected, the next step was to check whether the covariates or the treatment group variable violated the proportional hazards assumption. SAS LIFETEST was used to produce sample survival and hazard plots, which were then checked for potential violations of the proportional hazards assumption; these plots did not reveal strong evidence of such a violation. This finding was confirmed by calculating difference plots of the log negative log survival function for each level of each covariate and the treatment variable.
While the preliminary test did not reveal evidence of a violation of the proportional hazards assumption, a final, definitive check was performed by using SAS PHREG to perform a Cox regression analysis, where interactions were formed with each predictor variable and days to first subsequent DUI incident, and entered in to the model. These analyses showed that all interaction terms were non-significant, confirming the results of the preliminary tests that showed that there were no violations of the proportional hazards assumption.
The final Cox regression analysis of subsequent DUI incidents was performed using SAS PHREG. The model fit the two covariates first, and then assessed the significance of the IID treatment group variable, after adjusting for the covariates. The results of this analysis are shown in Table 3.
Table 3
Cox Regression Model, Study 1, Days to First Subsequent DUI Incident
Variable
Parameter
estimate Chi-square P value
Hazard ratio
Gender -0.8165 33.326 < .0001 0.442
7-yr prior alc/drug major conv 0.2471 91.077 < .0001 1.280
Treatment group 0.0006 0.0001 .9910 0.999
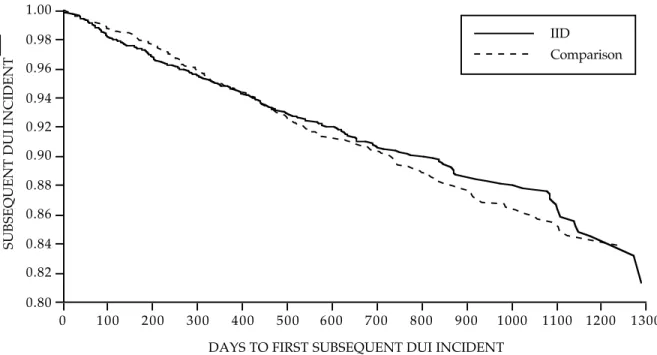
Both of the covariates are statistically significant, but the treatment group variable, with a p value of .99, clearly is not, indicating that there is no difference between the IID treatment and comparison groups in their number of days to first subsequent DUI incident. Thus, there is no evidence that DWS-DUI offenders who receive a court order to install an IID or a restriction to driving an IID-equipped vehicle, have different rates of subsequent DUI incidents than DWS-DUI offenders who receive no IID order/restriction. These results can be seen in Figure 2, below.
0.84 0.86 0.88 0.90 0.92 0.94 0.96 0.98 1.00
PROPORTION OF DRIVERS WITH
NO
SUBSEQUENT DUI INCIDENT
0 100 200 300 400 500 600 700 800 900 1000 1100 1200 1300 1400 DAYS TO FIRST SUBSEQUENT DUI INCIDENT
Figure 2. Final survival model: Number of days to first subsequent DUI incident for DWS-DUI offenders receiving an IID order/restriction versus DWS-DUI offenders not receiving an IID order/restriction.
Comparison IID
Figure 2 shows the survival rates for the IID treatment and comparison groups over the course of the study. It is clear from the figure that the rates of days to first subsequent DUI incident are very similar for the two groups, and the lines are so close at some points the survival rates are indistinguishable. This confirms the results from the statistical analyses shown in Table 3, which show that there is no statistically significant difference in days to first subsequent DUI incident between the IID treatment and comparison groups.
Days to first subsequent crash
Simple correlations were computed between the prior driving history and demographic variables, and days to first subsequent crash and the treatment group variable. An examination of these correlations revealed that the following four variables had statistically significant correlations with both treatment group and days to first subsequent crash, and so should be considered as potential covariates; gender, 3-year prior traffic convictions, 7-year prior alcohol/drug major convictions and, 3-year prior DWS convictions.
In order to exclude variables with significant shared variance with the other variables, the four prior driving history and demographic variables were entered as predictors in a backward elimination stepwise Cox regression analysis, with days to first subsequent crash the outcome. The results of this analysis showed that two of the four variables were statistically significant predictors of days to first subsequent crash, within the context of all variables considered together. These variables were, 3-year prior traffic convictions and 7-year prior alcohol/drug major convictions.
With the covariates selected, analyses were performed to see whether they, and the treatment group variable, violated the proportional hazards assumption underlying the Cox regression method. The LIFETEST procedure in SAS was used to graph the sample survival and hazard functions, in order to provide an indication whether the proportional hazards assumption was violated, and if so, what form the violation took. In addition, log negative log survival difference plots were produced for each level of the predictor variables. Neither the sample survival and hazard plots, nor the log negative log survival difference plots, suggested a violation of the proportional hazards assumption.
The final determination of whether the proportional hazards assumption had been violated was provided by several Cox regression analyses, where each covariate and the treatment variable were used, in turn, to form interaction terms with days to first subsequent crash. The results of these analyses showed that none of the interaction terms was significant, indicating that there is no evidence of a violation of the proportional hazards assumption.
SAS PHREG was used to run the final Cox regression model, which included the two covariates and the treatment group variable as predictors and days to first subsequent crash as the outcome. The model adjusted for the covariates first, and then calculated the contribution made by the treatment group variable, which indicated the effects of the IID order/restriction. The results of the Cox regression analysis are displayed in Table 4.
Table 4
Cox Regression Model, Study 1, Days to First Subsequent Crash
Variable
Parameter
estimate Chi-square P value
Hazard ratio
3-yr prior traffic convictions 0.1202 36.862 < .0001 1.128
7-yr prior alc/drug major conv -0.1516 20.618 < .0001 0.859
Treatment group 0.2704 17.594 < .0001 1.311
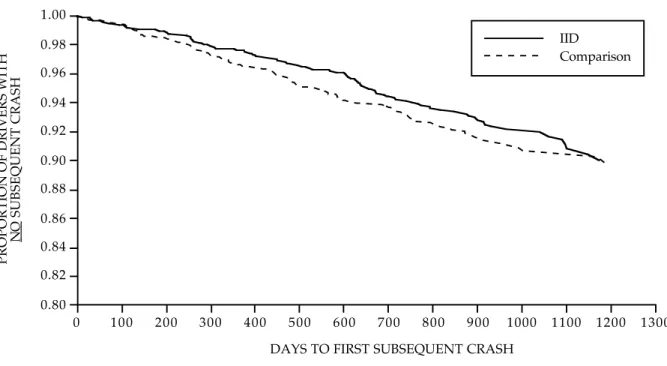
It can be seen from Table 4 that all of the predictors are statistically significant. Of particular importance is the treatment group effect, which is statistically significant, with a p value < .0001. This dichotomous variable was coded IID treatment = 0 and comparison = 1, so the positive parameter estimate and associated hazard ratio > 1.0 indicate that the hazard of a subsequent motor vehicle crash is greater for the comparison group. By taking the reciprocal of the hazard ratio for the treatment group, the focus can be shifted to how much lower the risk of a subsequent crash is for the IID treatment group. When this is done, it shows that offenders receiving a court IID order/restriction have a 24% lower crash risk than comparison offenders. This can be seen visually in Figure 3.
0.84 0.86 0.88 0.90 0.92 0.94 0.96 0.98 1.00
PROPORTION OF DRIVERS WITH
NO
SUBSEQUENT CRASH
0 100 200 300 400 500 600 700 800 900 1000 1100 1200 1300 1400 DAYS TO FIRST SUBSEQUENT CRASH
Figure 3. Final survival model: Number of days to first subsequent crash for DWS-DUI offenders receiving an IID order/restriction versus DWS-DUI offenders not receiving an IID order/restriction.
Comparison IID
Figure 3 shows that the IID treatment group’s survival curve is higher than the survival curve for the comparison group, confirming the findings from the statistical analysis that drivers receiving a court order to install an IID, or an IID driving restriction, survive longer without a subsequent crash than drivers not receiving an IID order/restriction. Thus, a court IID order/restriction is associated with a reduction in the rate of subsequent crashes, even though it does not seem to effect subsequent DUI convictions or DUI incidents.
Study 2: DWS-DUI offenders with an IID order
As a part of the various data screening procedures for study 2, ANOVA and contingency tables were used to assess how the IID treatment group and the comparison group differed on prior driving history and demographic variables. Differences between the groups that were statistically significant provided clues as to how pre-existing group differences might affect the study results. The results of the analyses comparing the groups showed that the offenders in the IID treatment group had, on average, higher numbers of 3-year prior traffic convictions, 7-year prior alcohol/drug major convictions, 3-year prior injury crashes, 3-year prior alcohol/drug-related crashes, and 3-year prior DWS convictions. Although these differences were statistically significant, they were relatively small in size. These results indicate that offenders in the IID treatment group were riskier than drivers in the comparison group, and that IID treatment group offenders could be expected to have higher recidivism rates than comparison offenders apart from any effects of the IID treatment. These results also indicated that it was important to include covariates in the Cox regression model that assessed the effectiveness of IID orders/restrictions.
Days to first subsequent DUI conviction
Simple correlations were computed between each of the potential covariates, and days to first subsequent DUI conviction and the treatment group variable. Variables that proved to have statistically significant correlations with both treatment group and days to first subsequent DUI conviction were selected as potential covariates. These potential covariates were: 3-year prior traffic convictions, 7-year prior alcohol/drug major convictions and, 3-year prior DUI convictions.
The three potential covariates identified in step 1 were next used as predictors in a backward elimination stepwise Cox regression model predicting days to first subsequent DUI conviction. The results of this analysis showed that only one of the three potential covariates was statistically significant within the context of all three considered together. This clearly shows that there was considerable overlapping variance among the three variables, and that only one needed to be used as a covariate in the final Cox regression model. The significant covariate used in the final model was 3-year prior alcohol/drug major convictions.
Sample survival and hazard plots were produced for the covariate selected—3-year prior alcohol/drug major convictions—and also for the treatment group variable, in order to check whether either variable violated the proportional hazards assumption. These plots did not show evidence of a violation of the assumption. Similarly, plots of the log negative log survival function of the levels of the two variables also failed to indicate a violation.
The final test of the proportional hazards assumption was conducted by forming interactions of 3-year prior alcohol/drug major convictions, and the treatment group variable, with days to first subsequent DUI conviction, and entering these into a Cox regression model. The results from these analyses showed that neither interaction was statistically significant, confirming the results of the visual inspection of the plots, which showed that the proportional hazards assumption was not violated. With the model assumption intact, final Cox regression models were developed to test the effects of IID orders on subsequent DUI convictions.
The final Cox regression model included the covariate, 3-year prior alcohol/drug major convictions, which was entered first, and the treatment group variable, whose effect on subsequent DUI convictions was adjusted for the effects of the covariate. The results of this analysis are presented in Table 5.
Table 5
Cox Regression Model, Study 2, Days to First Subsequent DUI Conviction
Variable
Parameter
estimate Chi-square P value
Hazard ratio
3-yr prior alc/drug major conv 0.2122 11.206 .0008 1.236
Treatment group 0.0579 0.282 .5954 1.060
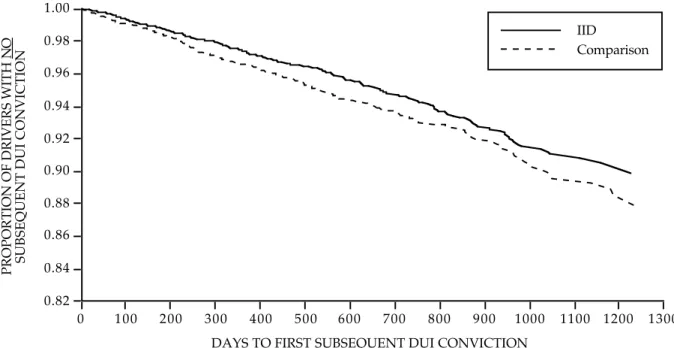
The covariate is statistically significant, but more importantly, the treatment group effect is not. With a p value of 0.59, it is clear that this analysis finds no evidence that a court order to install an IID is associated with a reduced risk of a subsequent DUI conviction. This can be seen in Figure 4, below.
Figure 4 shows that, initially, the comparison group has a slightly better survival rate than the IID treatment group, but that this trend shifts, and that by about 500 days, the IID treatment group better survives the risk of a subsequent DUI conviction. This appears to be a disordinal interaction, and it suggests that the overall effect of treatment group might be non-significant, but that an interaction of treatment group with time (days to first subsequent DUI conviction) might be significant. However, several forms of such an interaction were modeled, and none were significant. Thus, there is no