DEVELOPMENTS IN DECUMULATION:
THE ROLE OF ANNUITY PRODUCTS IN FINANCING RETIREMENT
Olivia S. Mitchell
Working Paper8567
http://www.nber.org/papers/w8567
NATIONAL BUREAU OF ECONOMIC RESEARCH 1050 Massachusetts Avenue
Cambridge, MA 02138 October 2001
This paper was presented at the May 2001 Bundesbank Conference on “Aging, Financial Markets, and Monetary Policy,” Frankfurt, Germany. Support for this research was provided by the Pension Research Council at the Wharton School, the National Bureau of Economic Research, the Wharton-SMU Research Center at Singapore Management University, and the Economic and Social Research Institute of the EPA of Japan. Helpful comments were provided by Alan Auerbach. Much of the research referenced draws on material appearing in a forthcoming volume by Jeffrey Brown, Olivia S. Mitchell, James Poterba, and Mark Warshawsky entitled The Role of Annuity Markets in Financing Retirement, MIT Press (2001). The views expressed herein are those of the author and not necessarily those of the National Bureau of Economic Research.
© 2001 by Olivia S. Mitchell. All rights reserved. Short sections of text, not to exceed two paragraphs, may be quoted without explicit permission provided that full credit, including © notice, is given to the source.
Olivia S. Mitchell
NBER Working Paper No. 8567 October 2001
JEL No. H3, G2
ABSTRACT
Longer lifespans are generally seen as a positive outcome of economic growth. Yet life extension also means that more people face the risk of living too long -- that is, outliving their assets and means of support. A range of financial products exists currently or can be envisioned for the future that would be useful in helping to protect people against having to dramatically curtail consumption in old age. This paper reviews the usefulness of life annuities in providing protection against longevity risk.
Olivia S. Mitchell
International Foundation of Employee Benefit Plans Professor of Insurance and Risk Management Executive Director, Pension Research Council The Wharton School, University of Pennsylvania 3641 Locust Walk, 307 CPC
Philadelphia, PA 19104-6218 and NBER
Tel: 215-746-5706 Fax: 215-898-0310 Email: [email protected]
Developments in Decumulation:
The Role of Annuity Products in Financing Retirement Olivia S. Mitchell
Driven by the prospect of a global aging boom, researchers and policymakers throughout
the developed world have devoted substantial effort to exploring what motivates household asset
accumulation patterns. It is during the accumulation phase that a society seeks to build up
resources adequate to finance retirement. More remains to be learned about this process, but even
less is known about what happens to people later in life, during which they are confronted with the
need to decumulate their resources in an orderly manner in retirement. To understand this
decumulation process better along with the factors that influence it, this paper explores a particular
financial tool that helps protect against key financial risks at the end of life. Specifically, I
examine the role of the life annuity, a financial contract in which the purchaser exchanges a certain
sum of money for a continuous stream of benefits until he dies. The insurer, or annuity provider,
pools longevity risk across all contractholders and is thus able to offer longevity insurance for the
customer population.
Financial contracts that pay off in the event of survival have been in existence for
centuries, with the tontines devised under Louis XIV’s reign and life annuities appearing in
Europe as early as the 1300’s.1 In modern times, life annuities have become a substantial
component of the life insurance market, but only a few of the products labeled annuities are, in
fact, “true” life annuities. For instance in the United States, purchases of life annuities totaled
almost $120 billion in 1999, but the vast majority of the market consists of variable annuities
rather than products paying out income for life (Brown, Mitchell, Poterba, and Warshawsky,
1One famous German tontine, that of Gotha in 1752, has been called the “perfect illustration of rococo finance”. In
exchange for a purchase price, the plan promised surviviors a fixed income of 3% per year plus a variable amount determined by lottery and mortality outcomes (Jennings and Trout, 1982).
forthcoming; henceforth BMPW). In the UK and Australia, annuity markets also appear relatively
small (Finkelstein and Poterba, 2000; Murthi, Orszag and Orszag, 1999; Doyle, Mitchell and
Piggott, 2001). Recent interest in annuity markets has come from Latin America, resulting from
more than a dozen countries having converted their pay-as-you-go national defined benefit (DB)
pensions into mandatory funded defined contribution (DC) pensions (Mitchell and Barretto, 1997).
Similarly, European pension reforms now underway are demanding that similar attention be paid
to these insurance markets as well (Blake 1999; Disney 2000; Disney and Johnson 2000;
European Commission 1997)
Under a DC pension plan, retirees are typically offered a range of choices regarding how to
convert their accumulated assets into retirement payouts. Usually the plan offers a portion of the
money as a lump-sum, and may also provide an option to disburse some funds as either a periodic
payment or an annuity. Perhaps inevitably, whenever annuities come to play a key role in a
nation’s retirement system, questions come up regarding how these products should be structured
and priced, and the extent to which governments should supervise and regulate the market for
these products. For example these debates surfaced in the most recent US presidential race, where
advisers to President Bush formulated individual account defined contribution proposals that
included annuity promises as a cornerstone (Feldstein and Ranguelova 2000).
In what follows, I explore lessons from research on the annuity market over the last decade
and discuss its relevance for aging, financial markets, and government policy. In particular I pose
and answer the following questions:
n How can annuities help retirees finance retirement? n What problems arise in annuity markets?
The discussion proceeds in five sections. Section 1 summarizes the economics of annuities, while
Section 2 sketches the methods commonly used to value annuities. Section 3 presents empirical
results from a range of countries, and Section 4 addresses the question of how the functioning of
these markets might be enhanced. A final section concludes.
1. Handling Retirement Wealth Decumulation
Many critics have decried Westerners’ inability or unwillingness to save for their own
retirement, with the US often identified as the most spendthrift country due to its low and
oftentimes negative saving rate. Nonetheless the strong US econo my over the past 25 years has
provided older generations with substantial wealth on hand as they look to retirement. Thus
pre-retirement wealth for US households in their 50’s amounts to $360,000 exclusive of Social
Security (in 1992$), with the median at $192,000 (see Table 1). If these households retire at age
62, their non-Social Security assets would be anticipated to amount to $438,000 on average
($239,000 at the median). Of this total, at least $100,000 of retiree assets and perhaps more will
have to be managed during retirement.
Table 1 here
1.1 Assessing the Money’s Worth of Life Annuities
Having found that many elderly people will have assets to spread over their retirement
period, the next question is how people can manage their portfolios to ensure old-age economic
security. One way to proceed is to simply divide available retirement wealth by one’s life
expectancy, a fractional consumption pattern known as “periodic withdrawal” sometimes found in
pension payout schemes. For example, Table 2 indicates that a 65-year old man could anticipate
problem is that were a retiree to divide his age-65 retirement wealth by the number of years
remaining to him at age 65, he would be exposed to substantial risk of exhausting his funds before
he died. Thus a 65-year old man who would anticipate dying at age 81 still faces a one-third
chance of living to age 85, and almost a 20% chance of surviving to age 90. For his female
counterpart whose expected age at death is age 85, there is almost a one-third chance of surviving
to age 90. Hence the periodic withdrawal approach is likely to leave retirees short of funds.
Clearly the periodic withdrawal approach does not insure a steady flow of retirement income until
death.
Table 2 here
One way to enhance retirement security is to purchase a life annuity that guarantees an
income stream until the insured’s death. Such a financial product provides the retiree with an
opportunity to insure against outliving his assets, in exchange for a premium paid to an insurer.
The insurer pools assets across those with similar longevity expectations but who then experience
different actual survival outcomes. In this way the life annuity provides income insurance to a
homogenous insured retiree population.
How valuable is a life annuity to the retiree? A financial answer to this question can be
ascertained by computing the expected present discounted value (EPDV) of the life income
benefits paid to annuitants, in relation to the annuity premium cost or purchase price. In the
literature this is known as the “money’s worth” of the life annuity. To illustrate the concept, we
may assume that the product under examination is an immediate single- life annuity that pays out
$A per period for life, in exchange for an initial purchase price (e.g. $100,000). The payout
the life of the annuity contract or it may be linked to some underlying real asset (which would then
generate a real rather than a nominal annuity).
In the case of a nominal annuity, we follow Mitchell, Poterba, Warshawsky and Brown
(1999: henceforth MPWB) in defining qa,t as the probability that an a- month-old individual who is
alive at the beginning of month t will die during that month. Future mortality experience is
expressed by letting Pj be the probability that someone who is 65 years old at the time when he
purchases an annuity survives for at least j months: 2
(1) Pj = (1−q780,1)*(1−q781,2)*...*(1−q780+j1,j).
(To compute the EPDV of an annuity purchased by a 65-year-old, we need to forecast this
individual's future mortality probabilities. This point is taken up in the next section.)
We denote the EPDV of a life annuity with monthly payout A purchased by an individual
of age b as Vb(A). This may depend on a term structure of interest rates, ik, expressing the
nominal short rate k periods into the future:
(2) ) i + (1 P * A = A V k j 1 = k j 600 1 = j b Π ∑ ) (
In most of our research, we use the term structure of yields on Treasury bonds to estimate the time
series of expected future nominal short-term interest rates,3 though we have also explored the
sensitivity of results to flat term structures, with the discount rate given variously by the ten-year
Treasury bond yield, the thirty-year Treasury bond yield, and the BAA corporate bond yield. In
addition we have evaluated the sensitivity of results to taxes, since in the US at least the federal
2
In practice our computations assume that no one lives beyond age 115 years; calculations are insensitive to this upper limit on lifespan.
3
Nominal yields on US Treasury bonds with fixed maturities of 1, 2, 3, 5, 7, 10, 20, and 30 years are used to estimate the term structure of expected short -term interest rates; the expected nominal short rate in each future period is computed as the nominal short rate that would satisfy the expectations theory of the term structure for the two adjacent long-term bonds.
tax treatment of annuities is quite complex, governed by specialized rules described in BMPW
(forthcoming).4
In the case of real annuities, equation (2) must be adapted to reflect the fact that the amount
of the payout is time-varying in nominal terms but fixed in real terms. As shown in BMP
(forthcoming), the simplest approach is to let Ar denote the real annual payout, and to replace the
nominal interest rates in the denominator of equation (2) with corresponding real interest rates rk.
Hence to compute the EPDV of a real annuity the equation becomes:
(3) ) r + (1 P * A = ) A ( V k j 1 = k j r b 115 1 = j r b Π ∑ − .
The “money’s worth” of an annuity may then be specified as the ratio of the EPDV of the
annuity’s payout stream to its purchase price. For a nominal annuity selling for $100,000, for
instance, the money’s worth may be expressed as Vb(An)/100,000. These money worth ratios have
proven useful in the literature, since they represent a currency-independent metric for comparing
annuities across different groups, over time, and across countries.
1.2 Equivalent Wealth Valuation: Measuring the Utility of Longevity Insurance
Before reporting money’s worth results for a range of countries and time periods, we note
that risk-averse consumers will value annuities more highly than the simple financial money’s
worth approach implies. This is because people derive utility from insurance protection per se. In
our research we develop a metric for evaluating how a risk-averse consumer might value an
annuity in utility terms, using the equivalent wealth concept (MPWB, 1999). Specifically, this
represents the amount of wealth that a consumer would need if he did not have access to an
4
Specifically the US tax authority specifies the expected number of years over which the annuitant can expect to receive benefits, T', based on the annuitant's age at the time payouts begin. Tax law then defines an inclusion ratio that determines the share of annuity payments in each period that must be included in the recipient's taxable income until T’; after that all annuity income is subject to tax. The inclusion ratio is designed to measure the fraction of each annuity payout that reflects the capital income on the accumulating value of the annuity premium.
annuity market, in order to achieve the same lifetime expected utility level that he could achieve
by using that wealth to purchase a nominal annuity.
As developed in MPWB (1999) and summarized in Brown and Warshawsky (2000), the
consumer is posited to maximize an expected utility function V by choosing an optimal
consumption path {Ct} from time 0 to time T (the maximum possible lifespan), given his rate of
time preference ρ and a vector of cumulative survival probabilities {Pt}:
{ }
( )
∑
= + T t t t t C C U P Max t 0 (1 ρ) . Thebudget constraint facing the individual depends on whether he has access to a fair annuity market.
If not, the constraint is that the present va lue of future consumption, discounted using the riskless
interest rate r, must be equal to his initial wealth, W0:
(
)
∑
= + = T t t t r C W 0 0 1 . If he could purchase anactuarially fair annuity, his budget constraint would become:
(
)
∑
= + = T t t t t r C P W 0 0 1 . The differencebetween the two budget constraints is due to survival probabilities: without an annuity, the
retiree’s actual present value of future consumption must not exceed his initial wealth, but with an
annuity, his expected present value of consumption cannot exceed his initial wealth. In other
words, an annuity reduces the relative price of future consumption.
Evaluating how much a consumer values access to an annuity requires the researcher to
assume a functional form for the utility function and to evaluate a range of risk-aversion
parameters. In much of our research we assume that the one-period utility function, U(Ct), exhibits
constant relative risk aversion:
( )
β β − = − 1 1 t t C C
U , where β is the Arrow-Pratt coefficient of relative risk aversion, and 1/β is the elasticity of intertemporal substitution in consumption. Using the indirect utility function V(.) corresponding to each budget constraint, we can then evaluate the
maximum utility that the individual could achieve by following the optimal consumption path as a
function of all parameters. Last, we can assess the consumer’s utility gain in dollar terms, by
computing how much additional wealth he would need if he lacked access to annuities, to make
him as well off as if he had annuities available. This is accomplished by finding α such that:
(
)
noannuities( )
annuitiesW V W
V0 α 0 = 0 0 . Here α is termed the “Annuity Equivalent Wealth ” and deriving it requires dynamic programming algorithms described in MPWB (1999) for the case of a single
individual, Brown and Poterba (2000) for the case of couples, and BMP (forthcoming) for the case
in which returns and/or inflation are uncertain.
2. Valuing Annuities in Practice
Moving from theory to practice, several types of data are required to value annuity
products. These include information on actual annuity premiums and payouts, and on current as
well as projected mortality risks. We investigate each of these in turn in this section.
2.1 Annuity Premiums and Payouts
To understand how annuity markets work, it is important to obtain data on actual payouts
for life annuities and the premiums charged for these annuity promises. Information on average
monthly nominal annuities for the US by sex over time appears in Table 3. Here we find, not
surprisingly, that men can expect to receive higher payouts than women because of their shorter
life expectancies conditional on purchase at age 65. The table also indicates that monthly payouts
appear to be falling in the US market over time.
Table 3 here
Evidence from other countries is supportive of these findings. Information for the UK
annuities. Patterns are as expected. Benefit payouts for younger people are, logically, lower than
for older people, due to the longer life expectancy for younger purchasers. Once again, payouts for
women are below those for men. Payouts for a nominal annuity purchased at age 65 are similar in
the UK and the US. The monthly payouts for the real benefit stream in the UK are lower than for
the nominal annuity, again with women receiving less than men. Average nominal payouts for
55-year olds in two other countries with good data, Singapore and Australia, appear in Table 5.
Tables 4 and 5 here 2.2 Mortality Processes5
To value an annuity payout for life, we must have data on the probability of the
purchaser’s survival into the future, yet it is not a simple matter to obtain projected mortality (or
life) tables. This is because a mortality table is typically derived by obtaining actual data on the
number of deaths by age and sex occurring in a given population over a specific period of time.
The probability qx that a group member of age x will die in the next year of life is then estimated
by either fitting a hazard model to the empirical distribution of deaths in the population, or by
applying a smoothing algorithm to the raw maximum likelihood estimates of qx. Then the
smoothed estimates of qx may be used to construct a complete mortality table. In the developed
world, mortality is extremely rare at most ages, so a large number of lives must be observed in
order to obtain reliable estimates.
A concern that arises in developing mortality projections for valuing annuities is that
mortality processes may be heterogeneous across subgroups of the population. For example
insurers worry about adverse selection, which arises when annuity purchasers are more likely than
average to live a long time in retirement. In this case, using mortality rates derived for the
population as a whole would seriously overstate mortality among annuitants. One factor that may
5
play a critical role in this context is the extent to which annuitization is optional or mandatory. For
example in the UK, occupational pension benefits must be partly annuitized on a mandatory basis,
so dedicated annuitant mortality tables exist in the UK for voluntary as well as compulsory
annuitant populations (Finkelstein and Poterba, 1999; Murthi et al, 1999). In the US, federal
Social Security payments are by law (real) life annuities, while defined benefit company pensions
are usually paid out as life annuities (though lump sum cashouts are becoming more popular in
recent years; cf Mitchell 1999). As a consequence, US mortality tables are available for group and
individual (retail) annuitants, as well as for the general population (BMP 2000).
Not only do mortality tables differ across population subgroups: they also change over
time. On the whole, mortality among older people has fallen steeply in developed countries over
the last century and this process seems likely to continue in the future. 6 The actuarial profession
therefore projects future mortality trends by estimating so-called period mortality tables from past
data, and then devising separate, forward-looking, cohort mortality tables by extrapolating trends
in mortality. Of course, anticipated future declines in mortality built into cohort tables are only
estimates and could be wildly in error; nevertheless, future mortality estimates are essential in
order to value annuity benefit flows for people alive today as they age into the future.
There is no single universally accepted method of comparing mortality tables across
subgroups and over time, though it is clear that selecting the “right” mortality table has a profound
effect on the value placed on a life annuity. One perspective is provided in Figure 1, illustrating
the distribution of expected age at death for US males conditional on surviving to age 65. The
graph clearly illustrates that the population curve has greater mortality at younger ages, with the
annuitant curve being shifted to the right. An obvious disadvantage of the graphical comparison is
6
that it does not provide a measure for “how far apart” the two tables might be and what financial
difference they would make in annuity valuation.
Figure 1 here: Distribution of Age at Death, US Male Pop vs Ann
Other ways to compare mortality over time and across different groups include the A/E
(“A over E”) and the IRR measures. The first, A/E, expresses the number of deaths expected in a
population with a given age structure using one table (“the benchmark”) and then compares that to
the expected number of deaths in a population of the same size in a second mortality table. When
presented as a ratio multiplied by 100, the measure is equivalent to a ratio of the weighted average
probabilities of death for the two mortality tables, using a specific population structure for the
weights. In recent research (Mitchell and McCarthy, 2001) we use as the base the US Male period
population table and compute the measure A/E = 100 * ×
∑
∑
x x x x x x q w q wwhere q*xis the probability that
an individual of age x dies according to the table in question, and qxis the probability that an
individual of age x dies according to the US Male period population table. The weights, wx, are
set so thatw65 = 100,000, and wx =wx−1(1−qx−1).
Alternatively one could view the mortality process as akin to a mathematical discount rate,
where if $1 of today’s money were to be divided in five years time between survivors of a group
of one million people alive today, each individual survivor’s share would grow over time with
mortality, just as it would with compound interest. To compare mortality tables in this
perspective, we may use one mortality table to solve for the internal rate of return (IRR) required
to equate the present value of a life annuity computed using a second mortality table (at some
∑
∑
+− ⋅ − ⋅ = +− ⋅− ⋅ = x x x x x x r x p q a p q a 65* * 65 65 % 5 | 65 1 65 65 % | 651 10.18079 where x−65p65 is the probability that an
individual alive at age 65 lives to at least age x according to the mortality table in question; qx is
the probability that an individual alive at age x dies before reaching age x+1; axr+%1−65| is the
present value at r percent per year of an annuity certain paid continuously for x-65+1/2 years; and
* * 65
65 x
x− p ⋅q is the probability that an individual alive at age 65 dies aged x according to US Male
population period mortality. This technique requires both a benchmark mortality table and an
interest rate. Our analysis uses as a benchmark the US Male population period table and an interest
rate of 5 percent per year, and solves for the interest rate required to equate the annuity in present
value with some other mortality table (Mitchell and McCarthy, 2001).
2.3 International Comparisons
Comparisons of US and UK mortality tables are given in Table 6, with results for
annuitants shown in the top panel and for the population as a whole in the bottom panel. Using
the A/E metric, annuity mortality proves to be 10-15% below the base population group, with
differences for men exceeding those for women. Also it is interesting to note that seemingly small
mortality differences translate into relatively large implied internal rates of return (IRRs). Hence
the figure of 6.55% associated with the US male annuitant cohort mortality table may be
compared to the 5% return assumed in valuing a $1 life annuity payable using the US male
population period table. In other words, the lower mortality for US male annuitants can be thought
of as using a discount rate 155 basis points above the 5 percent base rate. In the UK, where
mortality rates are higher for UK male compulsory annuitants, this is mathematically equivalent to
discounting with an interest rate 100 basis points above the benchmark. In other words, a US
59 basis points more for women, to provide the same payout as the UK compulsory annuity
product.
Table 6 here
3.Valuing Annuity Flows
Having in hand the requisite data on annuitant mortality and annuity payouts, we are now
in a position to provide information on the financial value – money’s worth – of annuity products,
along with their utility values for risk averse consumers.
3.1 Empirical Results on Money’s Worth
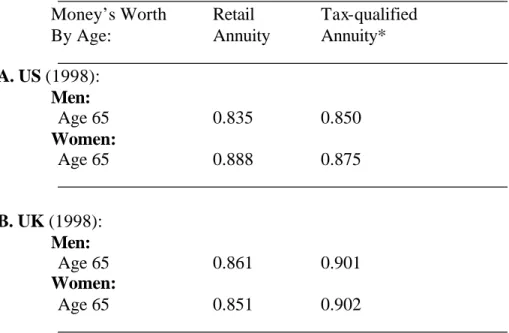
Table 7 summarizes findings on money’s worth ratios from a range of US and UK studies
on nominal annuity products that use population mortality tables. Panel A indicates that in
exchange for a $1 initial investment in a retail annuity product, the typical age-65 US male could
anticipate receiving a pretax value of $0.835 from a life annuity, with the value slightly higher in a
tax-qualified plan ($0.85). In other words, the “loading” implied by these figures amounts to
about 15 cents per dollar premium. Women’s longer life expectancies drive up their money’s
worth to around 89 cents on the dollar, so the loading implied is lower, at around 11 cents. These
US figures are comparable to those for the UK given in Panels B and C, where loadings again
stand at around 10-15 cents on the dollar.
Table 6 here
These results would not be precisely relevant for a consumer considering whether to
annuitize his retirement wealth voluntarily, since as demonstrated above, people buying annuitie s
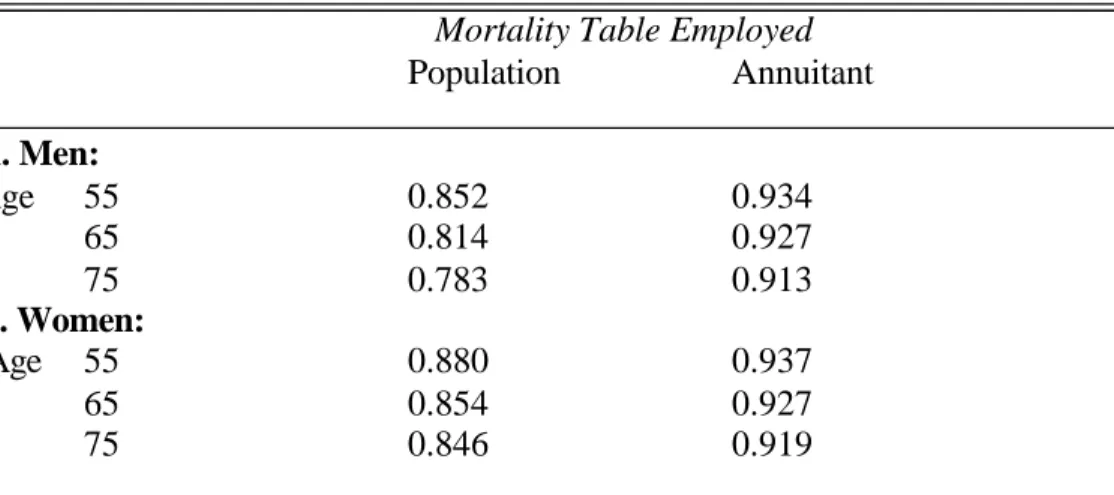
tend to live longer than average. This difference, termed adverse selection, is captured in Tables 8
tables. In the US case shown in Table 8, the male annuity purchaser could expect a benefit flow
some 7-13 percentage points higher than would someone in the population at large. In other
words, the insurance load drops from 10-15 cents on the dollar to 7-9 cents on the dollar after
correction for the differential survival rate of annuitants. Results for men and women are quite
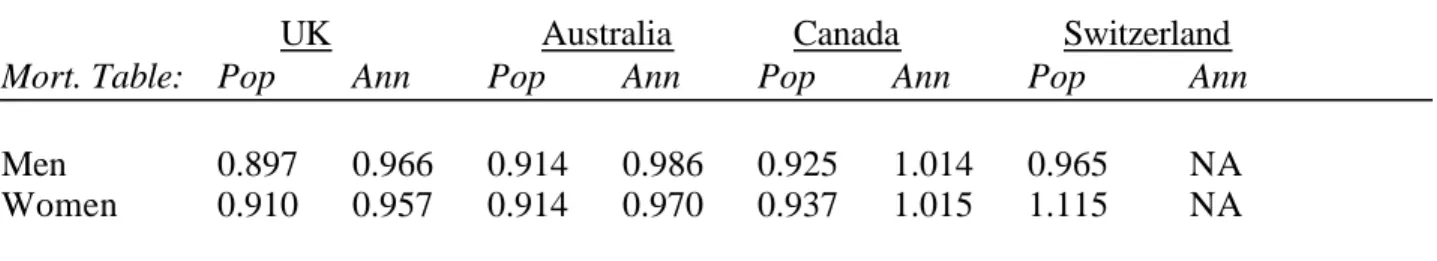
similar. Evidence for the UK, Australia, Canada, and Switzerland appears in Table 9, where once
again the loading implied with population mortality is much attenuated by using annuitant
mortality tables. Indeed these annuity products appear quite valuable for annuitant purchasers,
with estimated values close to and occasionally exceeding 1.0 in a few cases. In general, therefore,
a financial assessment of these life annuity products indicates that (a) adverse selection explains a
substantial portion of the load perceived by potential purchasers in the general population, and (b)
these products are rather valuable to annuitants, though in most cases their money’s worth is still
less than 1.0.
Tables 8 and 9 here
Thus far, the discussion has focused on nominal annuities, since they tend to be the
dominant form of annuities in much of the developed world. Yet real annuity products are on
offer in some countries, and it is useful to consider how to value them, since retirees presumably
seek to preserve not only nominal but real consumption levels over the retirement period. Inflation
is a concern in old age to the extent that even small inflation rates undermine real consumption
paths over time. Thus a 3.2% annual rate (the US average from 1926-97) could halve the real
value of a nominal annuity over 22 years. To some extent, annuity sellers can offset this concern
by means of graduated products that grow over time at some fixed rate. On the othe r hand,
inflation is a concern in retirement because of uncertainty in its realization. Hence it is important
product. Of course for risk-averse consumers, the impact of inflation uncertainty would be
expected to make real annuities even more attractive.
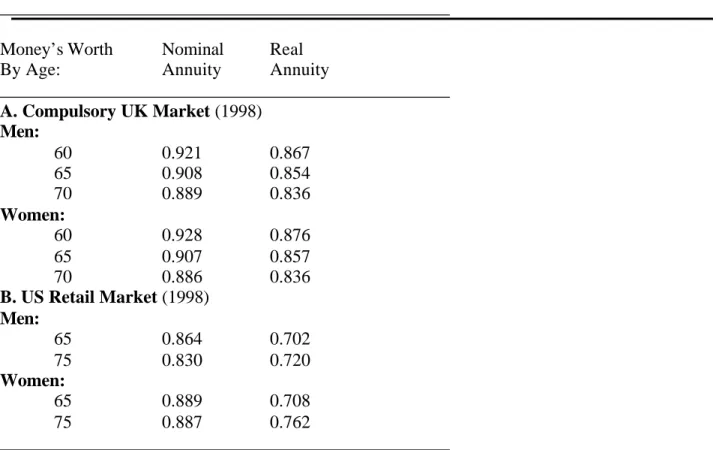
The results in Table 10 review results for real annuities on offer in the UK and the US,
where we see that the money’s worth of a real annuity is below that for a nominal annuity. In the
US there is only a single firm offering a real annuity, while in the UK many more insurers offer
real products. The fact that the UK discount associated with the real annuity is smaller, on the
order of 5 percentage points, suggest that a more active market in the products narrows price
differentials.
Table 10 here
The fact that there is any discount in the money’s worth of real versus nominal annuities
probably indicates that at the margin nonpurchasers are unwilling to pay extra to ensure a flat real
consumption stream during retirement.7 This finding may challenge a widely- held view that
pension participants should be required or encouraged to elect real life annuities in lieu of
programmed withdrawals.
Another way to think about annuity values assesses money’s worth ratios for particular
population subgroups having mortality experiences that differ from the average. Thus in the US,
for instance, blacks tend to have higher mortality probabilities than do whites, and hispanics are
more likely to live longer than average. Brown (1999) takes into account differential ethnic
mortality patterns, and his results are summarized in Table 11. He finds that US white and
hispanic women tend to be subsidized on average when the y purchase annuities, while US black
males receive less. In a related study, Finkelstein and Poterba (2000) find that annuity purchasers
who buy graduated products tend to live longer than those who buy flat nominal products.
7 Of course it might also indicate that nonpurchasers are constrained in some way from entering the market; this is not directly testable give our data.
Table 11 here
What these findings imply is that differential mortality expectations influence how people
value these life income products, and these different expectations, in turn, shape what types of
annuity products people buy when given a choice. Despite this, or sometimes because of this,
government policy often requires that a particular mortality table be used for purposes of pricing
life payouts, to limit perceived adverse selection and/or discrimination against members of
particular groups. This is the case in the UK, for exa mple, where unisex mortality tables (using a
blend of male and female rates) must be used for pricing pension annuities,8 and in the US where
annuity taxation requires that unisex tables be used to assess the taxable portion of the benefit
(BMPW, 1999). As a result, government policy toward mortality tables in annuity pricing tends to
generate a degree of cross-subsidization, if the product purchase is mandatory, and exacerbates
adverse selection, if the product purchase is voluntary.
3.2 Equivalent Wealth Computations
Above we argued that risk-averse consumers may value annuities more highly than the
simple financial money’s worth approach implies since people would be expected to derive utility
from insurance protection per se. Is this section we report results on the annuity equivalent
wealth values, which represent how much wealth a consumer would need, if he did not have
access to an annuity market, to achieve the same lifetime expected utility level that he could
achieve if he used that wealth to purchase a nominal annuity.
In order to evaluate this measure, we must assume a particular form for the consumer’s
expected utility function and compare the utility value of full annuitization with no annuitization.
We conduct these evaluations using a range of risk aversion parameters since there is no clear
8
Strictly speaking unisex tables must be used in pricing only the “protected rights” component of the pension system; see Blake (1999).
guidance from the literature as to just how risk-averse consumers may be. We also acknowledge
that the value of a new life annuity depends on the existence of other types of life income streams.
This is relevant where an older consumer could anticipate receiving lifelong retirement benefits
from a company and/or governmental pension program, so the marginal utility of a new life
annuity would be expected to be less than for someone entirely lacking in access to any retirement
annuity.9
The results of our analysis appear in Table 12. What the table shows is that annuity
equivalent wealth values prove to be quite substantial. Going down the first column, for instance,
a consumer with a logarithmic utility function (CRRA = 1) and no other pre-existing annuity
would assess the annuity equivalent wealth of a real life annuity at 1.502. What this means is that
this consumer would be indifferent between having $1 in a real lifetime annuity, and $1.50 in
non-annuitized wealth. At higher levels of risk aversion, the annuity equivalent wealth value rises to 2,
meaning that access to a real annuity is worth double the wealth that value invested in a nominal
annuity. In other words, annuities are valued more highly than in strictly money’s worth terms.
Table 12 here
Our results also indicate that a real annuity is worth more than a nominal annuity to the
risk-averse consumer. Thus with CRRA=1, the consumer would value the real annuity at 5-8 cents
more on the dollar as compared to a nominal annuity, whereas with CRRA=10, the gap is 40-60
cents. The effect differs with the inflation process, however, since the annuity equivalent wealth
for the consumer is 1.451 in the case of i.i.d. inflation, and 1.424 in the case of persistent inflation.
9
This calculation is carried out by first finding the maximum utility V* the consumer could attain when he can fully annuitized his wealth, and then re-computing the dynamic programming problem solving for utility V when annuities are not available. Then one can evaluate the additional wealth (i.e. ∆W) that would have to be given to the consumer to leave him at an equivalent level of utility: V(W*+ ∆W|no annuities) = V*, and the annuity equivalent wealth would then be α = ((W* + ∆W)/W*). For more discussion see Brown (2001). The calculations in Table 12 therefore
represent not the marginal value placed on the first dollar of an annuity, but the full utility value of annuitization (and hence would be expected to understate the marginal value of the first dollar of annuitization).
Not surprisingly the real annuity is more highly valued when the inflation process is more
persistent.
It is interesting that the monotonic relationship between annuity equivalent wealth and risk
aversion does not hold for nominal annuities in the presence of uncertain inflation. This is
because risk aversion works in opposing directions in the face of inflation uncertainty. On the one
hand, higher risk aversion makes the consumer value an annuitized payout more highly since he
avoids the risk of outliving his resources, and this is all that matters in the case of the real annuity.
On the other hand, a risk-averse consumer dislikes the uncertainty introduced into the nominal
annuity stream by stochastic inflation. Increased variability in the real value of the nominal
annuity payouts reduces utility, and this effect is larger for those with the highest degree of risk
aversion. At low levels of risk aversion, the first effect dominates, and the annuity equivalent
wealth for a nominal annuity rises with risk aversion. For example, moving from CRRA=1 to
CRRA=2, the annuity equivalent wealth increases from 1.451 to 1.553 in the i.i.d. inflation case,
and from 1.424 to 1.501 in the persistent inflation case. However, as risk aversion rises, the
second effect becomes stronger, and the annuity equivalent wealth begins to decrease with risk
aversion (BMP forthcoming).
Our results are also informative regarding how consumers might value annuities if some
substantial portion of their retirement assets were already annuitized. In the extension of our
model, we posit that half of retiree wealth is annuitized. This seems reasonable in view of the
finding that the median US older household holds about this fraction of its retirement resources in
the form of expected future Social Security benefits, and these are payable only as a real life
annuity (Moore and Mitchell 2000). In this case, a consumer who is already half annuitized still
relatively non-risk-averse half-annuitized consumer (CRRA=1) is indifferent between $1 in a real
annuity and $1.33 in non-annuitized wealth. In other words he would require only a 33%
increment to his wealth to be made as well off as if he had a real annuity, compared to 50% in the
case where he lacked an annuity altogether. Clearly having a pre-existing real annuity affords the
consumer insurance against very low consumption values and drives down the value of additional
privately-purchased annuities.
If the annuity on offer were nominal instead of real and inflation followed an i.i.d. process,
the results prove to be similar. More striking is the result with persistent inflationary process,
since at high levels of risk aversion, having a real pre-existing annuity provides insurance against
very low consumption. Here the utility cost of having persistent high inflation eat into the nominal
annuity is lower, so his willingness to buy the nominal annuity would be greater.
Because many investors seem to believe that equity- linked variable annuities are superior
to traditional nominal annuities, we have also compared annuity equivalent wealth measures for
these products. In the US the variable annuity has been around since the 1950’s, initiated by the
TIAA-CREF and VALIC companies (Brown 2000). In the UK, “unit- linked” or “with-profit”
annuities appear to be more recent entrants on the insurance scene (Blake 1999).
In terms of the retiree’s perception, a higher expected mean return on a variable annuity
product might make it more appealing, though the greater risk could provide an offset. To assess
this tradeoff, we must model the mean return associated with portfolios of risky securities and the
variability of returns around this mean. Accordingly, we have developed an indexed portfolio of
common stocks using two alternative assumptions on the mean real return on equities: 6% real
(i.e., a 3 percent premium over the indexed bond return), and 9% real. (Both assume an equity
also assume the standard deviation of real returns on equities equals its historical average value of
20.9 percent per year.10 We compare these with fixed real retirement annuities in Table 13.
Table 13 here
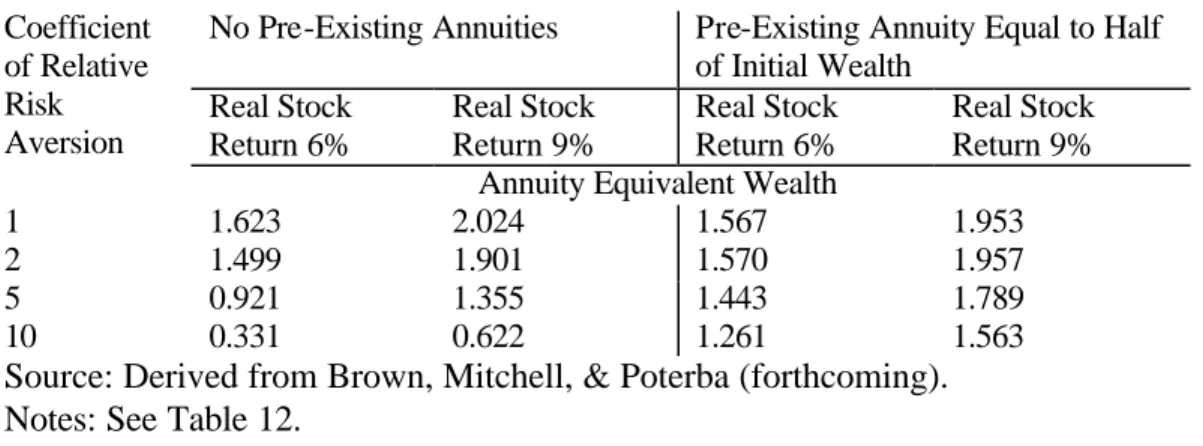
We give results with and without pre-existing annuitization. When real returns on equities
average 6%, the consumer having logarithmic utility would value equity- linked variable payout
annuities more highly than real annuities. Without a pre-existing annuity, his annuity equivalent
wealth from accessing a variable annuity is $1.62, larger than that for the real annuity previously
described ($1.50). On the other hand, more risk-averse people who might have placed all their
wealth in a variable annuity would be worse off than not annuitizing at all. This can be seen by
annuity equivalent wealth values below unity.
These findings imply that one segment of the older population might favor a variable
annuity linking payouts to equity returns in retirement, rather than a real annuity. The higher
anticipated returns from the variable annuity would compensate these consumers for (some of) the
inflation risk borne. But more risk-averse retirees would still be expected to prefer a fixed life
annuity over a variable product (and a real product over a nominal one).
4. Can Annuity Market Performance Be Enhanced?
Our analysis thus far indicates that annuities deserve an important role in many retiree
portfolios. This is particularly evident if government-based social security benefits cannot be
relied on to support a major portion of old-age consumption. Nevertheless, people might value
annuities less than our models imply for several reasons.
10
For further elaboration of the estimating procedure see BMP (2000) and BMPW (forthcoming). Real equity returns are assumed independent over time.
One explana tion for under-purchase of annuities is that they may be seen as “too
expensive.” As we have shown, however, adverse selection is rather small in the insurance
markets examined. It is true that insurers levy charges to cover administrative costs and insurer
reserves, contributing to the perception that these products are costly. Yet our analysis indicates
that in the US and UK at least, these charges are relatively low and appear to be falling over time.
As a result, the types of loads currently charged by insurers would not be expected to offset the
substantial utility values associated with insurance against longevity risk. Yet as new markets for
annuities develop in Europe and Asia, it will be important to pay close attention to loads and
adverse selection to ensure that these do not discourage market growth unnecessarily.
Public policy can also play a key role in structuring the way in which these markets
develop. In the UK and Sweden, for instance, unisex mortality tables must be used to compute
pension payouts (for those benefits provided under the “protected rights” legislation). In this
instance, expected mortality differences between men and women may not be used to price retiree
payouts differentially. While this produces cross-subsidization between male and female retirees
on average, it also restricts the amount of adverse selection that occurs at the annuitization stage.
In the US, while unisex tables are required for employer pension calculations, they are not
imposed on individual annuitants purchasing their life payouts on the retail market. Furthermore,
many pension-covered workers are permitted to take a lump sum cashout from the employer
pension at retirement. As a result, an informed and rational consumer anticipating a shorter life
expectancy (e.g. a male retiree) has an economic incentive to cash out his employer pension rather
than take it as a life annuity stream, in order to avoid remaining in the (increasingly female) group
mortality pool. In this sense pension and insurance regulations can powerfully affect the appeal of
Another factor shaping the demand for annuities is retiree interest in maintaining financial
liquidity in old age. Having relatively large amounts of cash on hand is deemed especially
important in countries such as the US where nursing home benefits are not provided by the
government as a matter of course. With over one-quarter of the 65+ population needing long-term
care at some point and nursing home fees exceeding $50,000 per year, it is not surprising that
older Americans would want to keep a portion of their assets liquid instead of annuitizing all their
wealth. In response, some insurers have begun to devise new financial products that will integrate
a life annuity with nursing home insurance for the elderly (Warshawsky, Spillman and Murtaugh,
forthcoming). The demand for cash in old age is also generating some interest in reverse annuity
mortgages, financial contracts that allow an older person to obtain an annuity by pledging the net
equity in his home (Caplin, forthcoming). Of course, such products have been a “hard sell” since
the owner-occupied home is often used as a tax-preferred vehicle for bequests.11
Above we argued that sensible regulation and supervision can strengthen the development
of annuity markets. Conversely, institutional and regulatory problems have sometimes impeded
their growth (Bodie, Hammond and Mitchell, forthcoming). For example, in the developing
country arena, insurers are frequently poorly supervised and regulated, so retirees may not view
them as reliable institutions for old-age assets (Mitchell 2000a). In the developed world,
regulation varies across countries (e.g. within Europe) and by state (in the US) regarding reserve
and reporting requirements, investment restrictions, guaranty fund programs, and tax policy. This
makes it difficult for investors and annuity consumers to evaluate insurance competitiveness
across national boundaries (cf Lemaire, 1997).
11
Among economists there is little agreement over how to model bequests (Gale and Slemrod, forthcoming), so it is not clear precisely how the bequest motive should be incorporated into a model of the demand for annuities. Brown (2001) argues that most specifications imply that full annuitization is no longer optimal. To the extent that some people may be over-annuitized (e.g. through Social Security), purchase of life insurance may be beneficial. Further mandatory annuitization acts like a tax on such persons.
Another area where policymakers can fundamentally influence annuity market functioning
is in the intersection between public and private old-age programs. For example Doyle, Mitchell
and Piggott (2001) devise annuity loadings for Australia and Singapore and find adverse selection
far stronger in Australia. This difference is attributed, in part, to the existence of a means-tested
and quite generous old-age safety net in Australia, while no minimum consumption is guaranteed
in Singapore. In other words, the extent to which people seek to annuitize retirement
accumulations from defined contribution plans will be influenced by guarantees offered by the
public sector.
When enumerating possible obstacles to annuity markets, the discussion would be
incomplete without recognizing that older people might be laboring under some misinformation
regarding the relative advantage of annuity investments versus other financial products. For one
thing, people might underestimate their longevity prospects which would lead them to undervalue
protection against longevity. In fact however, survey evidence suggests that older people are quite
well- informed about their survival probabilities, and their expected survival patterns track
actuarial tables quite closely (Hurd and McGarry, 1995). Of course there remains the problem of
cohort mortality risk: that is, if an entire cohort lives longer than anticipated by those selling the
products, insuring firms would experience excess costs. Some have argued that this problem can
best be resolved by having governments issue “survivor bonds” inasmuch as private insurers have
no financial mechanism adequate to diversity this type of risk (Blake, Burrows, and Orszag,
forthcoming). A similar argument was made by financial experts and economists seeking to
encourage the US government to issue inflation- linked bonds (Brynjolfosson and Fabozzi, 1999).
Retiree demand for these products in the US has been modest but of course inflation has been very
become a mandatory component of the retiree portfolio and demand for these assets has been more
substantial.
A final factor driving the size and development of annuity markets is how people feel
about alternative investments. Retirees may believe that they can manage their money better than
do institutional investors, a perspective that may have contributed to what the British have called
pension “misselling.” Here participants in company-based defined benefit plans switched their DB
accruals into individual-account defined contribution plans at the behest of insurers and other
financial advisers, and in some cases this switch proved financially deleterious (Ward, 1996). At
issue and still not unsettled in this arena is how well those who switched plans understood what
the switch meant, including their foregone defined benefit plan accrual and differences in how
longevity risk was handled in the two environments.
Due to adverse selection in annuity markets, as well as participant inability to make
informed decisions on retirement decumulation, some policymakers have argued that all pension
participants should be required to annuitize at least a portion of their assets at retirement.12 For
this reason it is of interest to examine the case of Chile, which more than two decades ago closed
down its traditional national pay-as-you- go defined benefit program in favor of a mandatory
defined contribution individual accounts system. As such, Chile is providing an interesting
test-case for those seeking to design better old-age retirement programs. Of particular interest in the
present context is the way in which the retirement asset decumulation process is working, now that
the Chilean system has been in place long enough to have people reaching retirement age with a
reasonably long working career under the new program. Thus far, early retirees and disabled
persons constitute the bulk of the retired population: only 38% of program affiliates in payment
12
For example several members of the 1994-6 Social Security Advisory Council in the US urged mandating annuities if a portion of the national Social Security system were to be privatized; see http://www.ssa.gov.
status left work via regular retirement, while 45% were early retirees and 17% were on disability
(Diaz and Edwards 1999). Of most interest, however, are the payout patterns. With over a decade
of data available, it appears that a minority -- 40% -- of Chilean bene ficiaries have elected a life
annuity, while 60% opted for the “programmed withdrawal” or graduated payment approach that
does not guarantee benefits for life (see Figure 2). While the fraction of recipients electing life
annuities has grown over time, the se are mostly early rather than normal retirees. Whether and
how annuity pricing policy under the Chilean system and other national, mandatory, defined
contribution pension programs influences these outcomes are a subject deserving of further study.
Figure 2 here
5. Final Thoughts
This overview of annuity market functioning suggests several lessons. One is that annuity
products have an important role to play in helping people manage their assets into retirement. Risk
averse individuals will value annuities at well above their purchase price. We also find that that
adverse selection is not large and insurance loadings have been falling over time, in countries
where we have had adequate data to measure these. Last, there is a wide range of annuity
products that can enhance retirement security. Here we emphasize the role of inflation-indexed
annuities and related products protecting real consumption streams into very old age.
Without a doubt, many developed and developing nations will face the need to restructure
their retirement systems in the next two decades: Germany has already made some progress in this
vein, Greece is confronting political pressures around this topic, and the US has announced a new
effort to examine individual accounts. During this reform process, it will be critical to devote
security during a long retirement period requires more attention to the long-term consequences of
regulatory, financial, and social insurance programs than has heretofore been noted by most
reformers. Additional study would be helpful on the risks affecting retiree consumption and how
people can make better- informed decisions about decumulating assets in retirement. New
financial products to help retirees draw down their lifetime savings more sensibly would be
References
Blake, David. 1999. “Annuity Markets: Problems and Solutions”. The Geneva Papers on Risk and Insurance. July: 359-375.
Blake, David, William Burrows, and J. Michael Orszag. Forthcoming. “Survivor Bonds and Compulsory Annuitization: Helping Reduce the Cost of Pension Provision.” In Zvi Bodie, Brett Hammond, and Olivia S. Mitchell, eds. Innovations in Financing Retirement. Pension Research Council. Philadelphia, PA: University of Pennsylvania Press. Bodie, Zvi, Brett Hammond, and Olivia S. Mitchell, Editors. Forthcoming. Innovations in
Financing Retirement. Pension Research Council. Philadelphia, PA: University of Pennsylvania Press.
Brynjolfsson, John B. and Frank J. Fabozzi, Editors. 1999. The Handbook of Inflation-Indexed Bonds. F.J. Fabozzi Associates. New Hope, PA.
Brown, Jeffrey. 2000. “How Should We Insure Longevity Risk in Pensions and Social Security?” Issue in Brief, Center for Retirement Research, Boston College, Boston, MA.
Brown, Jeffrey. 2001. “Redistribution and Insurance: Mandatory Annuitization with Mortality Heterogeneity”, JFK School, Harvard, Cambridge, MA.
Brown, Jeffrey, Olivia S. Mitchell, and James Poterba. 2000 [BMP2000].. “The Role of Real Annuities and Indexed Bonds in an Individual Accounts Retirement Program.” In Risk Aspects of Investment-Based Social Security Reform. Ed. John Y. Campbell and Martin Feldstein. NBER: University of Chicago Press: 321-360.
Brown, Jeffrey, Olivia S. Mitchell, and James Poterba. Forthcoming [BMP forthcoming].
“Mortality Risk, Inflation Risk, and Annuity Products.” In Zvi Bodie, Brett Hammond, and Olivia S. Mitchell, eds. Innovations in Financing Retirement. Pension Research Council. Philadelphia, PA: University of Pennsylvania Press.
Brown, Jeffrey, Olivia S. Mitchell, James Poterba, and Mark Warshawsky. Forthcoming [BMPW forthcoming]. The Role of Annuity Markets in Financing Retirement. MIT Press.
Brown, Jeffrey, Olivia S. Mitchell, James Poterba, and Mark Warshawsky. 1999. “Taxing
Retirement Retirement Income: Nonqualified Annuities and Distributions from Qualified Accounts”. National Tax Journal. LII,3, September: 563-592.
Brown, Jeffrey R. and James M. Poterba. “Joint Life Annuities and Annuity Demand by Married Couples.” NBER Working Paper No. 7199, June 1999.
Brown, Jeffrey R. and Mark J. Warshawsky. 2000. “Longevity-Insured Retirement Distributions from Pension Plans: Market and Regulatory Issues”. Working paper prepared for the Brookings/SIEPR/TIAA-CREF Institute Conference on Public Policies and Private Pensions. Washington, D.C: September 21-22.
Caplin, Andrew. Forthcoming. “Turning Assets into Cash Problems and Prospects in the Reverse Mortgage Market.” In Zvi Bodie, Brett Hammond, and Olivia S. Mitchell, eds.
Innovations in Financing Retirement. Pension Research Council. Philadelphia, PA: University of Pennsylvania Press.
Diaz, Antonio, and Sebastian Edwards. 1999. “Benefits of the Social Security System: Critical Examination and Proposals”. Paper presented at the Pensions Conference, Santiago, Chile, August.
Disney, Richard. 2000. “Crises in Public Pension Programmes in OECD: What are the Reform Options?” Economic Journal 110, 461: F1-F41.
Disney, Richard and Paul Johnson. 2000. “Pension Systems and Retirement Incomes Across OECD Countries”. Institute for Fiscal Studies Working Paper. London.
Doyle, Suzanne, Olivia S. Mitchell, and John Piggott. 2001. “Annuity Values in Defined
Contribution Retirement Systems: The Case of Singapore and Australia”. NBER Working Paper No. W8091.
European Commission, 1997. Supplementary Pensions in the Single Market: A Green Paper.
http://europa.eu.int/comm/internal_market/eu/finances/pensions/gppensen.pdf Feldstein, Martin and Elena Rangue lova. 2000. “Accumulated Pension Collars: A Market
Approach to Reducing the Risk of Investment-Based Social Security Reform. ” NBER Working Paper No. W7861. August. Finkelstein, Amy and James Poterba. 2000. “ Finkelstein, Amy and James Poterba. 2000. “Adverse Selection in Insurance Markets:
Policyholder Evidence from the U.K. Annuity Market”. NBER Working Paper No. W8045.
Gale, William G. and Joel B. Slemrod. Forthcoming. “Rethinking the Estate and Gift Tax: Overview”. In Rethinking Estate and Gift Taxation. Eds. William Gale, James Hines and Joel Slemrod. Washington, D.C: Brookings.
Hurd, Michael D. Kathleen McGarry. 1995. “Evaluation of Subjective Probability Distributions in the HRS.” Journal of Human Resources. 30(0), S268-92.
James, Estelle and Dimitri Vittas. 1999. “Annuities Markets in Comparative Perspective”. Presented at the World Bank Conference on New Ideas About Old Age Security, Washington, D.C.
Jennings, Robert M., and Andrew P. Trout. 1982. The Tontine: From the Reign of Louis XIV to the French Revolutionary Era. Huebner Foundation Monograph Number 12.Wharton School, University of Pennsylvania. Philadelphia, PA.
Lemaire, Jean with the assistance of Krupa Subramanian. 1997. Insurance Regulation in Europe and the United States. Huebner Foundatio n Monograph Number 16. Wharton School, University of Pennsylvania. Philadelphia, PA.
Mitchell, Olivia S. 2000(a). “Building an Environment for Pension Reform in Developing Countries”. In Foundations of Pension Finance. Eds. Zvi Bodie and E Phillip Davis. London: Edward Elgar: 480-503.
Mitchell, Olivia S. 2000(b). “Developments in Pensions”. Handbook of Insurance. Ed. Georges Dionne. Kluwer Academic Publishers, Boston:873-899.
Mitchell, Olivia S. 1999. “New Trends in Pension Benefit and Retirement Provisions.” NBER Working Paper No. W7381.
Mitchell, Olivia S. and Flavio Barreto. 1997. “After Chile, What? Second-Round Social Security Reforms in Latin America”. Revista de Analisis Economico, 12(2) November 1997: 3-36. Mitchell, Olivia S. Brett Hammond, and Anna Rappaport. 2000. Forecasting Retirement Needs
and Retirement Wealth. Pension Research Council. Philadelphia, PA: University of Pennsylvania Press.
Mitchell, Olivia S. and McCarthy, David. 2001. “Estimating International Adverse Selection in Annuities”. Pension Research Council Working Paper. Wharton School. Philadelphia, PA: University of Pennsylvania.
Mitchell, Olivia S., James Poterba, Mark Warshawsky, Jeffrey Brown [MPWB]. 1999. “New Evidence on the Money’s Worth of Individual Annuities”. American Economic Review. December: 1299-1318.
Moore, James and Olivia S. Mitchell. 2000. “Projected Retirement Wealth and Saving Adequacy”. In Forecasting Retirement Needs and Retirement Wealth. Eds. O.S. Mitchell, B.
Hammond, and A. Rappaport. Pension Research Council. Philadelphia, PA: University of Pennsylvania Press: 68-94.
Murthi, Mamta, Michael Orszag, and Peter Orszag. “The Value for Money of Annuities in the UK”. Economics Department Working Paper, Birkbeck College. August 1999.
Poterba, James M. and Mark J. Warshawsky. 1999. “The Costs of Annuitizing Retirement Payouts from Individual Accounts. NBER WP 6918.
Ward, Peter. 1996. The Great British Pensions Robbery. Waterfall Books, 2nd ed. Lancashire, UK.
Warshawsky, Mark J., Brenda Spillman and Chris Murtaugh. Forthcoming. “Integrating the Life Annuity and Long-term Care Insurance: Theory, Evidence, Practice, and Policy” In Zvi Bodie, Brett Hammond, and Olivia S. Mitchell, eds. Innovations in Financing Retirement. Pension Research Council. Philadelphia, PA: University of Pennsylvania Press.
Table 1. Components of Household Wealth on the Verge of Retirement: US Health and Retirement Study ($1992)
Projected Projected Wealth Current Wealth at Wealth at
Decile Wealth Age 62 Age 65
Mean $478,313 $566,431 $625,066 -Housing 65,940 76,410 80,507 -Financial 175,974 205,653 228,133 -Social Security 119,793 128,712 142,018 -Pension 116,606 155,656 174,408 Median 10% $325,157 $382,678 $420,537 -Housing 59,746 71,097 75,047 -Financial 66,530 71,004 71,175 -Social Security 133,606 143,864 160,824 -Pension 65,275 96,713 113,491
Source: Moore and Mitchell (2000).
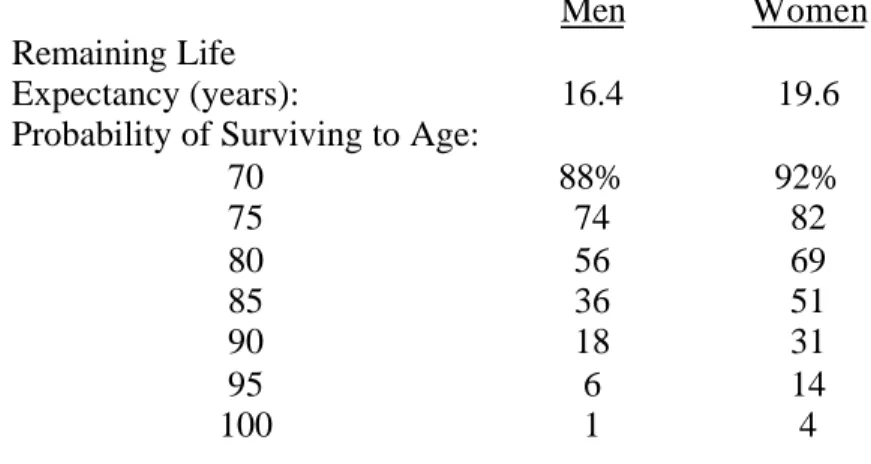
Table 2: Remaining Life Expectancy and Probabilities of Survival to Selected Ages for 65-Year Old Men and Women in the 65-Year 2000
Men Women
Remaining Life
Expectancy (years): 16.4 19.6
Probability of Surviving to Age:
70 88% 92% 75 74 82 80 56 69 85 36 51 90 18 31 95 6 14 100 1 4 Source: Brown (2000)
Table 3: Average Nominal Monthly Annuity Payouts on Single-Premium Immediate Annuities Offered to 65-Year Old Men & Women: US Individual (Retail) Market 1995-1999
Best’s Survey Annuity Shopper
1995 1996 1997 1998 1998 1999
Men $7.94 $7.62 $7.72 $7.33 $7.32 $7.35
Women 7.17 6.86 7.00 6.62 6.59 6.67
Source: Derived from Brown, Mitchell and Poterba (forthcoming). Each entry indicates the monthly income per $1,000 based on the purchase of a $100,000 single premium immediate life annuity policy.
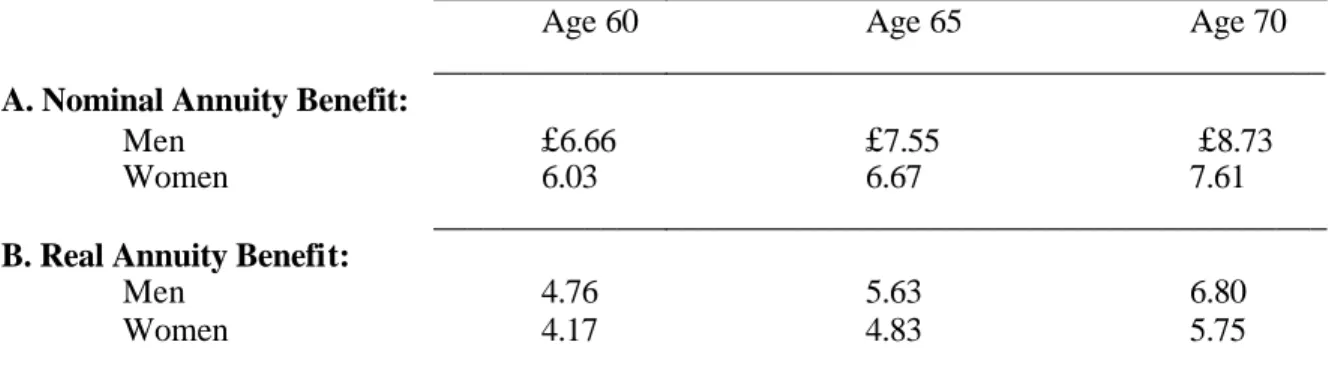
Table 4. Average Real and Nominal Monthly Annuity Payouts on Single -Premium Immediate Annuities Offered to Men and Women, by Age: UKCompulsory Pension Market 1998
______________________________________________________
Age 60 Age 65 Age 70
______________________________________________________
A. Nominal Annuity Benefit:
Men £6.66 £7.55 £8.73
Women 6.03 6.67 7.61
______________________________________________________
B. Real Annuity Benefit:
Men 4.76 5.63 6.80
Women 4.17 4.83 5.75
______________________________________________________
Source: Derived from Brown, Mitchell and Poterba (2000). Each entry indicates the monthly income per £1,000 premium, based on the purchase of a per £100,000single premium immediate life annuity policy. All annuity products analyzed provide a 5-year guarantee period.
T. 5: Average Nominal Monthly Annuity Payouts on Single-Premium Immediate Annuities Offered to Men and Women at age 55: Singapore and Australia 2000
Australia Singapore
Men $8.46 $7.98
Women 7.94 7.09
Source: Derived from Doyle, Mitchell and Piggott (2001). Assumed nominal interest rate 5 percent in Singapore and 6.96 percent in Australia, consistent with historical trend. Each entry indicates the monthly income per $1,000 premium, based on the purchase of a per $100,000single premium immediate life annuity policy. Values given in local currencies.
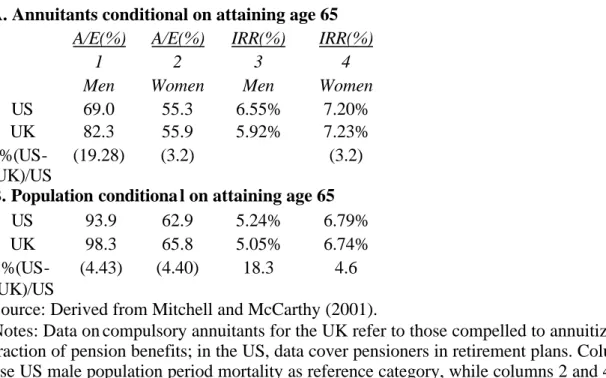
Table 6: Comparing Mortality Patterns Across Countries: Cohort Results for the US & the UK
A. Annuitants conditional on attaining age 65 A/E(%) A/E(%) IRR(%) IRR(%)
1 2 3 4
Men Women Men Women
US 69.0 55.3 6.55% 7.20%
UK 82.3 55.9 5.92% 7.23%
%(US-UK)/US
(19.28) (3.2) (3.2)
B. Population conditiona l on attaining age 65
US 93.9 62.9 5.24% 6.79%
UK 98.3 65.8 5.05% 6.74%
%(US-UK)/US
(4.43) (4.40) 18.3 4.6
Source: Derived from Mitchell and McCarthy (2001).
Notes: Data on compulsory annuitants for the UK refer to those compelled to annuitize a certain fraction of pension benefits; in the US, data cover pensioners in retirement plans. Columns 1 and 3 use US male population period mortality as reference category, while columns 2 and 4 assume a 5% return for base annuity.
Table 7: Money’s Worth of Nominal Annuity Payouts, Men age 65, UK and US (Using population mortality tables)
__________________________________________________ Money’s Worth Retail Tax-qualified
By Age: Annuity Annuity*
__________________________________________________ A. US (1998): Men: Age 65 0.835 0.850 Women: Age 65 0.888 0.875 __________________________________________________ B. UK (1998): Men: Age 65 0.861 0.901 Women: Age 65 0.851 0.902 __________________________________________________
Sources: Panel A: Poterba and Warshawsky (1999: T2). Panel B. Finklestein and Poterba (1999: 34-5). Panel C: Murthi, Orszag and Orszag (1999).
Notes: All results use Treasury interest rates and population mortality tables. *Refers to compulsory annuity purchase from UK personal pension accounts.
Table 8. Money’s Worth of US Nominal Annuity Payouts Using Population and Annuitant Mortality Tables, After-Tax Calculations (US 1995)
________________________________________________________________ Mortality Table Employed
Population Annuitant ________________________________________________________________ A. Men: Age 55 0.852 0.934 65 0.814 0.927 75 0.783 0.913 B. Women: Age 55 0.880 0.937 65 0.854 0.927 75 0.846 0.919 ________________________________________________________________ Source: Mitchell, Poterba, Warshawsky, and Brown (1999).
Table 9: Comparative Evidence on Money’s Worth of Nominal Annuity Payouts: Single Premium Nominal Life Annuities Offered to 65-Year Olds
UK Australia Canada Switzerland
Mort. Table: Pop Ann Pop Ann Pop Ann Pop Ann
Men 0.897 0.966 0.914 0.986 0.925 1.014 0.965 NA Women 0.910 0.957 0.914 0.970 0.937 1.015 1.115 NA
Table 10: Expected Discounted Values for Nominal and Real Annuities, UK and US
__________________________________________________
Money’s Worth Nominal Real
By Age: Annuity Annuity
__________________________________________________ A. Compulsory UK Market (1998) Men: 60 0.921 0.867 65 0.908 0.854 70 0.889 0.836 Women: 60 0.928 0.876 65 0.907 0.857 70 0.886 0.836 B. US Retail Market (1998) Men: 65 0.864 0.702 75 0.830 0.720 Women: 65 0.889 0.708 75 0.887 0.762 __________________________________________________
Source: Brown, Mitchell and Poterba (forthcoming) Computations use population mortality table and pretax benefits. Data from UK represent 14 companies; data from US from one company.