Inbound Traffic Engineering for Multihomed
ASes Using AS Path Prepending
Rocky K. C. Chang Department of Computing
The Hong Kong Polytechnic University Hung Hom, Kowloon
Hong Kong
Michael Lo
Information Technology Unit The Open University of Hong Kong Homantin, Kowloon
Hong Kong [email protected] Abstract
Unlike outbound traffic, incoming traffic distribution to a multi-homed AS is influenced mainly by the upstream ISPs’ routing policies. Currently, only a handful of mechanisms is available for such an AS to engineer the traffic volume coming into these links. In this paper, we concentrate on the problem of re-distributing the incoming traffic across the multiple links. We consider the approach of AS path prepending artificially inflates the length of the AS path to the network reported in BGP messages, with the hope of diverting some of the traffic from one incoming link to another. Although this approach has already been deployed by many ASes, they are often performed in a trial-and-error basis, and there also lacks a detailed measurement study on the effectiveness of this ap-proach. This paper attempts to fill these gaps. In particular, we have proposed a complete procedure based on the AS path prepending method to engineer incoming traffic accord-ing to some traffic control policy. The procedure includes passive measurements, active measurements, and traffic change prediction. We have deployed this approach to a non-commercial site and evaluated its effectiveness based on the measurements collected over six months. Similar measurement cycles can be replicated in other multihomed ASes by deploying the procedure and the associated software tools.
Keywords
BGP, inbound traffic engineering, AS path prepending, passive measurement, active mea-surement, traffic prediction
1.
Introduction
Many nontransit ISP networks, as well as enterprise networks today, have multiple physi-cal links connected to other ISP networks [3]. One common problem encountered in these networks is to distribute the inbound and outbound traffic over these inter-AS links in or-der to satisfy certain performance objectives. For example, operators may want to balance the inbound traffic in proportional to their capacities. In addition to the load balancing issue, a careful traffic distribution could also help engineer the traffic flowing within the domain. Owing to the current interdomain routing model, controlling the outbound traffic to particular destinations is quite straightforward, but the case for inbound traffic is not. Therefore, the focus of this paper is on the latter.
for multihomed ASes, i.e., multihoming to different ASes. There is currently only a hand-ful of mechanisms available to operators today to influence the inbound traffic distribution across the multiple links. After considering all the existing approaches, we have concluded that AS path prepending approach in BGP is both feasible and effective in re-distributing the inbound traffic. The approach artificially inflates the length of an AS path to the pre-fixes reported in BGP advertisements, with the hope of diverting some of the traffic from one incoming link to another.
Although the AS path prepending approach has already been deployed by many ASes, they are often performed in a trial-and-error basis. Moreover, there lacks a detailed mea-surement study on the effectiveness of this approach, except for some computer simulation studies [9]. This paper attempts to fill these gaps. Specifically, we have developed a com-plete and automated procedure based on passive measurements, active measurements, and traffic change prediction to compute how much AS path prepending is needed. We have deployed this procedure to a noncommercial site and evaluated its effectiveness based on the measurements collected over six months. The entire procedure with the associ-ated software tools can be easily replicassoci-ated in other multihomed ASes for the purpose of inbound traffic engineering.
The rest of this paper is organized as follows. Section 2 presents relevant background about BGP, and other approaches to the inbound traffic engineering problem. Section 3 presents a complete procedure to engineer inbound traffic based on AS path prepending. The passive and active measurement subsystems will also be presented there. Section 4 describes an algorithm for predicting traffic change with an additional AS prepending, and presents measurement results conducted from a noncommerical AS. Section 5 finally concludes this paper with a few current and future work.
2.
BGP and inbound traffic engineering
A BGP router selects the best route for a given destination prefix based on the path at-tributes attached to these route advertisements. The route selection is usually based a high-est LOCAL-PREF (local preference) value, a shorthigh-est AS path length, e-BGP routes over i-BGP routes, and others [11]. As the name indicates, the LOCAL-PREF path attributes are determined locally to prefer one path over another for a given prefix. Although there are available guidelines to set the LOCAL-PREF values, they are largely site dependent. Moreover, the LOCAL-PREF value is usually examined before other path attributes for path selection.
Although a multihomed AS generally cannot dictate which path the traffic will come into the AS, there are available a few mechanisms to influence the inbound traffic, as explained in the following.
2.1
Advertising routes to a single link
The first obvious solution is to divide a prefix into multiple longer prefixes, and then announce each prefix to a single link. As a result, an operator can control the types and volume of traffic coming into each link. However, the downside is that this technique does not provide any resilience to the AS, although the AS has multiple links to the Internet. Some vendor product, such as Cisco’s BGP Conditional Advertisement, allows a
pre-configuration of backup routes using other links. When the primary link is down, the router will advertise the backup routes to the Internet. However, the time for populating the new route may be very long—the convergence time for advertising new routes is around 30 minutes and that for withdrawing routes is around 5 minutes [5].
2.2
Advertising more specific routes
Another solution, which is closely related to the last one, is to announce more specific routes. More specific routes are always preferred over less specific ones during the route selection process. For example, consider an multihomed AS that announces the prefix 192.168.0.0/23 to two upstream ISPs A and B. If the AS wants to receive inbound traffic destined to 192.168.0.1/24 from ISP A only, the operator could inject the 192.168.0.1/24 route to ISP A, but not ISP B. Though effective, this approach should be discouraged, because too many unnecessary routes will be injected to the default free zone, causing the routing tables to grow quickly. In fact, BGP routers today are usually configured not to accept routes that exceed a certain prefix length (24 currently).
2.3
BGP attributes
There are mainly three BGP attributes that can be used to influence the inbound traffic. The multi-exit discriminator (MED) is a well-known, non-transitive BGP-4 attribute, but it cannot be used in the multihomed-to-different-AS scenarios. The BGP community at-tribute is an optional, transitive atat-tribute that allows a group of destinations that share some common attribute. The BGP community attributes can be used to group a number of prefixes together and share the same routing policy; however, they are still not ubiqui-tously deployed.
AS path prepending is another approach used in practice to influence the inbound traf-fic. The approach artificially inflates the AS path by including multiple of its own AS number. Since one common criterion for selecting inter-AS route is based on the shortest AS path length, a sufficient inflation of the AS path will change the routing path. It has been reported that over 30% of the routes has some amount of AS path prepending, and most of these paths are prepended with one or two ASes [10]. However, this approach suf-fers from two inter-related problems. First, determining how much prepending is needed is done in a rather ad hoc manner, and there lacks a systematic approach for an operator to tune this parameter. As a result of that, the AS path prepending method may end up overly effective. That is, too much traffic is redistributed from one link to another, and sometimes it may even congest the link.
2.4
NAT-based approaches
Another approach to engineering the inbound traffic is based on dynamic network ad-dress translation (NAT). The idea is to translate the source adad-dress in an outgoing packet, such as TCP SYN, to a multihomed NAT router’s external address, such that the returned traffic can be affixed to the corresponding link [8]. The main advantage of this approach is a quick deployment and indeed a number of commercial products are based on this approach. However, this approach suffers from the same problem as for the approach of advertising routes to a single link when there is a link failure. The solution usually
in-Passive measurement
Active
measurement AS path update
Select the top senders Effect the changes Traffic prediction Predict traffic changes Discover sensitivity to AS path length
Daily traffic rates
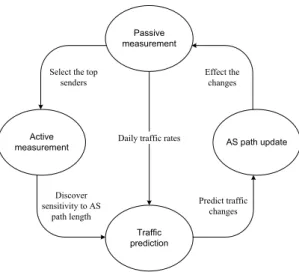
Figure 1: A complete cycle for an AS path prepending approach to inbound traffic engi-neering.
volves the use of dynamic domain name service that removes the corresponding DNS record upon detecting link failures. However, the DNS bindings stored in the DNS caches remain invalid for a period of time.
3.
An AS path prepending approach
In this paper, our proposed framework for inbound traffic engineering is based on the AS path prepending approach which has a number of advantages over the other approaches discussed in the last section. The prepending approach, first of all, does not increase the BGP table size nor compromise on the resilience. It has also been widely deployed and its effectiveness has already been demonstrated. Moreover, the prepending approach can be used together with the BGP community attribute to bring about an even better result [6].
The only shortcoming is that the whole procedure is done in an ac hoc manner. To address this issue, we propose a complete cycle for the prepending approach, as depicted in Fig. 1.
The passive measurement system, which records all inbound traffic flows from the Internet, serves two main purposes. The first one is to identify the long-term top traffic senders which represent the most stable senders for the AS under consideration. Most of the time, they are popular web sites, proxy servers, firewalls, and NAT boxes. To mini-mize disruption to the Internet, only top traffic senders will be considered in the active measurement system.
The main purpose of active measurement system is to discover the sensitivity of the top senders in terms of their routing paths to the AS under consideration when the advertised AS path length changes. A most effective way to achieving that is to send ICMP echo request to each top sender without AS prepending, and record the link that receives the
ISP 1
Netflow data export UDP Port 2056 Netflow data export
UDP Port 2055 Flow-fanout
UDP 4444 UDP 4445 UDP 9990 UDP 9991 Flow-tools data files
Data stream from router 1
Data stream from router 2
Generate data file every 5 mins
BGP router 1 BGP router 2
ISP 2
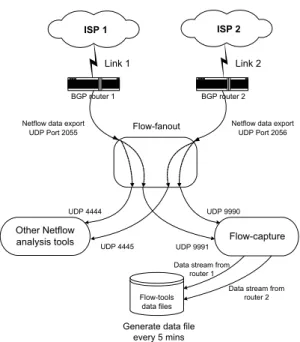
Figure 2: Netflow setup for the passive measurements.
ICMP echo reply. The experiments are repeated with different AS path lengths to observe which senders have changed their returned paths.
Finally, the traffic prediction system, based on the active measurement results and the short-term traffic from the passive measurements, predicts the changes in the traffic volume coming into the links. The predicted value can be used to ensure that the change would not be too overwhelming, such that the link receiving the shifted traffic will be con-gested. Of course, the predicted results will also be used to see whether the re-engineered traffic distribution over the links meet the intended objectives.
We will discuss the passive and active measurement systems next in this section and the traffic prediction system in the next section.
3.1
Passive measurement
Fig. 2 depicts the passive measurement setup for a noncommerical AS. The AS is multi-homed to two different ISPs via two separate Cisco routers with Netflow enabled. Netflow provides per-flow traffic characteristics, such as the start and end times of the flow, and the total amount of data [2]. Each flow can be specified by the IP addresses and ports of the sender and receiver, protocol type, and others. Compared with other packet-based traffic capturing tools, such as SNMP and RMON, the flow-based tool is sufficient for the purpose of our study. Moreover, the flow-based tool does not generate as much data and does not require specific hardware to run.
The Netflow data captured by the two routers are subject to further analysis and report-ing. We mainly use the Flow-tools for this purpose [4]. Flow-tools consists of a number of programs to collect, process, and analyze a large amount of Netflow data. First of all, the
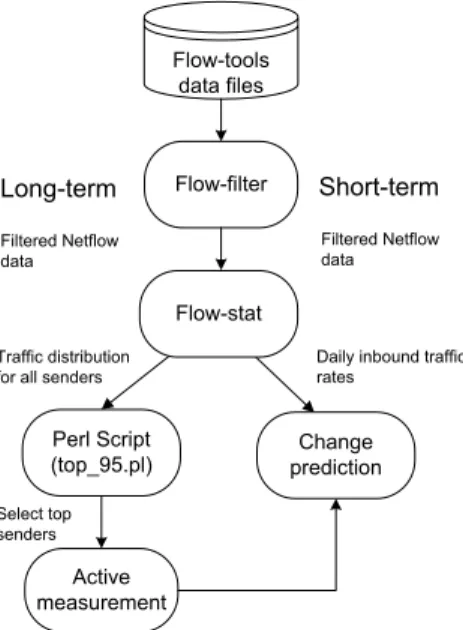
Figure 3: Long-term and short-term passive measurements.
Flow-fanout program “multicasts” the data to a specified set of receivers. Therefore, we can use different Netflow analysis tools to analyze the Netflow data at the same time. The right-side path in Fig. 2 shows that the Flow-capture program collects the received data and stored them in compressed data files every five minutes, amounting to around 80 to 150 MB data daily. The machine collecting the data is a 1.5GHz Pentium 4 PC, running Redhat Linux version 7.2 and mounted to a network attached storage through NFS.
Recall that one of the purposes of the passive measurement is to identify the top senders, so that we don’t have to consider all senders in the active measurement phase. The left-hand path in Fig. 3 shows that the data files written by Flow-capture are further analyzed using Flow-filter and Flow-stat programs for all senders. Then, we have written a Perl program to identify the top senders that contribute to a certain percentage of the total inbound traffic volume (we have used 95% and 99%).
We have collected the passive measurement data in the noncommercial AS between September 2002 to January 2003. In each month, the number of unique source IP ad-dresses ranges between 500,000 and 650,000. We rank the source IP adad-dresses in a de-creasing order of the traffic volume that they sent to the AS. Fig. 4 shows the graphs of the results obtained for each of the five months, and the total cumulative traffic volume is normalized to 100%. All five graphs are very similar to each other, in spite of some slight variations in the lower portions of the graphs. These results are quite consistent with the previous studies on the related issues, such as [7], [1]. That is, the distributions over the 5-month period are quite stable, and a relatively small number of senders are responsible for the majority of the traffic. Most of the top senders are popular Web sites and proxy servers, and some of them are located behind firewall systems. In our case, the first 100
10 20 30 40 50 60 70 80 90 100 101 102 103 104 105 106
Total Cum ulative Inbound Traffic V S S ender Order
Total Cum ulative Inbound traffic (% )
S end er O rde r Sep 02 Oc t 02 Nov 02 Dec 02 Jan 03
Figure 4: Total cumulative inbound traffic destined to the multihomed AS vs. the sender order.
senders contributed to around 40% to 50% of the total traffic. Moreover, there are no more than 110,000 senders responsible for 99% of the inbound traffic volume, which comprises around 15% of the total number of senders. If we relax the threshold to 95%, the number of top senders drops to around 25,000.
3.2
Active measurement
The purpose of the active measurement phase is to discover the upstream ISPs’ routing policies with respect to AS path length. The approach is to ping the top senders, and record the link that receives the ICMP echo reply. However, pinging all the top senders identified in the passive measurement phase may still be too intrusive to the normal In-ternet operation. Thus, we have further reduced the addresses by selecting only a single address based on a prefix length of 24. That is, if there are multiple top senders that share the same /24 prefix, we will ping only one of them. Clearly, the underlying assumption is that the packets sent from these addresses with the /24 prefix will subject to the same rout-ing policies. If that assumption is not correct, the route prediction results to be presented in the next section will be affected.
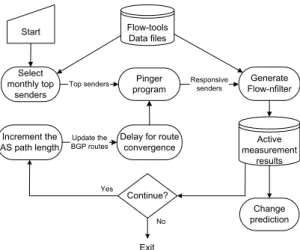
Fig. 5 sketches the main components in the active measurement system. First of all, the top senders are identified from the passive measurement and the target addresses are selected based on the /24 prefix as discussed before. The Pinger program, which is a Perl script, sends ICMP echo requests to these target addresses. The ICMP echo replies will be received by the two links and recorded by Netflow the same way as for other flows. Therefore, the Pinger program also creates Flow-nfilters that filter the echo replies and the incoming link (1 or 2) is also recorded, which, with other information, is written into the active measurement database. To see the effect of the AS path prepending, we perform the above with different numbers of prepending: 0 to 5. A prepending length of 5 should be sufficient, because, according to the previous studies, over 90% of active ASes are
Flow-tools Data files Generate Flow-nfilter Pinger program Top senders Increment the AS path length Select monthly top senders Active measurement results Continue? Yes No Change prediction Responsive senders
Delay for route convergence Update the
BGP routes
Exit Start
Figure 5: Data flow for active measurements.
located less than six AS hops away [1, 10]. Before starting another experiment with a new prepending value, it is important to wait for a sufficiently long period of time for the Internet to include the route with the new AS path vector. In our case, we have waited for at least one day between experiments.
We have performed the active measurements based on the passive measurement results obtained in the month of August, 2002 (these results are not included in Fig. 4). The total number of senders is 446,794, and the number of 99% top senders is 7,196. However, not all the senders respond to the echo requests, because the response modules are sometimes turned off for the prevention of denial-of-service attacks, such as ping to death. The total number of top senders that are responsive to ICMP is 4,770. After selecting the set of target addresses based on a prefix length of 24, the number is reduced to 2,746.
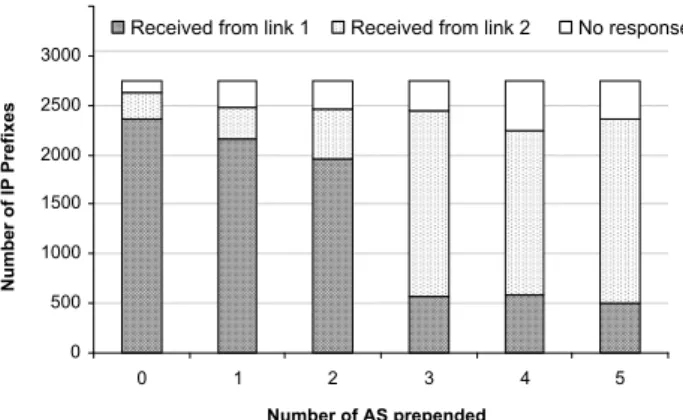
The active measurement results are presented in Fig. 6. Without prepending, almost 90% of the replies are received through link 1. The results thus reflect that almost all the upstream ISPs prefer paths to link 1 for this set of target addresses. Prepending the path by one or two ASes, as the figure shows, does not affect the results significantly—link 1 still receives at least 80% of the received replies—in spite of a noticeable downward trend. With an additional AS prepending, the situation completely reverses. Now link 1 receives only 23% of the replies. Further prependings do not seem to change the results obtained from the case of 3-AS prepending.
The dramatic change from 2 to 3 ASes perhaps is not too surprising, because the average AS hop distance of the Internet traffic is around 3 or less [1]. However, our mea-sured magnitude of the change may not always apply to other sites, which is certainly an interesting problem to pursue. Furthermore, it has been suggested that the manner of mul-tihoming may have an impact on the effect of AS path prepending [6]. For example, the effect may be more abrupt when the two multihomed ISPs are “similar” (e.g., two local ISPs). On the other hand, multihoming to two dissimilar ISPs, e.g., one local ISP and the other a tier-one ISP, may see a more gradual effect from the AS path prepending (see [6] for more details).
0 500 1000 1500 2000 2500 3000 0 1 2 3 4 5 Number of AS prepended Number of IP Prefixes
Received from link 1 Received from link 2 No responses
Figure 6: Distributions of the ICMP echo replies with AS prepending.
4.
Change prediction for AS path prepending
Before changing the AS path length, it is important to assess the impact of the change before announcing the new path vector. We have seen from the last section that a change from 2 to 3 ASes shifts a large number of flows from link 1 to link 2. Therefore, the shifts in the traffic volume as a result of the change may possibly congest the other link. Be-cause of that, we will present in this section an algorithm to predict the amount of shifted traffic. The algorithm is based on the passive and active measurement systems presented in the last section. With the predicted traffic change, we will then make the change and measure the actual changes. The accuracy of the prediction algorithm is measured by the difference between the actual measurements and the predicted values. Since the AS un-der consiun-deration is an operating network, we will conduct the above in a dialup network within the AS, which is one of the subnets within the network.
The traffic changes due to AS path prepending can be predicted only when several assumptions hold. The first one is that the set of top senders is quite stable, which has been confirmed from our passive measurements and other measurement studies, e.g., [7]. Second, the routing paths for the flows generated from the top senders are relatively stable. That is, the upstream ISPs’ routing policies affecting these traffic flows do not change often, at least on the weekly or even monthly basis. Third, the daily traffic rates into the dialup network are quite uniform without significant variations (there are exceptions, such as during denial-of-service attacks and flash crowds).
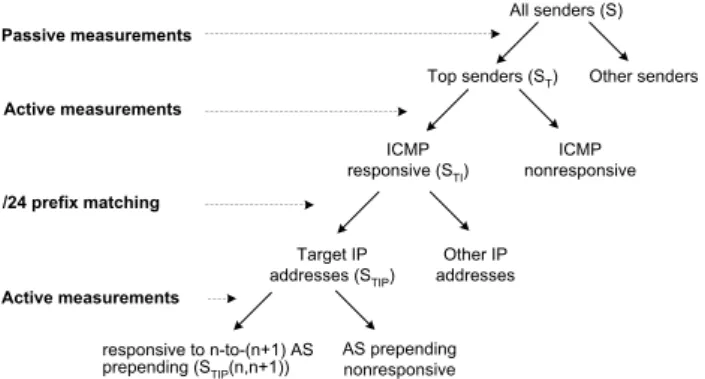
It is useful to first classify the set of senders that have sent packets to the dialup network under consideration, which is depicted in Fig. 7. To aid the discussion, we introduce the following notations and these terms are referenced to a certain period of time, such as a particular month.
• S: The set of all senders that have sent packets to the network.
• ST: A subnet ofS, known as top senders, that have contributed to a certain percentage, such as 95% or 99%, of all the total traffic volume sent to the network.
All senders (S) Other senders Top senders (ST) ICMP responsive (STI) ICMP nonresponsive responsive to n-to-(n+1) AS
prepending (STIP(n,n+1)) AS prependingnonresponsive Target IP
addresses (STIP) addressesOther IP Passive measurements
Active measurements
/24 prefix matching
Active measurements
Figure 7: A classification of the senders for the AS path prepending approach.
• ST IP: A subnet ofST Ithat comprises distinct IP addresses based on a certain prefix length, such as /24.
• ST IP(n, n+ 1): A subnet ofST IP that would change their routing paths from link 1
to link 2 when the AS path length increases fromnton+ 1.
Recall that one of the purposes of the passive measurement is to findST that is as-sumed to be quite stable. Active measurement, on the other hand, first finds out which top senders respond to ICMP echo requests, and then narrow down the target addresses to a set of distinct IP addresses based on a prefix length. Moreover, a set of experiments are performed to find outST IP(n, n+ 1),n= 0, ...,4, which are also assumed to be quite stable.
Moreover, we useRi(S, n), i= 1,2, to denote the daily average rate of traffic coming into linkithat is generated from senders inS and when the AS path length isn (n is omitted if it can be uniquely deduced fromS. Specifically, we use the following notations to describe the change prediction algorithm.
• Ri(S, n): From all senders
• Ri(ST IP, n): From the set of target addresses
• Ri(ST IP(n, n+ 1)): From a subnet of target addresses whose traffic will shift from
link 1 to link 2 when the AS path length increases fromnton+ 1
• 4Ri(n, n+ 1): the amount of daily traffic rate shifted from linkito another link when
the AS path length increases fromnton+ 1
4.1
Change prediction computation
It is useful to examine what we have (not) known about the possible traffic shift with one more AS prepending. First of all, we have identified from the active measurement results
ST IP andST IP(n, n+ 1). Therefore, based on the daily traffic rates from the passive
measurement results, we can predict that the traffic fromST IP(n, n+ 1)will be shifted from link 1 to link 2 after one more AS prepending, and the traffic rate concerned is given
be switched to link 2 is given by
R1(ST IP(n, n+ 1))
R1(ST IP, n)
. (1)
However, besides the target addresses, there are other senders contributing to the over-all traffic rate into link 1. To cater for them, we trace the tree in Fig. 7, starting from the AS prepending responsive and toward the root. If the “other IP addresses” share similar routing policies as the corresponding target address, then we can apply the same ratio in Eq. (1) to these senders. Therefore, after taking into these senders,4R1(n, n+1)is given byRi(ST IP(n,n+1))
Ri(ST IP,n) ∗R1(ST I, n).
If we go one more level up, the senders to be taken into account are those top senders that do not respond to ICMP echo requests. In our measurements, these senders comprise almost 40% of all top senders. Thus, any inaccurate prediction for this group would seri-ously affect the results. Unfortunately, our active measurement system cannot assess their sensitivity to the changes in AS path length without making the change first (and we know of no other way that would). There are a couple ways to solve this problem. The first one is to compare the passive measurement data before and after the additional AS prepend-ing for this set. Since this is a after-fact assessment, this approach can be used only to augment the prediction results. Another approach adopted by us is to assume that fraction of traffic rate from this set that would be affected by the additional prepending is the same as that forST IP(n, n+ 1). We understand that this is a rather unjustified assumption; however, this is a reasonable assumption to start with. Thus,4R1(n, n+ 1)is now given byRi(ST IP(n,n+1))
Ri(ST IP,n) ∗R1(ST, n).
Finally, the contributions to the overall traffic rate from the nontop senders are negli-gible. Therefore, the predicted traffic change in terms of the daily rate is given by
4R1(n, n+ 1) =
R1(ST IP(n, n+ 1))
R1(ST IP, n)
∗R1(S, n). (2)
That is, the traffic rate of link 1 is predicted to be decreased by4R1(n, n+ 1), while link 2’s is predicted to be increased by the same amount.
4.2
Change prediction experiments and results
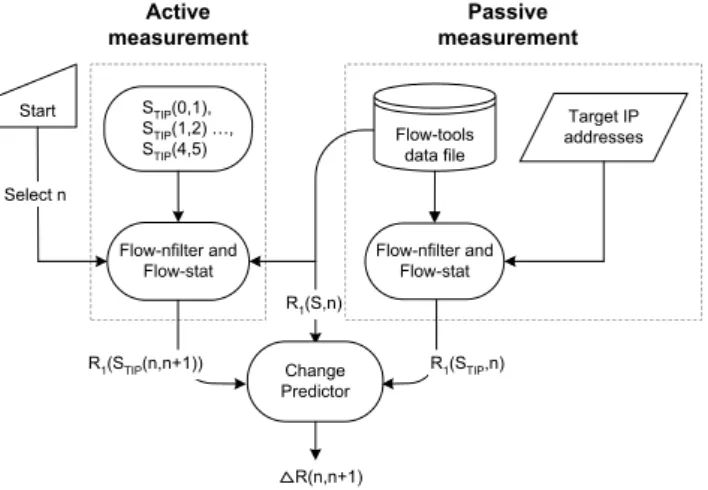
As just discussed, the traffic change prediction is based on both passive and active mea-surement results, as shown in Fig. 8. The active meamea-surement provides the sets of top senders that would change the routing paths with an additional AS prepending. Then it obtains from the passive measurement database the daily traffic rate into link 1 that is gen-erated fromST IP(n, n+ 1)when the AS path length is stilln, i.e.,R1(ST IP(n, n+ 1)). The passive measurement system, on the other hand, provides the daily average traffic rate into link 1 and computesR1(ST IP, n)based on the set of target addresses. Therefore, all three traffic rates needed for computing the predicted change, as required by Eq. (2), are provided by both systems.
In order to cater for the Internet dynamics and possible impacts of various parameters used in the algorithm, we have conducted two independent experiments on traffic change prediction with parameters given in Table 1. The two experiments were performed in
Jan-Target IP addresses Flow-tools data file Flow-nfilter and Flow-stat Start Flow-nfilter and Flow-stat Change Predictor STIP(0,1), STIP(1,2) …, STIP(4,5) R1(STIP(n,n+1)) R1(STIP,n) R(n,n+1) Active measurement Passive measurement Select n R1(S,n)
Figure 8: The traffic prediction system.
uary and March this year, respectively. For each case, the passive measurement results are based on the month prior to the month of making predictions and the actual changes in the AS path length. That is, for the first experiment the active measurement and traffic prediction were performed in January, and the passive measurement results were based on the ones collected in the month of December last year. The 99% top-sender selection rule and a higher number of senders in experiment 2 give a much higher number of top senders for experiment 2. The percentages for top senders responding to ICMP, on the other hand, are both slightly over 60%. Another main difference is that experiment 1 adopts a further /24 prefix matching to select target addresses, but experiment 2 does not. There are some obvious trade-offs between the two. The /24 prefix matching will definitely reduce the size of the target addresses, thus minimizing the impact on the Internet’s normal opera-tion. However, the side effect is that traffic volume belonging to other senders may also be included into the computation which inflates the actual value ofR1(ST IP(n, n+ 1)). Moreover, we only consider the case of changing the prepending from 2 to 3 ASes, be-cause this case incurs the most significant traffic shift from link 1 to link 2.
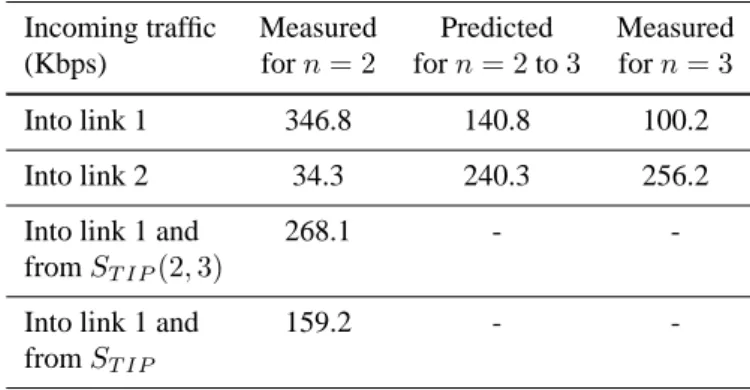
The prediction results for the two experiments are shown in Tables 2 and 3. The pre-dicted traffic rates into links 1 and 2 are computed according to Eq. (2). The measured values forn = 2in the third and fourth rows are for computing the predicted changes. After changing the AS path prepending to 3, we have measured the actual traffic rates and compare the difference with the predicted values before the change. Since one of the main concern is whether the change will congest the link receiving the shifted traffic, it is more important to evaluate the prediction results in link 2. The prediction errors that are given by the difference between the two divided by the actual value are 6.2% and 9.8% for experiments 1 and 2, respectively. One obvious source contributing to the errors are the variability in the daily traffic rates. The differences between the two sets of measure-ment data in each case are in the range of a few percentages. Therefore, after considering the errors arising from the normal traffic variation, the predicted values can be considered quite accurate. Nevertheless, it is yet to see whether the same accuracy can be obtained
Experiment 1 Experiment 2
No. senders 146,347 208,535
Selection of top senders 95% 99%
No. top senders 11,224 15,467
No. ICMP responsive top senders 7,055 9,487 Prefix length for target addr. selection 24 32
No. target addresses 3,805 9,487
Table 1 Setups for the two experiments of traffic change prediction.
Incoming traffic Measured Predicted Measured (Kbps) forn= 2 forn= 2to3 forn= 3
Into link 1 346.8 140.8 100.2
Into link 2 34.3 240.3 256.2
Into link 1 and 268.1 -
-fromST IP(2,3)
Into link 1 and 159.2 -
-fromST IP
Table 2 First set of change prediction results for 2 to 3 AS prepending.
in other sites. Finally, based on the two experiment results, it is inconclusive as whether the differences in the top-sender selection rule and prefix length have any impact on the prediction results.
Incoming traffic Measured Predicted Measured (Kbps) forn= 2 forn= 2to3 forn= 3
Into link 1 358.3 121.9 112.8
Into link 2 40.7 277.1 307.1
Into link 1 and 183.0 -
-fromST IP(2,3)
Into link 1 and 120.8 -
-fromST IP
5.
Conclusions and future work
In this paper we have proposed a complete and automated process based on AS path prepending to engineer traffic coming into an multihomed AS. The entire process con-sists of three main systems: passive measurement, active measurement, and traffic change prediction. This process has several important advantages. First, it can be readily deployed in other multihomed ASes, because it does not require special hardware and software, and the resource requirement is relatively low. Second, the process has been carefully engi-neered to minimize unnecessary disruption to the Internet’s normal operation. Although the active measurement part is intrusive, but the impact has been significantly reduced by identifying the top senders and a further prefix-based target address selection. Third, it provides a systematic procedure to determine how much prepending is needed and to pre-dict the amount of traffic shift. As a result, the process can avoid possible link congestion and foresee possible performance impact.
Another step of further improving the approach is to combine the AS path prepending with the BGP Community path attribute. If the upstream ISP supports the BGP Com-munity attribute, the AS path prepending can be performed in the upstream ISP instead. Since the upstream ISP is one AS hop closer to the sender, a finer inbound traffic engi-neering is possible. At the time of performing the experiments, the noncommercial AS’s two ISPs did not support the BGP Community attributes. However, one of the upstream ISPs will very soon be changed to a tier-one ISP that supports many BGP Community attributes. Therefore, one of our current works is to replicate the same process, but with a combination of the Community attributes and the AS path prepending.
References
[1] B. Quoitin, et al. Interdomain traffic engineering with BGP. IEEE Commun. Mag., 9(3):280– 292, May 2003.
[2] Cisco ISO Netflow. http://www.cisco.com/warp/public/732/Tech/nmp/ netflow/index.shtml. [3] D. Schooler. Connecting U.S. ISPs - The state of the backbone market. Instat-Cahners, 2000. [4] Flow-tools. http://www.splintered.net/sw/flow-tools/docs/flow-tools.html.
[5] G. Huston. State of inter-domain routing. Presented at the IAB Workshop on
Architectural Requirements for Inter-Domain Routing in the Internet, available from http://www.potaroo.net/papers/ietf50-bgp.pdf, 2001.
[6] I. Beijnum. BGP. O’Reilly, 2002.
[7] J. Rexford, et al. BGP routing stability of popular destinations. In Proc. ACM SIGCOMM Internet Measurement Workshop, Nov. 2002.
[8] S. Kalyanaraman. Load balancing in BGP environments using online simulation and dynamic NAT. Presented at the Internet Statistic and Metrics Analysis Workshops, available from http://www.caida.org/outreach/isma/0112/talks/shiv/, 2001.
[9] L. Swinnen. An evaluation of BGP-based traffic engineering techniques. available from http://www.info.ucl.ac.be/people/OBO/biblio.html.
[10] N. Feamster, J. Borkenhagen, and J. Rexford. Controlling the impact of BGP policy changes on IP traffic. Technical Report 011106-02, AT&T Research, Nov. 2001.
[11] Route preferences.