201 Airborne particulate matter, which includes dust, dirt, soot, smoke, and liquid droplets emitted into the air, is small enough to be suspended in the atmosphere. Airborne particulates may be a com-plex mixture of organic and inorganic substances. They can be characterized by their physical at-tributes, which influence their transport and deposition, and their chemical composition, which influences their effect on health.
The physical attributes of airborne particulates include mass concentration and size distribution. Ambient levels of mass concentration are mea-sured in micrograms per cubic meter (µg/m3); size attributes are usually measured in aerodynamic diameter. Particulate matter (PM) exceeding 2.5 microns (µm) in aerodynamic diameter is gener-ally defined as coarse particles, while particles smaller than 2.5 microns (PM2.5) are called fine par-ticles. The acid component of particulate matter, and most of its mutagenic activity, are generally contained in fine particles, although some coarse acid droplets are also present in fog. Samples taken in the United States showed that about 30% of par-ticulate matter was in the fine fraction (Stern et al. 1984).
Particles interact with various substances in the air to form organic or inorganic chemical com-pounds. The most common combinations of fine particles are those with sulfates. In the United States, sulfate ions account for about 40% of fine particulates and may also be present in concen-trations exceeding 10 µg/m3 (USEPA 1982b). The smaller particles contain the secondarily formed aerosols, combustion particles, and recondensed organic and metal vapors. The carbonaceous component of fine particles—products of incom-plete combustion—contains both elemental car-bon (graphite and soot) and nonvolatile organic carbon (hydrocarbons emitted in combustion
ex-Airborne Particulate Matter
haust, and secondary organic compounds formed by photochemistry). These species may be the most abundant fine particles after sulfates. Additionally, atmospheric reactions of nitrogen oxides produce nitric acid vapor (HNO3) that may accumulate as nitrate particles in both fine and coarse forms. The most common combination of coarse particles con-sists of oxides of silicon, aluminum, calcium, and iron.
Terms and Sampling Techniques
Several terms are used to describe particulates. Generally, these terms are associated with the sampling method:
Total suspended particulates (TSP) includes par-ticles of various sizes. Some proportion of TSP consists of particles too large to enter the human respiratory tract; therefore, TSP is not a good in-dicator of health-related exposure. TSP is mea-sured by a high-volume gravimetric sampler that collects suspended particles on a glass-fiber fil-ter. The upper limit for TSP is 45 microns in diam-eter in the United States and up to 160 microns in Europe.
TSP sampling and TSP-based standards were used in the United States until 1987. Several coun-tries in Central and Eastern Europe, Latin America, and Asia still monitor and set standards based on measurements of TSP. As monitoring methods and data analysis have become more sophisticated, the focus of attention has gradu-ally shifted to fine particulates. Recent evidence shows that fine particulates, which can reach the thoracic regions of the respiratory tract, or lower, are responsible for most of the excess mortality and morbidity associated with high levels of ex-posure to particulates. Most sophisticated stud-ies suggest that fine particulates are the sole factor
accounting for this health damage, while exposure to coarse particulates has little or no independent effect.
The particles most likely to cause adverse health effects are the fine particulates PM10 and PM2.5 — particles smaller than 10 microns and 2.5 microns in aerodynamic diameter, respectively. They are sampled using (a) a high-volume sampler with a size-selective inlet using a quartz filter or (b) a di-chotomous sampler that operates at a slower flow rate, separating on a Teflon filter particles smaller than 2.5 microns and sizes between 2.5 microns and 10 microns. No generally accepted conversion method exists between TSP and PM10, whichmay constitute between 40% and 70% of TSP (USEPA1982b).
In 1987, the USEPA switched its air quality stan-dards from TSP to PM10. PM10 standards have also been adopted in, for example, Brazil, Japan, and the Philippines. In light of the emerging evidence on the health impacts of fine particulates, the USEPA has proposed that U.S. ambient standards for airborne particulates be defined in fine particu-lates.
Black smoke (BS) is a particulate measure that typically contains at least 50% respirable particu-lates smaller than 4.5 mm in aerodynamic diam-eter, sampled by the British smokeshade (BS) method. The reflectance of light is measured by the darkness of the stain caused by particulates on a white filter paper. The result of BS sampling depends on the density of the stain and the opti-cal properties of the particulates. Because the method is based on reflectance from elemental carbon, its use is recommended in areas where coal smoke from domestic fires is the dominant component of ambient particulates (WHO and UNEP 1992). After reviewing the available data, Ostro (1994) concluded that BS is roughly equiva-lent to PM10. However, there is no precise equiva-lence of the black smoke measurements with other methods. The BS measure is most widely used in Great Britain and elsewhere in Europe.
Sources of Particulates
Some particulates come from natural sources such as evaporated sea spray, windborne pollen, dust, and volcanic or other geothermal eruptions. Par-ticulates from natural sources tend to be coarse. Almost all fine particulates are generated as a
re-sult of combustion processes, including the burn-ing of fossil fuels for steam generation, heatburn-ing and household cooking, agricultural field burning, die-sel-fueled engine combustion, and various indus-trial processes. Emissions from these anthropogenic sources tend to be in fine fractions. However, some industrial and other processes that produce large amounts of dust, such as cement manufacturing, mining, stone crushing, and flour milling, tend to generate particles larger than 1 micron and mostly larger than 2.5 microns. In cold and temperate parts of the world, domestic coal burning has been a major contributor to the particulate content of urban air. Traffic-related emissions may make a substantial contribution to the concentration of suspended particulates in ar-eas close to traffic. Some agroindustrial processes and road traffic represent additional anthropo-genic sources of mostly coarse particulate emis-sions.
The largest stationary sources of particulate emissions include fossil-fuel-based thermal power plants, metallurgical processes, and ce-ment manufacturing. The physical and chemical composition of particulate emissions is deter-mined by the nature of pollution sources. Most particles emitted by anthropogenic sources are less than 2.5 microns in diameter and include a larger variety of toxic elements than particles emit-ted by natural sources. Fossil fuel combustion gen-erates metal and sulfur particulate emissions, depending on the chemical composition of the fuel used. The USEPA (1982b) estimates that more than 90% of fine particulates emitted from sta-tionary combustion sources are combined with sulfur dioxide (SO2). Sulfates, however, do not necessarily form the largest fraction of fine particulates. In locations such as Bangkok, Chongqing (China), and São Paulo (Brazil), or-ganic carbon compounds account for a larger fraction of fine particulates, reflecting the role of emissions from diesel and two-stroke vehicles or of smoke from burning coal and charcoal. Al-though sulfates represent a significant share (30– 40%) of fine particulates in these cases, care is required before making general assertions about the relationship between sulfates and fine par-ticulates, since the sources and species charac-teristics of fine particulates may vary significantly across locations. Combustion devices may emit particulates comprised of products of incomplete
combustion (PICs, which may include toxic organ-ics) and toxic metals, which are present in the fuel and in some cases may also be carcinogenic. Par-ticulates emitted by thermal power generation may contain lead, mercury, and other heavy metals. The melting, pouring, and torch-cutting procedures of metallurgy emit metal particulates containing lead, cadmium, and nickel. Particles emitted by the ce-ment industry are largely stone or clay-based par-ticulates that may contain toxic metals such as lead.
Impacts of Exposure
Human Health Effects
The respiratory system is the major route of entry for airborne particulates. The deposition of particu-lates in different parts of the human respiratory system depends on particle size, shape, density, and individual breathing patterns (mouth or nose breathing). The effect on the human organism is also influenced by the chemical composition of the particles, the duration of exposure, and individual susceptibility. While all particles smaller than 10 microns in diameter can reach the human lungs, the retention rate is largest for the finer particles. Products of incomplete combustion, which form a significant portion of the fine particulates, may enter deep into the lungs. PICs contribute signifi-cantly to health impacts associated with fine par-ticulates.
Clinical, epidemiologic, and toxicological sources are used to estimate the mortality and morbidity effects of short- and long-term expo-sure to various particulate concentration levels. Several studies have found statistically signifi-cant relationships between high short-term am-bient particulate concentrations and excess mortality in London and elsewhere. The esti-mated 4,000 excess deaths in the London met-ropolitan area in December 1952 were associated with BS measurements equivalent to a 4,000 µg/ m3 maximum daily average ambient concentration of particulates (Schwartz and Dockery 1992b). Schwartz (1993b) has also found a significant as-sociation between daily average PM10 concentra-tions and mortality at concentraconcentra-tions below the current U.S. standard of 150 µg/m3 for short-term PM10 concentrations.
Population-based cross-sectional and longitudi-nal studies (see, for example, Lipfert 1984; Dockery et al. 1993) have found an association between long-term exposure and mortality. Using 14-to-16-year studies in six U.S. cities, and controlling for individual risk factors, including age, sex, smok-ing, body-mass index, and occupational exposure, Dockery et al. (1993) found a significant connec-tion between particulate air polluconnec-tion and excess mortality at average annual PM10 concentrations as low as 18 µg/m3, well below the current U.S. ambient standard of 50 µg/m3. Studies on the ef-fect of particulates on human health summarized by Ostro (1994) suggest an increase in human mor-tality rates ranging from 0.3% to 1.6% for each 10 µg/m3 increase in average annual PM
10 concentra-tions.
A study conducted on over a half million people in 151 U.S. metropolitan areas during 1982–89 by Pope et al. (1995) found that death rates in the areas most polluted with fine par-ticulates were 17% higher than in the least pol-luted areas, as a result of a 31% higher rate of death from heart and lung disease, even when most cities complied with the U.S. federal stan-dards for particulate pollution. Cities with aver-age pollution that complied with federal standards still had about a 5% higher death rate than the cleanest cities.
In addition, relationships between morbidity and short- and long-term exposure to particu-late matter have been found in a number of stud-ies. Schwartz et al. (1993) found a significant increase in emergency room visits among people under the age of 65 in areas with daily average PM10 concentrations that were less than 70% of the U.S. air quality standard of 150 µg/m3. Several studies carried out in Canada, Germany, Switzerland, and the United States have found an association be-tween respiratory symptoms and exposure to long-term ambient particulate concentrations of about 30–35 µg/m3, without any evidence of a threshold level below which health effects do not occur. (For a summary, see Schwartz 1991/92.) Kane (1994) demonstrated an association between mineral dusts such as silica or asbestos fibers accumulat-ing in the lungs and a characteristic spectrum of diseases. Recently, the potential carcinogenic effect of certain dust compounds has been analyzed, and in some cases (for example, for silica dust),
limited evidence of carcinogenic effects has been found (see Ulm 1994).
Recent epidemiologic evidence (for example, Schwartz 1991/92; Schwartz and Dockery 1992b; Ostro 1994) suggests that there may be no safe threshold for fine particulate matter and that the effects are linearly related to concentration.
Other Effects
Vegetation exposed to wet and dry deposition of particulates may be injured when particulates are combined with other pollutants. Coarse particles, such as dust, directly deposited on leaf surfaces can reduce gas exchange and photosynthesis, leading to reduced plant growth. Heavy metals that may be present in particulates, when depos-ited on soil, inhibit the process in soil that makes nutrients available to plants. This, combined with the effects of particulates on leaves, may contrib-ute to reduction of plant growth and yields. In addition, particulates contribute to the soiling and erosion of buildings, materials, and paint, leading to increased cleaning and maintenance costs and to loss of utility.
Particulate emissions have their greatest im-pact on terrestrial ecosystems in the vicinity of emissions sources. Ecological alterations may be the result of particulate emissions that include toxic elements. Furthermore, the presence of fine particulates may cause light scattering, or atmo-spheric haze, reducing visibility and adversely affecting transport safety, property values, and aesthetics.
Ambient Standards and Guidelines
The most frequently used reference guidelines for ambient particulate concentration are those of WHO, the EU, and the USEPA. These guidelines are based on clinical, toxicological, and epidemio-logic evidence and were established by determin-ing the concentrations with the lowest observed adverse effect (implicitly accepting the notion that a lower threshold exists under which no verse human health effects can be detected), ad-justed by an arbitrary margin of safety factor to allow for uncertainties in extrapolation from animals to humans and from small groups of hu-mans to larger populations.1 The WHO guide-lines are based on health considerations alone;
the EU and USEPA standards also reflect the tech-nological feasibility of meeting the standards. In the EU, a prolonged consultation and legislative decisionmaking process took into account the environmental conditions and the economic and social development of the various regions and countries and acknowledged a phased approach to compliance. A potential tradeoff was also rec-ognized in the guidelines for the combined ef-fects of sulfur dioxide and particulate matter (see European Community 1992).
Conclusions
The main objective of air quality guidelines and standards is the protection of human health. Since fine particulates (PM10) are more likely to cause adverse health effects than coarse particulates, guidelines and standards referring to fine par-ticulate concentrations are preferred to those re-ferring to TSP, which includes coarse particulate concentrations.
Scientific studies provide ample evidence of the relationship between exposure to short-term and long-term ambient particulate concentra-tions and human mortality and morbidity effects. However, the dose-response mechanism is not yet fully understood. Furthermore, according to WHO (1987), there is no safe threshold level below which health damage does not occur. Therefore, policymakers may have to consider ac-ceptable risk rather than try to achieve absolute safety when setting ambient particulate concen-tration standards. Furthermore, ambient guide-lines can become an effective part of the environmental management system only if implementation is feasible and the enforcement of other policy instruments ensures their attain-ment. Consideration should therefore be given to the technical feasibility and the costs of at-tainment.
Another difficulty is that airborne particulates are rarely homogeneous: They vary greatly in size and shape, and their chemical composition is determined by factors specific to the source and location of the emissions. The combined effects and interactions of various substances mixed with particulates have not yet been established (except for sulfur dioxide), but they are believed to be significant, especially where long-term ex-posure occurs. Measurement techniques and their
reliability may vary across regions and countries, and so may other factors, such as diet, lifestyle, and physical fitness, that influence the human health effects of exposure to particulates.
Recommendations
In the long term, countries should seek to ensure that ambient exposure to particulates, especially to PM10, do not exceed the WHO recommended guidelines (see Table 1). In the interim, countries should set ambient standards for total particu-lates, PM10, or both that take into account (a) the benefits to human health of reducing exposure to particulates; (b) the concentration levels achievable by pollution prevention and control measures; and (c) the costs involved in meeting the standards. In adopting new ambient air qual-ity standards, countries should set appropriate phase-in periods during which districts or mu-nicipalities that do not meet the new standards are expected to come into compliance and will be assisted to attain the standards. Where there are large differences between the costs and ben-efits of meeting air quality standards, it may be
appropriate to establish area-specific ambient standards case by case.
Prior to carrying out an environmental assess-ment, a trigger value for annual average concen-trations of PM10 should be agreed on by the country and the World Bank. Countries may wish to adopt EU, USEPA, or WHO guidelines or standards as their trigger values. The trigger value should be equal to or lower than the country’s ambient stan-dard. The trigger value is not an ambient air qual-ity standard but simply a threshold. If, as a result of the project, the trigger value is predicted to be exceeded in the area affected by the project, the EA assessment should seek mitigation alternatives on a regional or sectoral basis. In the absence of an agreed value, the World Bank Group will classify an airshed as moderately degraded if the annual average concentration levels of particulates are above 50 µg/m3 or if the 98th percentile of 24-hour mean values over a one-year period is estimated to exceed 150 µg/m3 of PM
10. In areas where PM10 measurements do not exist, the value of 80 µg/m3 for TSP will be used. Airsheds will be classified as hav-ing poor air quality with respect to particulate
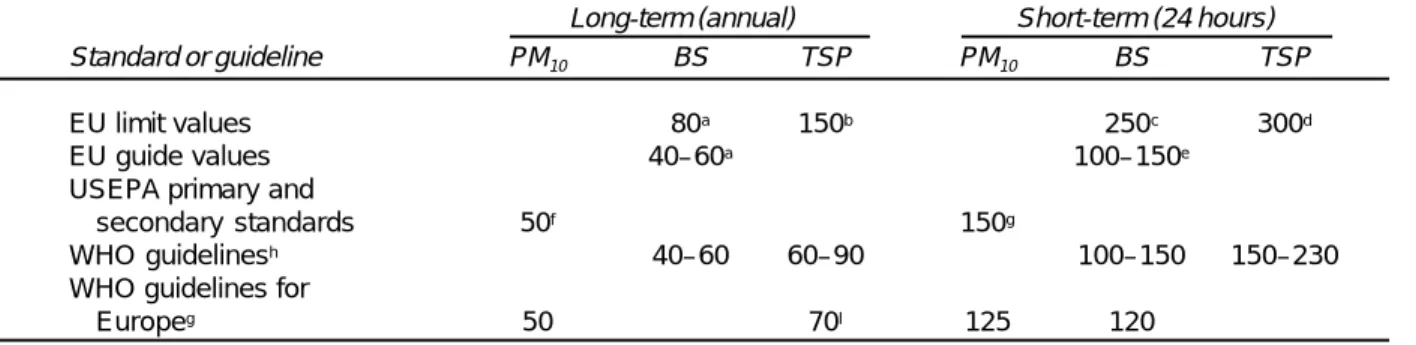
mat-Table 1. Reference Standards and Guidelines for Average Ambient Particulate Concentration (micrograms per cubic meter)
Long-term (annual) Short-term (24 hours)
Standard or guideline PM10 BS TSP PM10 BS TSP
EU limit values 80a 150b 250c 300d
EU guide values 40–60a 100–150e
USEPA primary and
secondary standards 50f 150g
WHO guidelinesh 40–60 60–90 100–150 150–230
WHO guidelines for
Europeg 50 70I 125 120
Notes: PM10, particulate matter less than 10 microns in aerodynamic diameter; BS, black smoke (converted to µg/m3 measure); TSP,
total suspended particulates. a. Median of daily mean values.
b. Arithmetic mean of daily mean values.
c. 98th percentile of all daily mean values throughout the year. d. 95th percentile of all daily mean values throughout the year. e. Daily mean values.
f. Arithmetic mean.
g. Guideline values for combined exposure to sulfur dioxide and particulates. h. Not to be exceeded for more than one day per year.
i. Guideline for thoracic particles. According to International Organization for Standardization standard ISO-TP, thoracic particle measurements are roughly equivalent to the sampling characteristics for particulate matter with a 50% cutoff point at 10 microns diameter. Values are to be regarded as tentative at this time, being based on a single study that also involved sulfur dioxide exposure.
Sources: European Community 1992 (EU); United States, CFR (USEPA); WHO 1979 (WHO guidelines); WHO 1987 (WHO guide-lines for Europe).
ter if the annual mean value of PM10 is greater than 100 µg/m3 or if the 95th percentile of 24-hour mean values of PM10 over a period of one year is esti-mated to exceed 150 µg/m3.
Good practice in airshed management should encompass the establishment of an emergency response plan during industrial plant operation. It is recommended that this plan be put into ef-fect when levels of air pollution exceed one or more of the emergency trigger values (deter-mined for short-term concentrations of sulfur dioxide, nitrogen oxides, particulates, and ozone). The recommended emergency trigger value for PM10 is 150 µg/m3 for 24-hour average concentrations. Where PM10 measurements do not exist, the value of 300 µg/m3 for TSP is recom-mended.
Note
1. Adverse effect is defined as “any effect result-ing in functional impairment and/or pathological lesions that may affect the performance of the whole organism or which contributed to a reduced ability to respond to an additional challenge” (see USEPA 1980).
References and Sources
Dockery, D., C. A. Pope, X. Xiping, J. Spengler, J. Ware, M. Fay, B. Ferris, and F. Speizer. 1993. “An Associa-tion between Air PolluAssocia-tion and Mortality in Six U.S. Cities.” New England Journal of Medicine 329(24): 1753–59.
European Community. 1992. European Community Deskbook. Washington, D.C.: Environmental Law Institute.
Kane, A. B. 1994. “Particle- and Fiber-induced Lesions: An Overview.” In D. L. Dungworth, J. C. Mauderly, and G. Oberdorfer, eds., Toxic and Carcinogenic Ef-fects of Solid Particles in the Respiratory Tract.. Wash-ington, D.C: International Life Sciences Institute. Lipfert, F. W. 1984. “Air Pollution and Mortality:
Specification Searches Using SMSA-Based Data.” Journal of Environmental Economics and Management 11: 208–43.
Ostro, Bart. 1994. “Estimating the Health Effects of Air Pollutants: A Method with an Application to Jakarta.” Policy Research Working Paper 1301. World Bank, Policy Research Department, Washing-ton, D.C.
Pope, C. A., M. Thun, M. Namboodiri, D. Dockery, J. Evans, F. Speizer, and C. Heath. 1995. “Particu-late Air Pollution as a Predictor of Mortality in a Prospective Study of U.S. Adults.” American Jour-nal of Respiratory and Critical Care Medicine 151: 669–74.
Schwartz, Joel. 1991/92. “Particulate Air Pollution and Daily Mortality: A Synthesis.” Public Health Reviews 19: 39–60.
————. 1993a. “Particulate Air Pollution and Chronic Respiratory Disease.” Environmental Research 62: 7–13. ————. 1993b. “Air Pollution and Daily Mortality in Birmingham, Alabama.” American Journal of Epi-demiology 137(10).
Schwartz, Joel, and D. W. Dockery. 1992a. “Increased Mortality in Philadelphia Associated with Daily Air Pollution Concentrations.” American Review of Res-piratory Disease 145: 600–604.
————. 1992b. “Particulate Air Pollution and Daily Mortality in Steubenville, Ohio.” American Review of Respiratory Disease 135(1).
Schwartz, Joel, et al. 1993. “Particulate Air Pollution and Hospital Emergency Room Visits for Asthma in Seattle.” American Review of Respiratory Disease 147: 826–31.
Stern, Arthur C., et al. 1984. Fundamentals of Air Pollu-tion. Orlando, Fla.: Academic Press.
Ulm, K. 1994. “Epidemiology of Chronic Dust Expo-sure.” In D. L. Dungworth, J. C. Mauderly, and G. Oberdorfer, eds., Toxic Carcinogenic Effects of Solid Particles in the Respiratory Tract. Washington, D.C: International Life Sciences Institute.
United States. CFR (Code of Federal Regulations). Wash-ington, D.C.: Government Printing Office.
USEPA (United States Environmental Protection Agency). 1980. “Guidelines and Methodology Used in the Preparation of Health Effect Assessment Chapters of the Consent Decree Water Quality Cri-teria.” Federal Register 45: 79347–57.
————. 1982a. Air Quality Criteria for Particulate Mat-ter and Sulfur Oxides. Vol. I. EPA-600/8-82-029a. Research Triangle Park, N.C.
————. 1982b. Second Addendum to Air Quality Crite-ria for Particulate Matter and Sulfur Oxides (1982): Assessment of Newly Available Health Effects Informa-tion. Research Triangle Park, N.C.
————. 1990. Review of the National Ambient Air Quality Standard for Particulate Matter: Assessment of Scientific and Technical Information. Research Triangle Park, N.C.
WHO (World Health Organization). 1979. “Sulfur Oxides and Suspended Particulate Matter.” Envi-ronmental Health Criteria 8. Geneva.
————. 1987. Air Quality Guidelines for Europe. Copenhagen: WHO Regional Office for Europe.
WHO (World Health Organization) and UNEP (United Nations Environment Programme). 1992. Urban Air Pollution in Megacities of the World. Cam-bridge, Mass.: Blackwell Reference.