Open Access
Research article
Interpretable correlation descriptors for quantitative
structure-activity relationships
Benson M Spowage
1, Craig L Bruce
1,2and Jonathan D Hirst*
1Address: 1School of Chemistry, University of Nottingham, University Park, Nottingham, NG7 2RD, UK and 2AstraZeneca, Mereside, Alderley Park,
Macclesfield, Cheshire, SK10 4TG, UK
Email: Benson M Spowage - [email protected]; Craig L Bruce - [email protected]; Jonathan D Hirst* - [email protected]
* Corresponding author
Abstract
Background: The topological maximum cross correlation (TMACC) descriptors are alignment-independent 2D descriptors for the derivation of QSARs. TMACC descriptors are generated using atomic properties determined by molecular topology. Previous validation (J Chem Inf Model 2007, 47: 626-634) of the TMACC descriptor suggests it is competitive with the current state of the art. Results: Here, we illustrate the interpretability of the TMACC descriptors, through the analysis of the QSARs of inhibitors of angiotensin converting enzyme (ACE) and dihydrofolate reductase (DHFR). In the case of the ACE inhibitors, the TMACC interpretation shows features specific to C-domain inhibition, which have not been explicitly identified in previous QSAR studies.
Conclusions: The TMACC interpretation can provide new insight into the structure-activity relationships studied. Freely available, open source software for generating the TMACC descriptors can be downloaded from http://comp.chem.nottingham.ac.uk.
Background
Quantitative structure-activity relationship (QSAR) mod-els correlate molecular chemical structure to biological activity. The underlying principle for QSAR modelling is the similar property principle: molecules with similar chemical structures will exhibit similar biological proper-ties [1]. This principle can be explained by changes in chemical structure altering the electron distribution within a molecule, which is directly responsible for the activity of the molecule. QSARs can be used to elucidate a quantitative description of changes in biological activity arising from the exchange of the functional groups within a molecule. In general, QSAR modelling requires three main features: a data set of molecules, appropriate descriptors and an efficient statistical method for
captur-ing correlation. Descriptors are characteristic properties of molecules, often represented as numerical values, which facilitate the analysis of chemical structure. A wide variety of molecular descriptors are available and descriptor selection is an integral process in QSAR modelling [2]. 2D QSAR models are generated using descriptors derived from the two-dimensional graph representation of a mol-ecule. In contrast, 3D QSAR models correlate activity with descriptors based on spatially localised features. Although 3D descriptors may allow more detailed descriptions of the molecular binding interactions between ligands and receptors, 3D methods are more time-consuming, due to the requirement of precise conformational detail on the molecule and exact alignment [3]. In some cases, 2D
Published: 24 December 2009
Journal of Cheminformatics 2009, 1:22 doi:10.1186/1758-2946-1-22
Received: 5 November 2009 Accepted: 24 December 2009
This article is available from: http://www.jcheminf.com/content/1/1/22
© 2009 Spowage et al; licensee BioMed Central Ltd.
QSAR methods can classify the biological activity mole-cules more efficiently than some more complex 3D QSAR methods [4]. In many instances, the biologically active conformation of a molecule is unknown and 2D descrip-tors are useful, as they are not dependent upon spatial conformation.
Classic QSAR methods, developed by Hansch [5], pro-vided a foundation on which numerous QSAR methods are now based: the correlation of physicochemical proper-ties to activity using multivariable regression. Regression analysis models the activities of molecules through an equation constructed using a linear combination of phys-icochemical properties. The coefficient for each variable in the equation can, consequently, be examined to deter-mine the extent to which each property contributes towards the activity of the molecule. Regression is central to many contemporary QSAR methods, although nowa-days often the technique of partial least squares (PLS) [6] is used to cope with large numbers of descriptors. One of the appeals of regression is the relative ease with which models can be interpreted and this extends to approaches based on PLS [7]. Sometimes an interpretable model might be favoured over a more accurate, but less transpar-ent, QSAR [8].
Over the last decade, advances in computational technol-ogy combined with contemporary methodologies have led to a vast array of new descriptors [2]. Topological max-imum cross correlation (TMACC) descriptors were created [9] with the intention of developing an interpretable 2D descriptor for QSAR modelling. The TMACC descriptors are based on concepts derived from the grid-independent descriptors (GRIND) [10]. GRIND are alignment-inde-pendent 3D molecular descriptors which represent a mol-ecule using a grid on which the product of pairs of force field interactions is plotted against the distances between the pairs [10]. This method is analogous to the autocorre-lation descriptor, which represents atom pairs as a weighted histogram [11]. GRIND are interpretable, as only one value is stored for each distance range: the max-imum product of the two force field interactions. This method was termed maximum auto- and cross-correla-tion (MACC) [10]. In a similar method, the TMACC descriptors use the topological bond distances and physi-cochemical properties of a molecule. Only the maximum value calculated as the product of pair combinations of physicochemical properties for each distance is used to generate the TMACC descriptors.
Previous validation of the TMACC descriptors was prom-ising, with leave-one-out (LOO) cross-validated correla-tion coefficients comparable to those achieved by the state-of-the-art 2D QSAR method, hologram QSAR [9]. An external test set is often used to estimate predictive
accuracy [12]. However, the external test set must be large to give results as reliable as cross validation [13-15]. We have previously shown [9], on the datasets in this study, that using a training/test set partition gives estimates of predictive accuracy that are qualitatively similar to those from cross validation. Thus, here we use cross validation only, as it makes more use of the data for model building. Whilst statistical validation is key, the interpretation and chemical significance of the structure-activity relation-ships generated are also important [2,12]. To assess the interpretive ability of a QSAR model it is necessary to apply scientific rationale to the resultant interpretation [16]. Interpretation of the TMACC descriptors is achieved through analysis of the regression model generated by PLS. The predicted activity of a molecule can be attributed to specific atoms that contribute towards the TMACC descriptors. Visualization of the resultant atom activity contributions is accomplished by atomic colour coding based on sign and magnitude of partial activity.
The present study aims to evaluate the ability to identify known structure-activity relationships using the TMACC descriptors. To exemplify the TMACC descriptors, we investigate two datasets, which were previously used in a comprehensive comparison of modern QSAR approaches [17]. Models derived from the angiotensin converting enzyme (ACE) and dihydrofolate reductase (DHFR) inhibitor data sets were assessed to elucidate the encoded structure-activity relationships with the help of informa-tion in the literature and to evaluate the interpretive abil-ity of TMACC models.
Experimental
which is determined through classification of atoms based on neighbouring atoms [21]. Crippen-Wildman partition coefficients (logP) are assigned to each atom as a measure of atomic lipophilicity, determined in the same way as Crippen-Wildman molar refractivity.
Property types which produce positive and negative values were considered as two separate properties (Table 1). This was the case for all property types, except molar refractiv-ity, as all atomic values for this property are positive. To account for the different scales used by each atomic parameter, each contribution was rescaled by the largest absolute value, resulting in all values being confined within the range of +1 and -1.
The TMACC descriptor was derived from the autocorrela-tion descriptor [11]. The standard equaautocorrela-tion for calculating an autocorrelation descriptor, Xac, (Equation 1), considers a property, p, and the topological distance, d, between atoms i and j:
TMACC descriptors are calculated as the product of the physicochemical properties as determined for every atom pair within a given molecule. Only the maximum value determined for any bond distance is used in the genera-tion of the TMACC descriptors. All other values are neglected. As the TMACC descriptor incorporates both autocorrelation and cross-correlation, all possible combi-nations of physicochemical properties are considered. The equation for calculating a TMACC descriptor (XTMACC) (Equation 2) summarises this approach, involving two properties, p and q, for two atoms, i and j, separated by the topological distance, d:
Interpretation of the TMACC descriptors was accom-plished by rescaling the coefficients from the non-cross-validated model. For every unscaled descriptor, xi, we define the partial activity as βixi, using the unscaled
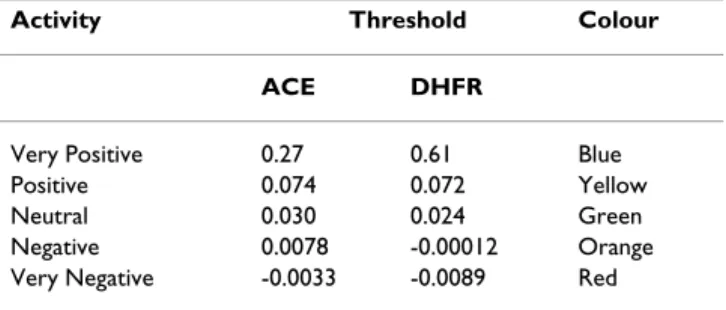
regres-sion coefficient, βi. This provided a method for identifica-tion of the atoms which contribute towards each descriptor for a particular molecule. Each atom contribut-ing to a descriptor was given an equal share of the partial activity. The atom contribution values were subsequently summed for each atom. For a given dataset, the total atom contributions were separated into five activity bands, ranging from 'very negative' to 'very positive' (Table 2), each containing an equal number of atoms. By colour-coding each atom according to its activity band, it was possible to visualize the activity of each atom.
All calculations were performed using Nottingham Chem-informatics Workbench (NCW), a package which pro-vides the function of generating the TMACC descriptors and the TMACC interpretation. NCW is a Java-based application, which is suitable for all major operating sys-tems. It builds upon the original TMACC code (available from our website http://comp.chem.nottingham.ac.uk/ download/tmacc). The original software only generates TMACC descriptors; there is no facility to interpret your model. NCW allows the user to start with a set of mole-cules and perform a full analysis upon them. The popular machine-learning workbench Weka is included to provide PLS modeling, as well as an in-house implementation. The in-house PLS algorithm was written before Weka included one. The results of the PLS analysis are used to determine the atomic contribution of each atom. The interpretation is visualized by a colour scheme depicting activity contribution by atom. The user is able to view molecules individually or tabulated. NCW will be availa-ble as open source software for download from our web-site, http://comp.chem.nottingham.ac.uk/download/ ncw. NCW utilizes Marvin for drawing and manipulating chemical structures: Marvin 5.2.2, 2009 http:// www.chemaxon.com. All molecular graphics were created
Xac( , )p d = Σp pi j (1)
XTMACC( , , )p q d =max p q q p( i j, i j) (2)
Table 1: Properties used in generation of TMACC descriptors
Physicochemical property Separate property
Gasteiger partial charge (Electrostatics)
Positive charge
Negative charge logS
(Solubility and solvation phenomena)
Positive logS
Negative logS
Crippen-Wildman logP (Hydrophobicity) Positive logP
Negative logP
Crippen-Wildman Molar Refractivity (Sterics and polarizability)
Molar refractivity
Table 2: The activity bands used for TMACC descriptor interpretation
Activity Threshold Colour
ACE DHFR
using YASARA ("Yet Another Scientific Artificial Reality Application," http://www.yasara.com).
Results and Discussion
Angiotensin converting enzyme (ACE) inhibition
LOO cross-validation of the PLS models generated for the ACE and DHFR data sets gave q2 values of 0.70 and 0.53, respectively, consistent with those previously reported [9]. TMACC descriptors were generated for the ACE data set of 114 inhibitor molecules, previously used to assess the ability of a 3D QSAR method, comparative molecular field analysis (CoMFA) [18]. The data set contained a diverse range of structures and activities selected from lit-erature [18]. ACE is a zinc metallopeptidase, which func-tions as a dipeptidyl carboxypeptidase, hydrolysing a range of oligopeptide substrates [22]. It acts to induce hypertension and is, consequently, a widely investigated target for antihypertensive drugs [23]. Several methods used to determine the ACE inhibitory activities (IC50 val-ues) involved the use of the substrate hippuryl-histidyl-leucine (HHL) [24,25]. An early method for determining ACE inhibitor activity was to measure the rate of hippuric acid production from HHL catalyzed by ACE [26]. How-ever, it was subsequently discovered that HHL is a C-ter-minal domain specific substrate of ACE [27,28]. Consequently, the structure-activity relationship shown by this data set is likely to reflect that of C-terminal domain specific ACE inhibition, rather than general ACE inhibition.
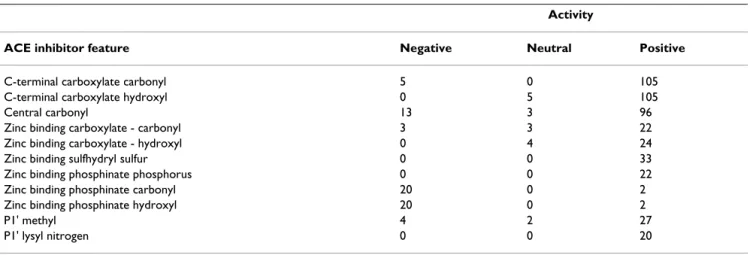
For each molecule, a TMACC interpretation was gener-ated, as described in the Methods section, leading to the labelling of each atom according to an activity banding (i.e., its contribution to activity). Some examples are shown in Figure 1. Based on the literature, several poten-tially important features (in the form of functional groups) were identified (Figure 2). Using the TMACC interpretation the extent of activity associated with each
feature was accumulated for the entire ACE data set to allow determination of the structure-activity relationship modelled (Table 3).
An essential feature of any ACE inhibitor is a zinc coordi-nating group. The catalytic zinc ion is coordinated by three highly conserved residues present in both somatic ACE (sACE) domains [29]. The important functional role of the zinc ion in the active site domains of ACE has led to the development of peptide based inhibitors, such as enalaprilat, with additional zinc-binding functional groups, including thiol, carboxylate and phosphinate groups. The importance of zinc binding functional groups in ACE inhibition has been demonstrated in crystal struc-ture and strucstruc-ture-activity studies [22,30,31].
Zinc binding groups were frequently recognized by the TMACC interpretation as positive for activity. All sulfhy-dryl sulfur atoms located in the optimal position for zinc-binding were identified as positive for activity. Analysis of phosphinate zinc binding groups showed all phosphorus atoms were identified as positive for activity. However, phosphinyl oxygen atoms were mostly shown as negative for activity. In contrast, the interpretation most frequently identified both carboxylate zinc binding group oxygen atoms to be positive for activity. Although the results do not fully capture the correlation between the type of zinc-ligand and inhibitor activity observed in structure-activity studies, (phosphinate > carboxylate > sulfhydryl) [18], perhaps the negative activity attributed to the phosphi-nate oxygen atoms reflects its weak zinc-binding ability in comparison to the other zinc binding groups.
The central carbonyl group is a feature found in most ACE inhibitors. It forms two hydrogen bonds within both domains of ACE [22,29]. Docking studies suggest this interaction is frequently present in ACE-inhibitor binding [32] and it has been identified in many ACE-inhibitor
Table 3: Frequency of activity of ACE inhibitor features as determined by the TMACC interpretation.
Activity
ACE inhibitor feature Negative Neutral Positive
C-terminal carboxylate carbonyl 5 0 105 C-terminal carboxylate hydroxyl 0 5 105 Central carbonyl 13 3 96 Zinc binding carboxylate - carbonyl 3 3 22 Zinc binding carboxylate - hydroxyl 0 4 24 Zinc binding sulfhydryl sulfur 0 0 33 Zinc binding phosphinate phosphorus 0 0 22 Zinc binding phosphinate carbonyl 20 0 2 Zinc binding phosphinate hydroxyl 20 0 2
P1' methyl 4 2 27
crystal structure complexes (Figure 3) [33]. Mutation of 513His to alanine causes a 120,000-fold decrease in the binding of lisinopril to the C-domain of sACE [34]. This suggests the interaction of the conserved histidine resi-dues with the carbonyl group of an inhibitor is important for ACE inhibition. The TMACC interpretation identified the central carbonyl as favourably contributing towards the activity (Table 3). The high frequency of positive activ-ity shown for this feature by the TMACC interpretation is consistent with the aforementioned literature.
The crystal structures of testicular ACE (tACE) in complex with various inhibitors (Figure 3) show the intermolecu-lar interactions responsible for ACE inhibition in tACE and correspondingly the C-terminal domain of sACE [22,30,33]. In contrast to most zinc protease inhibitors, which primarily rely on the strength of their zinc binding groups for activity, domain-specific ACE inhibitors utilize weak zinc binding groups and exploit both primed and unprimed sides of the active site in order to mimic peptide substrates, thereby achieving domain selective inhibition [35]. Domain-specific inhibition of ACE is important, as each domain possesses individual functions [36]. This dis-covery has developed the number of applications of ACE inhibitors, extending from treating hypertension to pro-tecting stem cells during chemotherapy [37]. A recent study has also suggested ACE may be involved in many physiological processes other than blood pressure regula-tion [38].
The two domains of sACE contain many conserved resi-dues, which are vital for substrate and inhibitor binding (Table 4). The identification of conserved residues within ACE and their role in inhibitor binding has highlighted several important features required for ACE inhibition,
providing a rationale for the structure-activity relationship of ACE inhibitors.
A C-terminal carboxylate is found in many ACE inhibi-tors. This feature interacts with several conserved residues in both domains of sACE, hydrogen bonding with tyro-sine and glutamine residues, and also forms an electro-static interaction with a lysine residue (Figure 3) [32]. Both C-terminal carboxylate oxygen atoms were identified as positive by the TMACC interpretation (Table 3). Despite the high level of conserved residues present in both domains of sACE, variation between the domains confers different substrate and inhibitor preferences. The presence of hydrophobic residues 379Val and 380Val in the S1' sub-site of the C-domain of sACE provides hydropho-bic interactions between the sub-site and the P1' residue of inhibitor molecules, such as the P1' methyl group of captopril and enalaprilat [29]. The corresponding residues found in the N-terminal domain, 357Ser and 358Thr, pro-vide a polar environment and, therefore, do not form sim-ilar hydrophobic interactions with the P1' residue of inhibitors [29,33]. In the C-terminal domain the lysyl chain of lisinopril extends into the S1' sub-site and forms an electrostatic interaction with 162Glu and a water-medi-ated interaction with 377Asp [22]. However, in the N-ter-minal domain the S1' sub-site makes fewer contacts with the lysyl chain of lisinopril (Figure 4). For example, 162Glu (C-domain) is replaced by 140Asp (N-domain), and due to the larger distance between the lysyl chain and this resi-due, no electrostatic interaction is observed at this loca-tion in the N-domain [29]. Addiloca-tionally, 377Asp (C-domain) is replaced by 355Gln (N-domain), thereby abol-ishing the water-mediated interaction shown between the lysyl residue of lisinopril and the C-domain [29]. This evi-TMACC interpretation of ACE inhibitors
Figure 1
ACE inhibitor features investigated
Figure 2
ACE inhibitor features investigated. Position of features shown in 2D relation to one another. Blue circles surround atoms studied for activity.
P
1
'
O
O
O
P
2
'
ZBG
S
H
H
C
H
H
O
O
(CH
2
)
4
N
+
H
H
H
O
P
O
C-terminal carboxylate
central carbonyl
ZBG Zinc binding group
P
1’ group
sulfhydryl
carboxylate
phosphinate/
phosphate
methyl
dence suggests that methyl and lysyl groups located in the P1' position of ACE inhibitors can form favourable inter-actions with the S1' sub-site of the C-terminal domain of sACE.
Interestingly, the TMACC interpretation identified all inhibitor P1' lysyl nitrogen atoms as favourably contribut-ing towards activity (Table 3). The interpretation also identified inhibitor P1' methyl groups as positive for activity. Thus, the TMACC interpretation identified P1' groups important for C-domain specific ACE inhibition, as illustrated in Figure 1. This C-domain specific bias in the data set, reflected by the TMACC interpretation, has not been shown in previous QSAR investigations using this data set [17,18].
Dihydrofoloate reductase (DHFR) inhibition
Due to the vital cellular function and ubiquitous expres-sion of DHFR, inhibitors of this enzyme have been used clinically in the treatment of a range of diseases [39]. A variety of antifolates, which inhibit specific DHFR enzymes, have clinical application against cancer, malaria and many infectious diseases caused by bacteria, fungi and protozoa [40]. Natural folates contain a pteridine ring system, a p-aminobenzoic acid and a glutamate moiety (Figure 5). Classical antifolates are analogous to natural folates, possessing a glutamate residue, which allows pol-yglutamylation catalyzed by folylpolyglutamate syn-thetase [41]. Methotrexate (MTX) is a classical antifolate, which has been used clinically as an anticancer drug for over 50 years [42]. MTX is a potent inhibitor of DHFR from many species. However, it is restricted to anti-tumour applications, as a consequence of the dependence Conserved ACE residues that interact with lisinopril
Figure 3
Conserved ACE residues that interact with lisinopril. A) tACE active site (green) [22]. B) The N-domain active site of sACE (purple) [29]. Zinc ion shown in magenta; atoms are coloured as follows: red for oxygen, blue for nitrogen, cyan for car-bon and grey for hydrogen.
Table 4: Conserved ACE residues important for inhibitor interactions
Functional interaction C-domain residue N-domain residue
Zinc-binding 383His 361His
Zinc-binding 387His 365His
Zinc-binding 411Glu 389Glu
Inhibitor carbonyl hydrogen bonding 513His 491His
Inhibitor carbonyl hydrogen bonding 353His 331His
Inhibitor carboxy terminal carboxylic ionic bonding 511Lys 489Lys
Inhibitor carboxy terminal carboxylic hydrogen bonding 281Gln 259Gln
Inhibitor carboxy terminal carboxylic hydrogen bonding 520Tyr 498Tyr
of classical antifolates on folate carrier-mediated trans-port, which is found only in mammalian cells [43]. Trime-trexate (TMQ) is a potent non-classical antifolate DHFR inhibitor, which is used in the treatment of Pneumocystis
infections common in AIDS patients [44].
TMACC descriptors were generated for the DHFR data set of 397 molecules, previously studied [17]. The inhibitor activity values for the DHFR data set represent inhibitor potency against rat liver DHFR. Rat liver DHFR shows a high level of conservation of both primary sequence and active site residues and, therefore, is used as a mammalian standard for DHFR inhibition [45]. Following the strategy adopted for the ACE inhibitors, TMACC interpretations were developed for the DHFR inhibitors (Figure 6). Based on the literature, several DHFR inhibitor features were identified (Figure 7) and the association of each feature with activity was extracted from the TMACC interpreta-tion and accumulated for the entire data set (Table 5). Crystal structures of DHFR-inhibitor complexes for many species have revealed conserved binding residues and have provided a basis for the design of selective DHFR
inhibitors [46]. Many DHFR inhibitors have been synthe-sized by modification of the structural components of folate. For example, MTX differs by replacement of the 4-oxo with a 4-amino group and an additional N10 methyl group. There are several conserved residues within the DHFR active site [46-48] that facilitate the binding of DHFR inhibitors (Table 6).
An important feature for DHFR inhibition is a 2,4-diamino-substituted pyrimidine ring [49]. The 2-amino and 4-amino groups form hydrogen bonds with highly conserved residues, which orientate the pteridine ring of the inhibitor accordingly. The orientation of inhibitor binding differs from natural folate binding. Although both involve 30Glu, the orientation of the inhibitor allows extensive hydrogen bonding with other DHFR residues, which is not possible in the folate binding orientation. Binding of inhibitors containing 2,4-diaminopyrimidine shows the 2-amino group forms a hydrogen bond with 30Glu [50]. Additionally, the 4-amino group of the inhib-itor forms strong hydrogen bonds with the carbonyl groups of 7Ile and 115Val [46,50]. The protonated form of N1 forms an electrostatic interaction with 30Glu [47,51]. Comparison of the S1' sub-site residues which bind the lysyl group of lisinopril
Figure 4
Chemical structures of folates and antifolates
Figure 5
Chemical structures of folates and antifolates. A) folic acid (DHFR substrate). B) methotrexate (classical antifolate DHFR inhibitor). C) trimetrexate (non-classical antifolate DHFR inhibitor).
N
H
2N
H
N
O
N
N
N
H
O
N
H
O
O
H
O
OH
N
H
2N
H
N
N
N
N
O
N
H
O
O
H
O
OH
CH
3NH
2N
H
2N
H
N
N
NH
2H
N
O
C
H
3O
CH
3O
CH
3CH
3(A)
(B)
The N8 nitrogen of the pteridine ring forms a conserved network with a water molecule, which also hydrogen bonds with 30Glu and 24Trp [46,52]. However, compari-son of pyrido [2,3-d]pyrimidines and quinazolines sug-gests that the presence of the N8 hydrogen bond in inhibition by pyrido [2,3-d]pyrimidines may restrict the position of any bridge substituent, such as 9 or 10 methyl groups, preventing hydrophobic interaction of these fea-tures with the DHFR active site [53,54]. Therefore, in gen-eral quinazoline DHFR inhibitors are more potent than pyrido [2,3-d] pyrimidine analogues.
The TMACC interpretation showed variable activity for the 2-amino group, with the activity approximately evenly
distributed between negative and positive activity. How-ever, interpretation of the 4-amino group showed a greater frequency of positive activity. The interpretation showed the N1 nitrogen as generally negative for activity. This classification could possibly result from the fact that the N1 was unprotonated within most molecules of the data set. However, studies suggest the protonated form of N1 forms a salt bridge with the DHFR active site [51,55]. Comparison of the activity of C8 atoms in quinazoline inhibitors to N8 atoms in pyrido [2,3-d]pyrimidine inhib-itors assigned by the TMACC interpretation showed the C8 atom of quinazoline inhibitors to be identified as pos-itive for activity, whilst the N8 of pyrido [2,3-d]pyrimi-dines was most frequently negative for activity. This interpretation reflects experimental evidence, which indi-cates the presence of a C8 (quinazoline) is more potent for DHFR inhibition than an N8 (pyrido [2,3-d]pyrimi-dine) [56].
The presence of a 5-methyl group increases inhibitor potency by forming hydrophobic interactions with 115Val in human DHFR [53]. Methyl groups in the 9 and 10 posi-tions of the bridge region also improve DHFR inhibitor potency, as the environment surrounding the bridge region is generally hydrophobic. Therefore, hydrophobic interactions with 22Leu may be formed by these groups [47]. The benzyl ring featured in many antifolate inhibi-tors forms hydrophobic contacts with many residues within the DHFR active site [46,51]. This feature is often
Table 5: Analysis of the TMACC interpretation of the DHFR data set.
Activity
DHFR inhibitor feature Negative Neutral Positive
2-amino nitrogen 155 81 161 4-amino nitrogen 110 61 212 N1-nitrogen 307 58 32 C8 Quinazoline 0 5 45 N8 Pyrido [2,3-d]pyrimidine 68 16 11 5-methyl 1 0 64 9-methyl 0 1 16 10-methyl 10 3 57 Benzylmethoxy - methyl 5 6 392 Table shows frequency of activity of DHFR inhibitor features as determined by the TMACC interpretation
TMACC interpretation of DHFR inhibitors
Figure 6
substituted for other aromatic rings and methoxy groups to increase hydrophobic interactions.
The TMACC interpretation identified 5-methyl groups as positive for activity, consistent with experimental data, which suggests this feature is important for the inhibition of human DHFR. The interpretation also identified methyl groups in the 9 and 10 positions as positive for activity. This is consistent with the known hydrophobic interactions formed by these features within the DHFR active site [47]. The TMACC interpretation identified the methyl of methoxybenzyl groups substituted around the
benzoic acid moiety of inhibitor molecules as positive for activity. This classification is supported by the hydropho-bic interactions in which methoxy groups have been shown to participate within the DHFR active site [46,51]. The TMACC interpretation of the DHFR data set identified many key structural features for DHFR inhibition. The analysis suggests that the hydrophobic groups investi-gated were more frequently identified as positive for activ-ity than the hydrogen bonding groups investigated (Figure 6).
Conclusion
Analyses of the TMACC QSARs modelled for the ACE and DHFR data sets have shown that the TMACC interpreta-tion can identify distinctive features of a structure-activity relationship. The TMACC interpretation provided a clear and precise representation of the activity of specific groups. Amalgamation of the atomic activity values deter-mined for such groups within a data set, showed strong correlation with experimental evidence, which shows the TMACC interpretation can produce models which accu-rately depict the features of a structure-activity relation-ship.
Overall, the TMACC interpretation modelled the ACE inhibitor structure-activity relationship highlighted important features for C-domain selective ACE inhibition. The TMACC interpretation provided a consistent repre-sentation of the structure-activity relationship present in DHFR inhibitor features investigated
Figure 7
DHFR inhibitor features investigated. Position of features shown in 2D relation to one another. Blue circles surround atoms which were studied for activity. Methoxy groups located at all positions of the benzyl ring were studied.
N
H
2
N
N
NH
2
CH
3
8
9 10
CH
3
CH
3
O CH
3
4-amino
5-methyl
9-methyl
2-amino
10-methyl
Benzylmethoxy
}
}
C8 Quinazoline
N8 Pyrido[2,3-d]pyrimidine
Table 6: Important human DHFR residues for inhibitor binding
Functional interaction DHFR residue
2-amino hydrogen bonding 30Glu
4-amino hydrogen bonding 7Ile
4-amino hydrogen bonding 115Val
N1 hydrogen bonding 30Glu
Pteridine ring hydrophobic interactions 22Leu
Pteridine ring hydrophobic interactions 31Phe
Pteridine ring hydrophobic interactions 34Phe
Benzene ring hydrophobic interactions 22Leu
Benzene ring hydrophobic interactions 31Phe
Benzene ring hydrophobic interactions 34Phe
Benzene ring hydrophobic interactions 61Pro
5-methyl hydrophobic interactions 115Val
9-methyl and 10-methyl hydrophobic interactions 22Leu
the ACE data set. However, the insight into the structure-activity relationship of ACE inhibitors produced by the TMACC interpretation was limited by the size of the data set. To obtain a more detailed analysis of components important or detrimental to the ACE inhibitor structure-activity relationship, it would be necessary to investigate a data set which represents a comprehensive range of func-tional groups and structural components. Investigation of the activity of features important for C-terminal domain selective inhibition in comparison to features important for N-terminal domain selective inhibition would provide further insight into the interpretive ability of the TMACC descriptors.
An inherent weakness, due to the 2D nature of the TMACC descriptor, is insensitivity to chirality. However, the use of chirality descriptors derived from topological data may provide a solution to this limitation and may also improve the predictive ability of the QSAR models [57]. Investigation of alternative or additional atomic properties used in the TMACC descriptor would provide an insight into the properties which contribute towards activity. The effect of implementing more sophisticated partial charge calculations would be interesting, as a recent study has suggested that the method used for par-tial charge calculations can affect QSAR predictive accu-racy [58]. Investigation of a wider range of data sets would provide further validation of the utility of the TMACC interpretation.
Competing interests
The authors declare that they have no competing interests.
Authors' contributions
JDH conceived the study, suggested specific analyses and contributed to the drafting of the manuscript. BMS per-formed the calculations and analysis and drafted the man-uscript. CLB wrote the NCW utility, which facilitated the calculations. All authors have read and approved the final version of the manuscript.
Acknowledgements
We thank GSK for partial funding of a PhD studentship for CLB. We thank Abrar Hussain for technical assistance and helpful discussion. We thank James Melville for the development of the TMACC descriptors and related software. We thank ChemAxon for a license for Marvin.
References
1. Johnson MA, Maggiora GM: Concepts and applications of molecular sim-ilarity New York, NY, USA: John Wiley and Sons; 1990.
2. Guha R: On the interpretation and interpretability of quanti-tative structure-activity relationships. J Comput Aided Mol Des
2008, 22:857-871.
3. Gedeck P, Rohde B, Bartels C: QSAR - how good is it in practice? Comparison of descriptor sets on an unbiased cross section of corporate data sets. J Chem Inf Model 2006, 46:1924-1936. 4. Brown RD, Martin YC: Use of structure-activity data to
com-pare structure-based clustering methods and descriptors for
use in compound selection. J Chem Inf Comput Sci 1996,
36:572-584.
5. Hansch C: A quantitative approach to biological structure-activity relationships. Acct Chem Res 1969, 2:232-239.
6. Wold H: Soft modelling: The basic design and some exten-sion. In Systems under indirect observations: Causality, structure, predic-tion Edited by: Joerskog KG, Wold H. Amsterdam: North Holland; 1982:1-54.
7. Stanton DT: On the physical interpretation of QSAR models.
J Chem Inf Comput Sci 2003, 43:1423-1433.
8. Guha R, Jurs PC: Development of QSAR models to predict and interpret the biological activity of artemisinin analogues. J Chem Inf Comput Sci 2004, 44:1440-1449.
9. Melville JL, Hirst JD: TMACC: Interpretable correlation descriptors for quantitative structure-activity relationships.
J Chem Inf Model 2007, 47:626-634.
10. Pastor M, Cruciani G, Mclay I, Pickett S, Clementi S: Grid-independ-ent descriptors (GRIND): A novel class of alignmGrid-independ-ent-inde- alignment-inde-pendent three-dimensional molecular descriptors. J Med Chem 2000, 43:3233-3243.
11. Moreau G, Broto P: The autocorrelation of a topological struc-ture: A new molecular descriptor. Nouv J Chim 1980, 4:359-360. 12. Golbraikh A, Tropsha A: Beware of q(2)! J Mol Graphics Modell
2002, 20:269-276.
13. Hawkins DM, Basak SC, Mills D: Assessing model fit by cross-val-idation. J Chem Inf Comput Sci 2003, 43:579-586.
14. Hawkins DM: The problem of overfitting. J Chem Inf Comput Sci
2004, 44:1-12.
15. Faber NKM: Estimating the uncertainty in estimates of root mean square error of prediction: Application to determining the size of an adequate test set in multivariate calibration.
Chemom Intell Lab Syst 1999, 49:79-89.
16. Johnson SR: The trouble with QSAR (or how I learned to stop worrying and embrace fallacy). J Chem Inf Model 2008, 48:25-26. 17. Sutherland JJ, O'Brein LA, Weaver DF: Comparison of methods for modelling quantitative structure-activity relationships. J Med Chem 2004, 47:5541-5554.
18. DePriest SA, Mayer D, Naylor CB, Marshall GR: 3D-QSAR of angi-otensin-converting enzyme and thermolysin inhibitors - a comparison of CoMFA models based on deduced and exper-imentally determined active-site geometries. J Am Chem Soc
1993, 115:5372-5384.
19. Gasteiger J, Marsili M: Iterative partial equalization of orbital electronegativity - a rapid access to atomic charges. Tetrahe-dron 1980, 36:3219-3228.
20. Hou TJ, Xia K, Zhang W, Xu XJ: Adme evaluation in drug discov-ery. 4. Prediction of aqueous solubility based on atom contri-bution approach. J Chem Inf Comput Sci 2004, 44:266-275. 21. Wildman SA, Crippen GM: Prediction of physicochemical
parameters by atomic contributions. J Chem Inf Comput Sci
1999, 39:868-873.
22. Natesh R, Schwager SL, Sturrock ED, Acharya KR: Crystal struc-ture of the human ace-lisinopril complex. Nature 2003,
421:551-554.
23. Borer JS: Angiotensin-converting enzyme inhibition: A land-mark advance in treatment for cardiovascular disease. Eur Heart J Suppl 2007, 9:E2-E9.
24. Patchett AA, Harris E, Tristram EW, Wyvratt MJ, Wu MT, Taub D, Peterson ER, Ikeler TJ, Tenbroeke J, Payne LG, Ondeyka DL, Thorsett ED, Greenlee WJ, Lohr NS, Hoffsommer RD, Joshua H, Ruyle WV, Rothrock JW, Aster SD, Maycock AL, Robinson FM, Hirschmann R, Sweet CS, Ulm EH, Gross DM, Vassil TC, Stone CA: A new class of angiotensin-converting enzyme-inhibitors. Nature 1980,
288:280-283.
25. Ondetti MA, Cushman DW: Angiotensin-converting enzyme-inhibitors - biochemical properties and biological actions.
CRC Critical Reviews in Biochemistry 1984, 16:381-411.
26. Cushman DW, Cheung HS: Spectrophotometric assay and properties of angiotensin-converting enzyme of rabbit lung.
Biochem Pharmacol 1971, 20:1637-1648.
Open access provides opportunities to our colleagues in other parts of the globe, by allowing
anyone to view the content free of charge.
Publish with
Chemistry
Central and every
scientist can read your work free of charge
W. Jeffery Hurst, The Hershey Company. available free of charge to the entire scientific community peer reviewed and published immediately upon acceptance cited in PubMed and archived on PubMed Central yours you keep the copyright
Submit your manuscript here:
http://www.chemistrycentral.com/manuscript/ 28. Wei L, AlhencGelas F, Corvol P, Clauser E: The 2 homologous
domains of human angiotensin-I-converting enzyme are both catalytically active. J Biol Chem 1991, 266:9002-9008. 29. Corradi HR, Schwager SL, Nchinda AT, Sturrock ED, Acharya KR:
Crystal structure of the N domain of human somatic angi-otensin I-converting enzyme provides a structural basis for domain-specific inhibitor design. J Mol Biol 2006, 357:964-974. 30. Mayer D, Naylor CB, Motoc I, Marshall GR: A unique geometry of
the active site of angiotensin-converting enzyme consistent with structure-activity studies. J Comput Aided Mol Des 1987,
1:3-16.
31. Natesh R, Schwager SLU, Evans HR, Sturrock ED, Acharya KR:
Structural details on the binding of antihypertensive drugs captopril and enalaprilat to human testicular angiotensin I-converting enzyme. Biochemistry 2004, 43:8718-8724.
32. Tzakos AG, Gerothanassis IP: Domain-selective ligand-binding modes and atomic level pharmacophore refinement in angi-otensin I converting enzyme (ACE) inhibitors. Chem Biochem
2005, 6:1089-1103.
33. Corradi HR, Chitapi I, Sewell BT, Georgiadis D, Dive V, Sturrock ED, Acharya KR: The structure of testis angiotensin-converting enzyme in complex with the C domain-specific inhibitor RXPA380. Biochemistry 2007, 46:5473-5478.
34. Fernandez M, Liu X, Wouters MS, Heyberger S, Husain A: Angi-otensin I-converting enzyme transition state stabilization by His(1089): Evidence for a catalytic mechansim distinct from other gluzincin metalloproteinases. J Biol Chem 2001,
276:4998-5004.
35. Dive V, Georgiadis D, Matziari M, Makaritis A, Beau F, Cuniasse P, Yiotakis A: Phosphinic peptides as zinc metalloproteinase inhibitors. Cell Mol Life Sci 2004, 61:2010-2019.
36. van Esch JHM, Tom B, Dive V, Batenburg WW, Georgiadis D, Yiotakis A, van Gool JMG, de Bruijn RJA, de Vries R, Danser AHJ: Selective angiotensin-converting enzyme c-domain inhibition is suffi-cient to prevent angiotensin I-induced vasoconstriction.
Hypertension 2005, 45:120-125.
37. Azizi M, Rousseau A, Ezan E, Guyene TT, Michelet S, Grognet JM, Len-fant M, Corvol P, Menard J: Acute angiotensin-converting enzyme inhibition increases the plasma level of the antural stem cell regulator N-acetyl-seryl-aspartyl-lysyl-proline. J Clin Invest 1996, 97:839-844.
38. Shen XZ, Xiao HD, Li P, Lin CX, Billet S, Okwan-Duodu D, Adams JW, Bernstein EA, Xu Y, Fuchs S, Bernstein KE: New insights into the role of angiotensin-converting enzyme obtained from the analysis of genetically modified mice. Journal of Molecular Medicine-Jmm 2008, 86:679-684.
39. Kamen B: Folate and antifolate pharmacology. Semin Oncol
1997, 24:30-S18.
40. Schweitzer BI, Dicker AP, Bertino JR: Dihydrofolate-reductase as a therapeutic target. FASEB J 1990, 4:2441-2452.
41. Kompis IM, Islam K, Then RL: DNA and RNA synthesis: Anti-folates. Chem Rev 2005, 105:593-620.
42. Curtin NJ, Hughes AN: Pemetrexed disodium, a novel anti-folate with multiple targets. Lancet Oncol 2001, 2:298-306. 43. Allegra CJ, Kovacs JA, Drake JC, Swan JC, Chabner BA, Masur H:
Potent invitro and invivo antitoxoplasma activity of the lipid-soluble antifolate trimetrexate. J Clin Invest 1987, 79:478-482. 44. Lane HC, Laughon BE, Falloon J, Kovacs JA, Davey RT, Polis MA,
Masur H: Recent advances in the management of AIDS-related opportunistic infections. Ann Intern Med 1994,
120:945-955.
45. Wang YH, Bruenn JA, Queener SF, Cody V: Isolation of rat dihy-drofolate reductase gene and characterization of recom-binant enzyme. Antimicrob Agents Chemother 2001, 45:2517-2523. 46. Klon AE, Heroux A, Ross LJ, Pathak V, Johnson CA, Piper JR, Borhani
DW: Atomic structures of human dihydrofolate reductase complexed with NADPH and two lipophilic antifolates at 1.09 angstrom and 1.05 angstrom resolution. J Mol Biol 2002,
320:677-693.
47. Cody V, Galitsky N, Luft JR, Pangborn W, Gangjee A, Devraj R, Queener SF, Blakley RL: Comparison of ternary complexes of pneumocystis carinii and wild-type human dihydrofolate reductase with coenzyme NADPH and a novel classical anti-tumor furo[2,3-d]pyrimidine antifolate. Acta Crystallographica Section D-Biological Crystallography 1997, 53:638-649.
48. Pignatello R, Guccione S, Forte S, Di Giacomo C, Sorrenti V, Vicari L, Barretta GU, Balzano F, Puglisi G: Lipophilic conjugates of meth-otrexate with short-chain alkylamino acids as DHFR inhibi-tors. Synthesis, biological evaluation, and molecular modeling. Bioorg Med Chem 2004, 12:2951-2964.
49. Richter WE, McCormac JJ: Inhibition of mammalian dihydro-folate-reductase by selected 2,4-diaminoquinazolines and related compounds. J Med Chem 1974, 17:943-947.
50. Oefner C, Darcy A, Winkler FK: Crystal-structure of human dihydrofolate-reductase complexed with folate. Eur J Biochem
1988, 174:377-385.
51. Kovalevskaya NV, Smurnyy YD, Polshakov VI, Birdsall B, Bradbury AF, Frenkiel T, Feeney J: Solution structure of human dihydrofolate reductase in its complex with trimethoprim and NADPH. J Biomol NMR 2005, 33:69-72.
52. Bolin JT, Filman DJ, Matthews DA, Hamlin RC, Kraut J: Crystal-structures of escherichia-coli and lactobacillus-casei dihydro-folate-reductase refined at 1.7 Å resolution .1. General fea-tures and binding of methotrexate. J Biol Chem 1982,
257(22):13650-13662.
53. Gangjee A, Vidwans AP, Vasudevan A, Queener SF, Kisliuk RL, Cody V, Li RM, Galitsky N, Luft JR, Pangborn S: Structure-based design and synthesis of lipophilic 2,4-diamino-6-substituted quina-zolines and their evaluation as inhibitors of dihydrofolate reductases and potential antitumor agents. J Med Chem 1998,
41:3426-3434.
54. Cody V, Galitsky N, Luft JR, Pangborn W, Queener SF, Gangjee A:
Analysis of quinazoline and pyrido[2,3-d]-pyrimidine n9-c10 reversed-bridge antifolates in complex with NADP(+) and pneumocystis carinii dihydrofolate reductase. Acta Crystallo-graphica Section D-Biological Crystallography 2002, 58:1393-1399. 55. Bennett B, Langan P, Coates L, Mustyakimov M, Schoenborn B,
How-ell EE, Dealwis C: Neutron diffraction studies of escherichia coli dihydrofolate reductase complexed with methotrexate.
Proc Natl Acad Sci USA 2006, 103:18493-18498.
56. Gangjee A, Adair O, Queener SF: Synthesis of 2,4-diamino-6-(thioarylmethyl)pyrido [2,3-d]pyrimidines as dihydrofolate reductase inhibitors. Bioorg Med Chem 2001, 9:2929-2935. 57. Golbraikh A, Tropsha A: QSAR modeling using chirality
descriptors derived from molecular topology. J Chem Inf Com-put Sci 2003, 43:144-154.