Informatics Analysis of Genetic Variants in Newborn Screening By
Chelsea Gustafson
Senior Honors Thesis Biology
University of North Carolina at Chapel Hill
Approved:
Jonathan Berg, Thesis Advisor Terry Furey, Reader
Introduction
Newborn screening (NBS) is a well-known and widely accepted activity in public health. The majority of babies born in the United States are screened via a biochemical blood test for conditions that are difficult to diagnose but require treatment soon after birth1. NBS began in the 1960s as a blood test for phenylketonuria (PKU) and additional disorders were added to the screening panel as technological advancements, such as tandem mass spectrometry (MS/MS), improved detection of many metabolic disorders2. Based on the guidelines set forth by the American College of Medical Genetics, the U.S. Department of Health Secretary’s Advisory Committee on Heritable Disorders in
Newborns and Children selects disorders for the recommended uniform screening panel (RUSP) if (1) they can be detected 24-48 hours after birth and would not otherwise be detected, (2) there is reliable screening method with appropriate sensitivity and
specificity and (3) there are benefits of early detection and treatment3.
NBS has been successful; however, the technology used in medicine is quickly advancing and NBS programs are faced with the challenge of incorporating new technology into their screening protocol to improve detection of disorders4. Next generation sequencing (NGS), including whole exome sequencing (WES), is one of these new technologies. WES identifies the DNA sequence of the coding region of the genome, where it is believed 85% of disease causing genetic variation occurs5. With its relatively low cost and ability to provide detailed genetic information, WES is quickly becoming a tool with the potential to revolutionize public health, however, the impact of its use in the clinic for the benefit on overall health remains unknown6
There are many potential benefits of incorporating WES into NBS as a majority of the disorders currently screened for are caused by rare recessive genetic variants. By identifying the genetic factors causing the disorder, a physician can tailor treatment to the specific needs of the patient. For example, at least 400 mutations in the PAH gene lead to PKU and there are different treatments for the disorder depending on the type of mutation7. In addition to using WES to identify the presence of disorders currently
screened for, it could be used to screen for other conditions that fit the RUSP criteria but currently lack a screening method. Adding new disorders to the screening panel,
however, would require careful consideration of the long-term ethical and psychological effects of a diagnosis as well as the degree to which the disorder is medically
actionable8.
Three challenges must be addressed before NGS can be incorporated into NBS. First, the ability of NGS to detect disorders screened for in NBS must be compared to the current method. Second, additional disorders that cannot be detected by traditional screening methods, but can be detected through NGS, should be investigated for potential addition to NBS. Lastly, if NGS is incorporated into NBS and additional
disorders are added to the screening panel, information about NGS should be provided to parents to help them make informed choices to understand the implications of their decisions.9
disorders must be analyzed. In other words, WES has been useful when a patient has symptoms that suggest a link to a genetic variant, but its ability to identify conditions when applied to the general population must be investigated. The presence of a variant in a gene associated with a disorder is not enough to indicate that an individual has the disorder. There are silent and synonymous variants that do not affect gene function as well as variants of uncertain significance (VUS) that have unknown effects on
phenotype. In the development of a genetic screening test, it is crucial that the test be able to detect the presence of a condition but not return many false positives. Which variants best indicate a positive test result must be determined, and many variables must be considered, such as (1) the type, location and frequency of the variant, (2) whether the variant is known to be pathogenic or not and (3) the consequences of providing a false positive for the associated condition.
The selection criteria for which genetic variants are expected to indicate a positive test result in NBS must be analyzed for each gene associated with a RUSP condition to create a screening test with a high positive predictive value (PPV). The PPV of a screening test is the proportion of positive results that are true positives and it is calculated from the sensitivity and the specificity of the test as well as the prevalence of the condition screened for11. Sensitivity is how well a screening test identifies those who have the condition (true positive rate), and specificity is how well it identifies those without the condition (true negative rate)12.
that require different types of variants to indicate a positive screen. As the VSAs include more possible types of variants, the predicted sensitivity of the VSA increases because the criteria necessary for a positive screen becomes more lenient thus increasing the possibility of identifying all disease causing variants. The VSAs will be applied to the exome sequence data of a population not expected to have any of the RUSP disorders. Thus, any variant detected by the algorithms will be a false positive. For each gene, the specificity and the false positive rate (1-specificity) will be calculated for every VSA based on the number of positive screens returned. The false positive rate will then be compared to the sensitivity of the VSA in a receiver operating characteristic (ROC) curve to estimate the PPV of the VSA in each gene.
ROC curves allow one to tailor the sensitivity cutoff for a screening test to ensure that high sensitivity does not sacrifice specificity13. This is particularly important in NBS, since a test with high sensitivity and low specificity would identify all disease causing variants but would return too many false positives. A screening test with low sensitivity and high specificity would not return many false positives but would miss too many disease causing variants, in other words, it would return false negatives. The ROC curves for each gene will be analyzed and used to tailor the appropriate of screening tests for each gene depending on the downstream clinical implications of a positive test result.
Method
Exome Sequences
from the North Carolina Clinical Genomic Evaluation by Next-gen Exome Sequencing (NCGENES) project that conducted WES on individuals with conditions such as cancer, cardiogenetic diseases, neurodevelopmental disorders, and retinal diseases14.
The annotated variants from the NCGENES exome sequences were accessed through a Postgres-SQL database15. Variants accessed from the database were annotated with the type of mutation, National Center for Biotechnology Information ClinVar database16 classification, Human Genome Mutation Database17 (HGMD) classification, conserved functional domain from the RefSeq database18 and the maximum allele frequency from the Exome Aggregation Consortium (EXAC)19. Prevalence of the Conditions
The prevalences of the 25 selected RUSP disorders20 were estimated based on the overall prevalence from the study “Birth prevalence of disorders detectable through newborn screening by race/ethnicity” 21 which investigated the prevalence of these disorders in newborns in California. The prevalences from this study were useful, because California is a good representation of the general population as it is a large state with a diverse population. The prevalences of each condition were rounded down and the associated genes were placed in groups according to those prevalences (see
Appendix I). The associated genes were grouped as prevalences of !
!",!!!
,
!
!"",!!!
, and
!
prevalence of disease. If a variant has a maximum allele frequency higher than the calculated allele frequency for the disorder then the variant is believed be more common than the disease-causing variant.
Table. 1 The prevalence groupings and calculated frequency for each gene.
*Variants in HBB are more common in African populations
Variant Selection Algorithms (VSAs)
Since this study screened for recessive conditions, an individual must have two variants in the same gene that meet the criteria specified by the VSA in order to return a positive result. The VSAs also only selected variants if the EXAC maximum allele
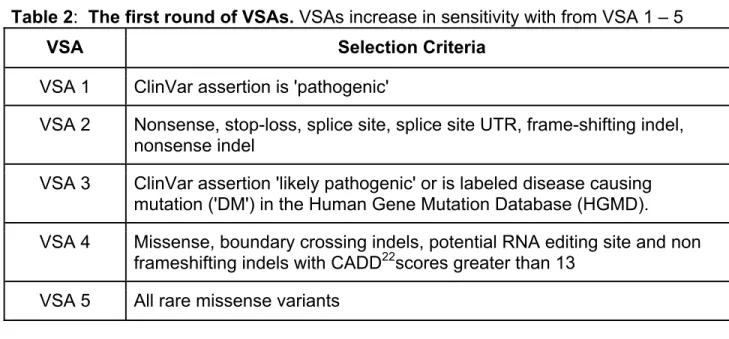
frequency was below the calculated allele frequency for the prevalence group of the associated condition. Five VSAs were used in the first round(Table 2). The VSAs increase in sensitivity with VSA 1 as the least sensitive and VSA 5 as the most
sensitive. For example, VSA1 is the least sensitive because it only allows variants that are labeled ‘pathogenic’ to count as a positive screen. VSA 2 increases in sensitivity as it allows the types of mutations that are often disease causing to count as a positive screen but may not be labeled ‘pathogenic’. Although it may seem reasonable to only screen for variants that are known to be pathogenic, a screening test must also be able to identify novel variants that would cause a RUSP disorder. The VSAs are also
Prevalence Frequency
Limit Genes
1/10,000 0.01* HBB
1/100,000 0.003
ACADM, ACADVL, BTD, GALT, MUT, PAH, SLC22A5, MCCC1, MCCC2, MMAA, MMAB
1/1,000,000 0.001
additive, so VSA 2 includes all variants that matched the selection criteria for VSA 2 as well as the selection criteria for VSA 1.
Table 2: The first round of VSAs. VSAs increase in sensitivity with from VSA 1 – 5 VSA Selection Criteria
VSA 1 ClinVar assertion is 'pathogenic'
VSA 2 Nonsense, stop-loss, splice site, splice site UTR, frame-shifting indel, nonsense indel
VSA 3 ClinVar assertion 'likely pathogenic' or is labeled disease causing mutation ('DM') in the Human Gene Mutation Database (HGMD). VSA 4 Missense, boundary crossing indels, potential RNA editing site and non
frameshifting indels with CADD22scores greater than 13 VSA 5 All rare missense variants
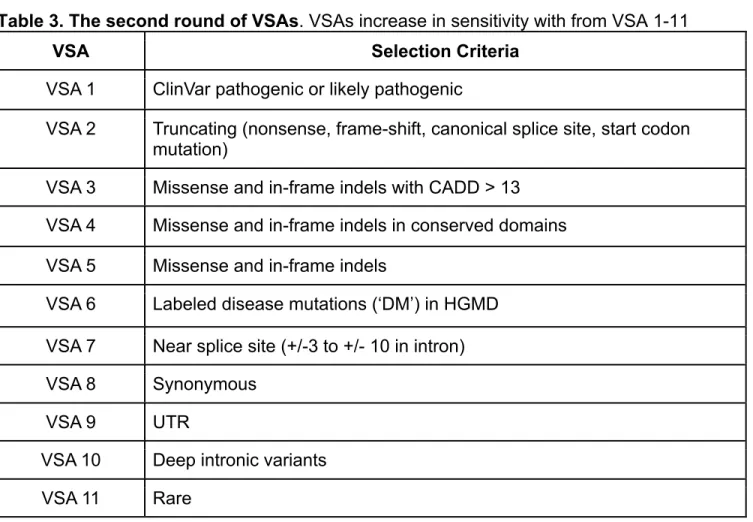
Table 3. The second round of VSAs. VSAs increase in sensitivity with from VSA 1-11
VSA Selection Criteria
VSA 1 ClinVar pathogenic or likely pathogenic
VSA 2 Truncating (nonsense, frame-shift, canonical splice site, start codon mutation)
VSA 3 Missense and in-frame indels with CADD > 13
VSA 4 Missense and in-frame indels in conserved domains
VSA 5 Missense and in-frame indels
VSA 6 Labeled disease mutations (‘DM’) in HGMD
VSA 7 Near splice site (+/-3 to +/- 10 in intron)
VSA 8 Synonymous
VSA 9 UTR
VSA 10 Deep intronic variants
VSA 11 Rare
Receiver Operating Characteristic (ROC) Curve Analysis
The specificity of the individual VSAs for each gene was calculated using the number of false positives detected.
For both rounds, the VSAs, with increasing sensitivity (true positive rate), were plotted against the false positive rate (1 – specificity) to produce a curve similar to a ROC curve for each gene. ROC curves compare the sensitivity and false positive rate of a
screening test and are used to estimate the predictive strength of a test by calculating the area under the curve24. More area under the curve indicates a better predictive
value of the test. The curves for each gene can be used to assign a sensitivity cutoff that provides a test with the highest predictive value.
Fig. 1
A model Receiver Operating
Characteristic Curve (ROC)25. Sensitivity (true positive rate) is plotted on the y-axis against 1-specificty (false positive rate) on the x-axis. The predictive strength of a screening test can be estimated by calculating the area under the curve. A is the screening test with the strongest
predictive power with no false positives detected at the highest sensitivity and the area under the curve equal to 1. C is the screening test with poorest predictive power with the area under the curve equal to 0.5.
Results
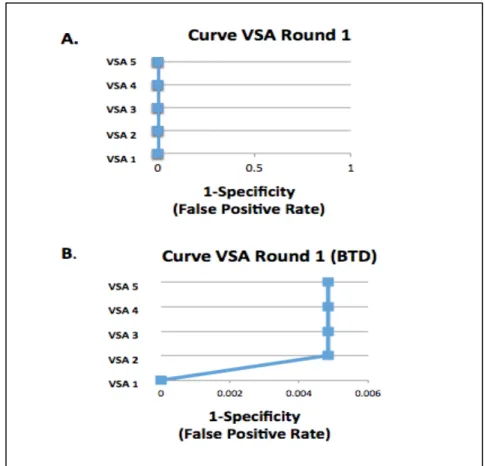
The first round of VSAs returned fewer positive results than the second round of more sensitive VSAs overall. For the gene BTD, both rounds of VSAs returned positive results. Actually, the first round of VSAs returned positive results only for BTD in VSAs 2-5 (Fig.2B), and did not return positive results for any other genes (Fig.2A).
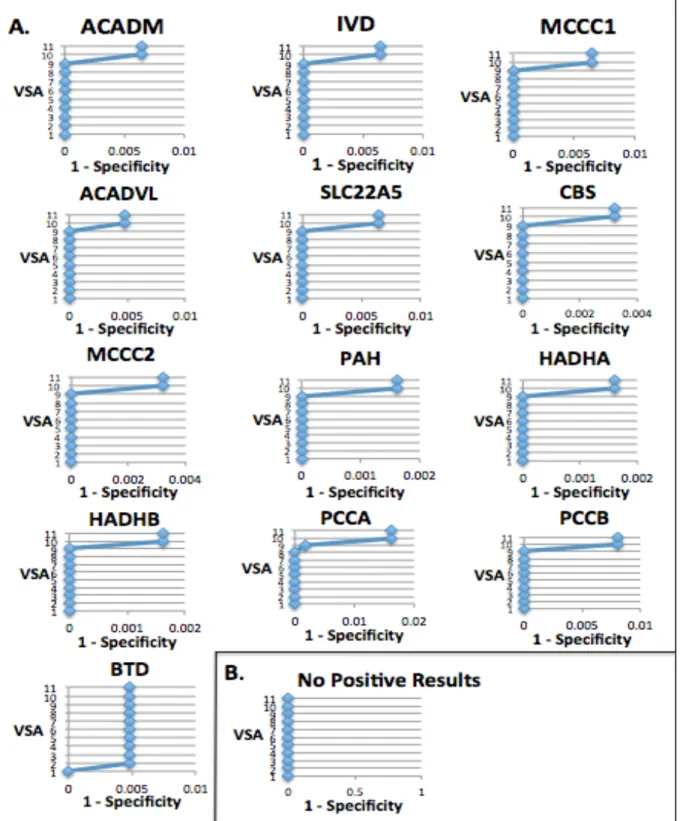
The second round of VSAs (Fig. 3) returned the most positive results (Fig. 3 A) in VSA10 and VSA11, which screened for deep intronic variants and any rare variant, respectively. Most genes did not have any positive results for the other VSAs besides VSA10 and VSA11. The exceptions were BTD, which had positive results for VSAs 2-11 and PCAA, which had positive results for VSAs 9-11.
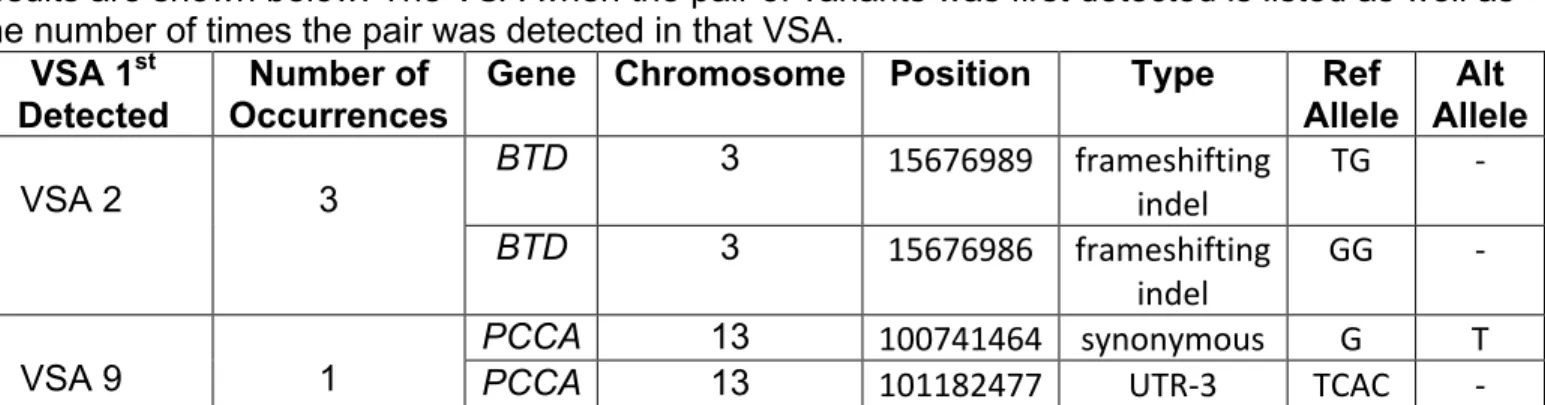
Table 4. Positive screen results for round 2 VSAs 1-9. The genes BTD and PCCA were the only genes to return positive results in any of the VSAs besides VSA10 and VSA 11. These results are shown below. The VSA when the pair of variants was first detected is listed as well as the number of times the pair was detected in that VSA.
VSA 1st
Detected Occurrences Number of Gene Chromosome Position Type Allele Ref Allele Alt
VSA 2
3
BTD 3 15676989' frameshifting'
indel' TG' 7'
BTD 3 15676986' frameshifting'
indel' GG' 7'
VSA 9 1
PCCA 13 100741464' synonymous' G' T'
PCCA 13 101182477' UTR73' TCAC' 7'
The gene BTD is associated with biotinidase deficiency and the gene PCCA is associated with propionic acidemia. The variants were not found on the EXAC database and are likely to be rare non-pathogenic variants. Although none of the detected variants were found in the database, a pathogenic missense variant (rs119103232) G to A
substitution was found to occur at the same location as the detected variant on
chromosome 3 position 15676986 in the gene BTD26. There is a mild and severe form of biotinidase deficiency (Appendix I) and it is possible that the detected variants are
possibly associated with the mild form of the disorder. The variants detected in the gene BTD could also be hypomorphic and require an additional severe mutation in the other
Discussion
The specificity was high for the most sensitive VSAs in both rounds of VSAs applied. This suggests that a genetic screening test for NBS disorders could have high sensitivity without jeopardizing specificity. The high level of specificity, even for the most sensitive VSAs, may be because the NBS disorders are recessive disorders and two variants in a gene were required to meet the selection criteria in order to indicate a positive result. Additionally, as these are rare disorders, it would be unlikely that
someone without the disease would have two rare variants in the same gene due to low allele frequencies.
It is reasonable that VSA10 and VSA 11 in the second round of VSAs returned the most positive screens, as they were the most sensitive VSAs. VSA 10 screened for deep intronic variants and VSA 11 screened for any rare variant. Introns do not code for protein and any variant that is deep in the intron and not near an exon splice site is not likely to affect phenotype. Often, VSA 10 and VSA 11 returned the same amount of positive screens in each VSA, which is also reasonable because there are not many other types of variants besides those already screened for in VSA 1-10.
Future studies could further increase the sensitivity of the VSAs by allowing the frequency requirements to be more lenient and monitoring the effect on specificity. The calculated variant allele frequencies, used as a cutoff for the selected variants, were calculated using the prevalences from the prevalence groupings. In an attempt to reduce the number of variants above the variant allele frequency for a gene, the
100,000. Because the variant allele frequency for all genes in that group was based on the variant allele frequency for a prevalence of 1 out of 100,000, variants in GALT detected with maximum allele frequency at the frequency for the prevalence of 5 out of 100,000 but above the group frequency would not be included as a positive result. Additionally, variants had to be at a maximum allele frequency less than the calculated variant frequency, so a variant with maximum allele exactly at the calculated variant frequency would not be included as a positive result.
Issues regarding frequency can be investigated by being more lenient with the variant allele frequencies required. Each VSA could have two versions, one with a strict variant allele frequency and another with a more lenient one. Additionally, the
prevalence groupings could be made with smaller ranges between the least prevalent and most prevalent conditions in a group.
VSAs would need to be adjusted if run on a gene associated with a disease more prevalent in certain populations.
Overall, this study was successful at determining the specificity of the VSAs. The created curves can be used as a tool to estimate PPV of using WES to screen for RUSP disorders in each gene; however, specificity alone is not enough to accurately calculate the PPV. The sensitivity of the VSAs is also needed to calculate the PPV and create an effective screening test. Sensitivity will be measured by examining how well the VSAs identify true positives by running the VSAs on a population of individuals with the RUSP conditions. Additionally, although the VSAs are assumed to be increasing in sensitivity, they must be experimentally tested. For example, VSA 6 is thought to be more sensitive than VSA 4, however VSA 6 may actually be less sensitive than VSA 4 and identify less true positives. Experimentally measuring the sensitivity of the VSAs would also reveal whether the VSAs have different orders of sensitivity depending on the gene. VSA 6 may be more sensitive than VSA 4 in one gene but less sensitive than VSA 4 in another.
With further investigation and the calculation of VSA sensitivity, the proper selection criteria for which variants detected through sequencing in genes associated disorders screened for in NBS can be determined based on the specificity and
Acknowledgements
Thank you to Dr. Jonathan Berg for allowing me to join his lab, for trusting me with this project and for all his advice and guidance. A huge thank you to Michael Adams for providing the informatics outlines for the VSAs and for assisting me with many computational problems that I encountered. Thank you to Alicia Brandt for her insight and comments. Thank you to the UNC Biology department for providing undergraduates the opportunity to share our research and thank you to Dr. Amy Maddox for her guidance and encouragement. Thank you to my peer-editing group for their valuable feedback. Thank you to the entire Berg Lab for your support and for
References
1. Wilcken B, Wiley V. Newborn screening. Pathology. 2008;40:104–115.
2. Berg, JS. Powell, CM. “Potential uses and inherent challenges of using genome-scale sequencing to segment current newborn screening.” Cold Spring Harb Perspect Med 2015;5:a023150
3. Watson, Michael S. et al., eds. “Executive Summary.” Genetics in Medicine8.Suppl 1 (2006): 1S–11S. PMC. Web.
4. Watson, Michael S. et al., eds. “Executive Summary.” Genetics in Medicine8.Suppl 1 (2006): 1S–11S. PMC. Web.
5. Rehm, Heidi L. et al. “ACMG Clinical Laboratory Standards for next-Generation Sequencing.” Genetics in medicine!: official journal of the American College of
Medical Genetics 15.9 (2013): 733–747. PMC. Web. 22 Nov. 2015.
6. Caulfield T, Evans J, McGuire A, McCabe C, Bubela T, Cook-Deegan R, et al. (2013) Reflections on the Cost of "Low-Cost" Whole Genome Sequencing: Framing the Health Policy Debate. PLoS Biol 11(11): e1001699.
doi:10.1371/journal.pbio.1001699
7. Berg, J S. Powell, CM. “Potential uses and inherent challenges of using genome-scale sequencing to segment current newborn screening.” Cold Spring Harb Perspect Med 2015;5:a023150
8. Adams, Michael. Evans, James. Henderson, Gale. Berg, Jonathan. “The promise and peril of genomic screening in the general population.” Genetics in Medicine: official journal of the American College of Medical Genetics. (2015) Web. 22 Nov.
9. Berg, J S. Powell, CM. “Potential uses and inherent challenges of using genome-scale sequencing to segment current newborn screening.” Cold Spring Harb Perspect Med 2015;5:a023150
10. Might, Matthew. Wilsey, Matt. “The shifting model in clinical diagnostics: how next-generation sequencing and families are altering the way rare disease are discovered, studied, and treated.” Genetics in Medicine (2014) 16, 736-737. Web. 22 Nov. 2015
11. Florkowski CM. Sensitivity, Specificity, Receiver-Operating Characteristic (ROC) Curves and Likelihood Ratios: Communicating the Performance of Diagnostic Tests. The Clinical Biochemist Reviews. 2008;29(Suppl 1):S83-S87.
12. Lewis F, Torgerson P. A tutorial in estimating the prevalence of disease in humans and animals in the absence of the gold standard diagnostic. Emerging Themes in Epidemiology. 2012; 9:9.
13. Florkowski CM. Sensitivity, Specificity, Receiver-Operating Characteristic (ROC) Curves and Likelihood Ratios: Communicating the Performance of Diagnostic Tests. The Clinical Biochemist Reviews. 2008;29(Suppl 1):S83-S87.
14. Foreman, Ann. Lee, Kristy, Evans, James. “The NCGENES Project : Exploring the New World of Genome Sequencing” North Carolina Medical Journal.2013; 74(6):500-504. Web. 22 Nov. 2015
15. Bizon, C., Ahalt, S., Fecho, K, Nassar, N., Schmitt, C., Scott, E., and Wilhelmsen, K. (2014): Technologies for Genomic Medicine: CANVAS and AnnoBot,
16. Landrum MJ, Lee JM, Riley GR, et al. ClinVar: public archive of relationships among sequence variation and human phenotype. Nucleic Acids Res.
2014;42(Database issue):D980-5.
17. Stenson PD, Ball EV, Mort M, et al. Human Gene Mutation Database (HGMD): 2003 update. Hum Mutat. 2003;21(6):577-81.
18. Pruitt KD, Brown GR, Hiatt SM, et al. RefSeq: an update on mammalian reference sequences. Nucleic Acids Res. 2014;42(1):D756-63.
19. Exome Aggregation Consortium (ExAC), Cambridge, MA (http://exac.broadinstitute.org)
20. Advisory Committee on Heritable Disorders in Newborns and Children. US. Department of Health and Human Services Accessed Nov. 22 2015
(http://www.hrsa.gov/advisorycommittees/mchbadvisory/heritabledisorders/recom mendedpanel/)
21. Feutchtbaum L, Carter J, Dowray S, Currier R, Lorey, F.Birth prevalence of disorders detectable through newborn screening by race/ethnicity. Genetics in Medicine. 2012; 14: 937-945.
22. Combined Annotation Dependent Depletion (http://cadd.gs.washington.edu/) 23. Adams, Michael. Evans, James. Henderson, Gale. Berg, Jonathan. “The promise
and peril of genomic screening in the general population.” Genetics in Medicine: official journal of the American College of Medical Genetics. (2015) Web. 22 Nov.
24. Hajian-Tilaki K. Receiver Operating Characteristic (ROC) Curve Analysis for Medical Diagnostic Test Evaluation. Caspian Journal of Internal Medicine. 2013; 4(2):627-635.
25. Zou, Kelly H, O’Malley, A. James , and Laura Mauri. “Receiver-operating characteristic analysis for evaluating diagnostic tests and predictive models.” Circulation 115.5 (2007) : 654-657.
26. Exome Aggregation Consortium (ExAC), Cambridge, MA (http://exac.broadinstitute.org)
27. Feutchtbaum L, Carter J, Dowray S, Currier R, Lorey, F. Birth prevalence of disorders detectable through newborn screening by race/ethnicity. Genetics in Medicine. 2012; 14: 937-945.
Appendix I.
Gene Disorder California Prevalence27
(per 100,000)
Grouping
ACADM Medium-chain acyl-CoA dehydrogenase deficiency ( MCAD)
5.3 1/100,000
ACADVL Very long-chain acyl-CoA dehydrogenase deficiency (VLCAD)
1.8 1/100,000
BTD Biotinidase deficiency (BIO) profound
1.7 1/100,000
Biotinidase deficiency (BIO) partial
2.2 1/100,000
CBS Homocystinuria (cystathionine beta synthase) (HCY)
0 1/1,000,000
FAH Tyrosinemia 0.1* 1/1,000,000
GALT Galactosemia/galactose-1-phosphate uridyltransferase deficiency (GALT )
1.3 1/100,000
Galactosemia (Duarte) 5.6 1/100,000
HBB Sickle cell anemia 10.6 1/10,000
Beta - Thalassemia 0.7
HMGCL 3-Hydroxy-3-methylglutaryl-CoA lyase deficiency (HMG)
0 1/1,000,000
IVD Isovaleric acidemia/ Isovaleryl-Co-A dehydrogenase deficiency (IVA)
0.9 1/1,000,000
PAH Phenylketonuria/Hyperphenylala
ninemia (PKU) 2.9 1/100,000
SLC22A5 Carnitine uptake defect/carnitine
transport defect (CUD)
1.5 1/100,000
ACAT1 Beta-ketothiolase (BKT)/ Short-chain keto acylthiolase deficiency (SKAT)
0.1 1/1,000,000
ASL Argininosuccinic aciduria (ASA) 0.2 1/1,000,000
HADHA Trifunctional protein deficiency (TFP)
0 1/1,000,000
HADHB Trifunctional protein deficiency (TFP)
0 1/1,000,000
HLCS Multiple carboxylase deficiency
(MCD) 0.1 1/1,000,000
MCCC1 3-methylcrotonyl-CoA
carboxylase deficiency (3-MCC)
2.9 1/100,000
MCCC2 3-methylcrotonyl-CoA
carboxylase deficiency (3-MCC)
2.9 1/100,000
MMAA Methylmalonic aciduria (MMA) .8 -1.4 1/100,000
MMAB Methylmalonia aciduria (MMA) .8 - 1.4 1/100,000
PCCA Propionic acidemia 0.2 1/1,000,000
PCCB Propionic acidemia 0.2 1/1,000,000
The RUSP newborn screening disorders and the associated gene and condition prevalence from “Birth prevalence of disorders detectable through newborn screening by race/ethnicity”. The assigned grouping for each gene is also shown.