Examination of the Acute Hepatic and Renal Toxicity from the Concurrent Oral Exposure to Chloroform and Trichloroethylene.
By Michelle Ziegler Lilly
(Under the direction of Dr. Jane Ellen Simmons and Dr. Louise M. Ball)
Increased hepatic and renal toxicity occurs following concurrent exposure to carbon tetrachloride (CCI4) and trichloroethylene (TCE) relative to that seen from each chemical alone. Consequently, the interaction of TCE and chloroform (CHCI3), a close structural analogue of CCI4, was examined. Adult male F-344 rats were gavaged with 0, 0.5 or 1.0 ml CHCl3/kg, 0 or 1.0 ml TCE/kg or their factorial combinations in corn oil. Urine was collected at 0, 6, 12, 24, 36 and 48 hrs, and hepatotoxicity was assessed at 24 and 48 hrs. To examine the influence of gavage vehicle, additional rats were gavaged with 0, 0.5 or 1.0 ml CHCl3/kg, 0 or 1.0 ml TCE/kg or their factorial combinations in an aqueous vehicle (10% Emulphor 620). Urine was collected at 0, 6, 12, 24, 36 and 48 hrs, and hepatotoxicity was assessed at 24 and 48 hrs. CHCI3 alone caused hepatic and renal toxicity. At 48 hours post dosing, serum AST and LDH were observed to increase 88-146 fold and 45-48 fold, respectively, when
CHCI3 was administered in corn oil. Increases in AST and LDH were
significant when CHCI3 was administered in the aqueous solution; however, elevations were no more than 3-fold for either enzyme. Vehicle differences were also observed in increases of ALT and bile acids. Both were significantly elevated when administered in oil compared to the aqueous vehicle. Peak hepatotoxicity was observed to be 48 hours when CHCI3 was administered in oil whereas in the aqueous vehicle, 24 is greater or equal to 48 hours, based
on elevations in ALT and bile acids.
Table of Contents
Page List of Tables I
List of Figures ii
I. Introduction 1 II. Literature Review 4
A. Introduction 4 B. Chloroform 6 1. Occurrence in the Environment 6 2. Routes of Exposure 6 3. Toxicological Profile 7 4. Metabolism and Hepatotoxicity 8 5. Nephrotoxicity 11 6. Hepatic vs Renal Toxicity and Metabolism 12
7. Reductive Metabolism 13
C. Trichloroethylene 15 1. Occurrence in the Environment 15
2. Pharmacokinetics 15
3. Toxicological Profile and Hepatotoxicity 16 4. Nephrotoxicity 18
D. Oral Gavage Vehicles for Lipophilic Compounds 19 E. Chemical Interactions 24 F. Methods of Toxicological Evaluation 28 1. Indicators of Hepatic Damage 28 2. Indicators of Renal Damage 31
III. Materials and Methods 37 A. Animals 37 B. Dosing 37 C. Safety Precautions 38 D. Experimental Design 39 E. Urine Clinical Chemistry 39 F. Serum Clinical Chemistry 40 G. Histology 41
H. Statistical methods
IV. Results 43
A. Acute Hepatic Response 43
1. Chloroform Toxicity 43
2. Trichloroethylene Toxicity 443. Vehicle Effects 45
2. Trichloroethylene Toxicity 51
3. Vehicle Effects 51
4. Interaction of Chloroform and Trichloroethylene 52
5. Histopathology Results 56
V. Discussion 58
A. Chloroform Hepatotoxicity 58
B. Chloroform Nephrotoxicity 61
C. Trichloroethylene Hepatotoxicity 62
D. Trichloroethylene Nephrotoxicity . 62
E. Interaction of CHCI3 and TCE on Hepatotoxicity 63
F. Interaction of CHCI3 and TCE on Nephrotoxicity 64
VI. Conclusions 66 VII. References 111
VIII. Appendix 119
Page
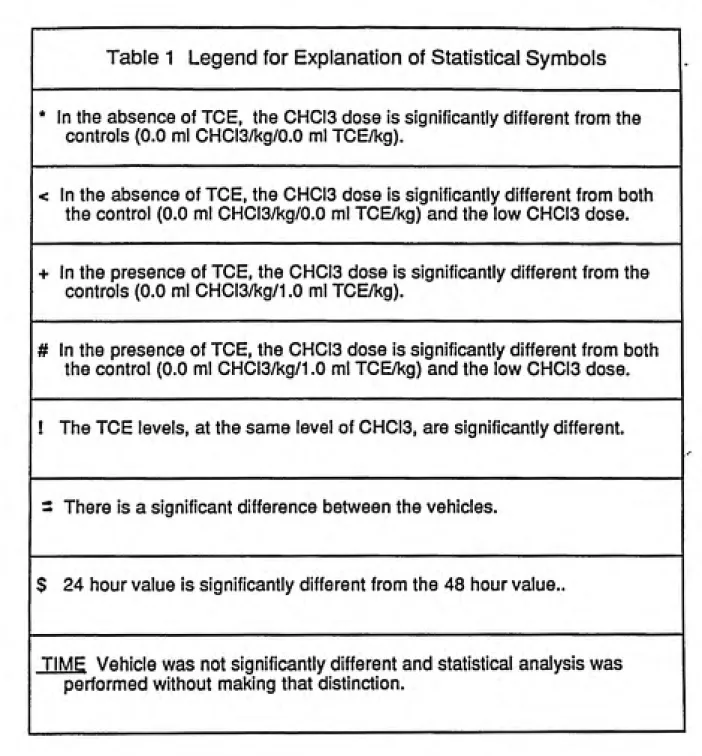
1. Legend for Explanation of Statistical Symbols 69
2. Vehicle Comparison of Serum Enzymes at 48 Hours 70
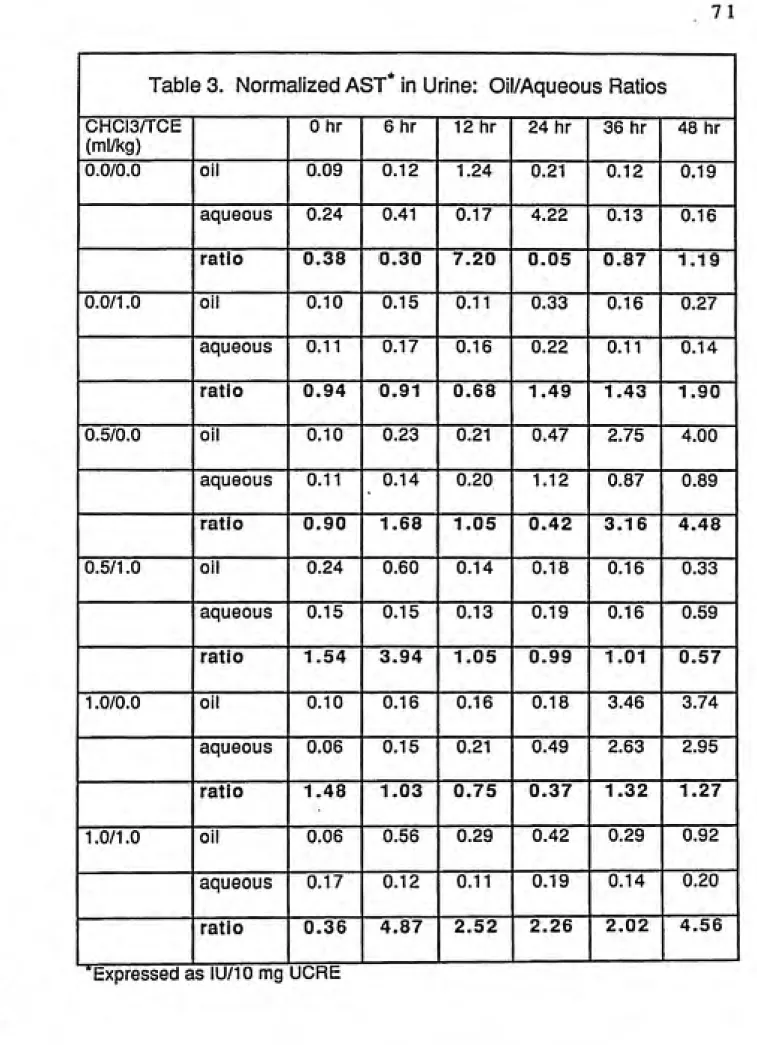
3. Normalized AST In Urine: Oil/Aqueous Ratios 71
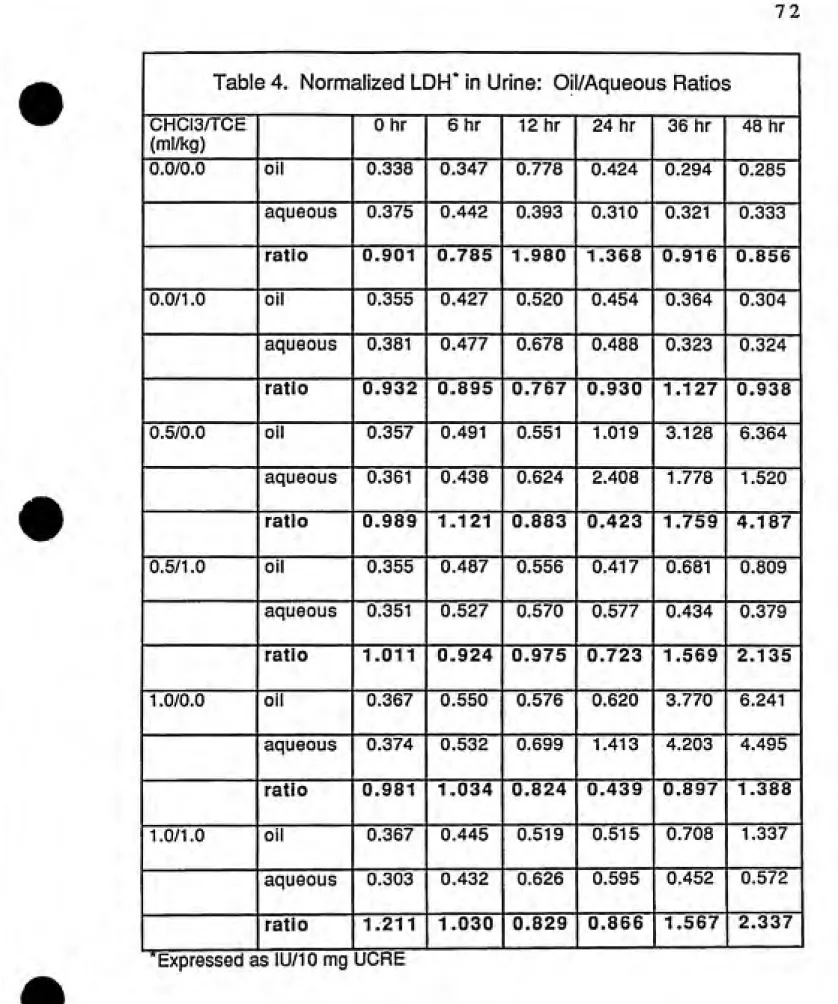
4. Normalized LDH In Urine: Oil/Aqueous Ratios 72
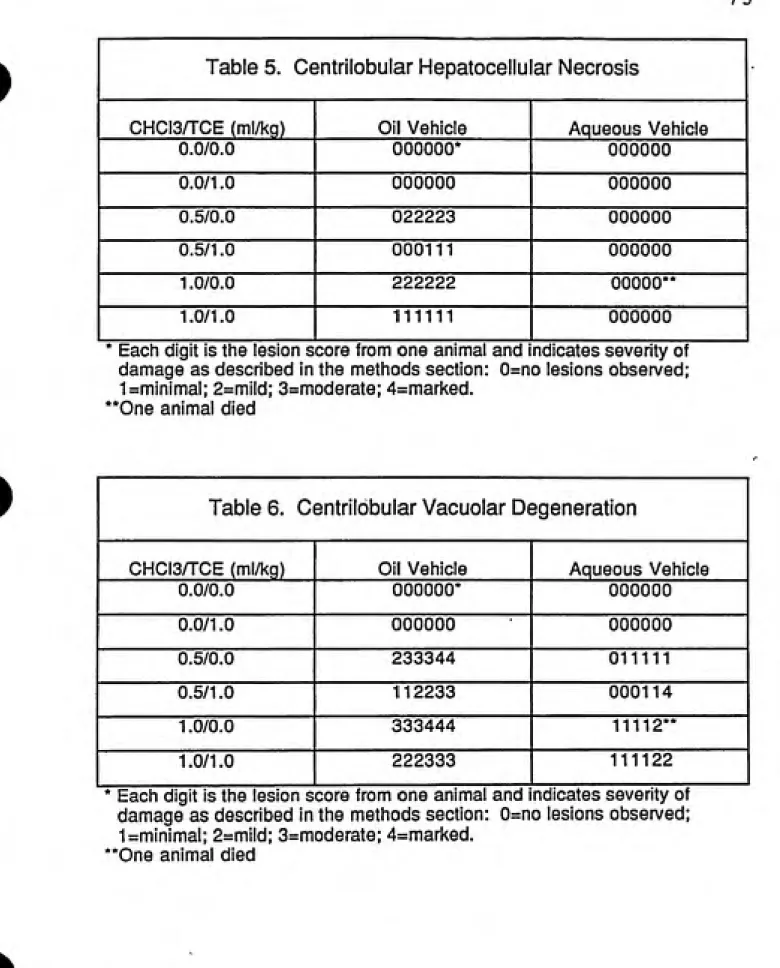
5. Centrilobular Hepatocellular Necrosis 73
6. Centrilobular Vacuolar Degeneration 73
7. Renal Tubule Degeneration 74
Page
1. Hepatic Metabolism and Activation of Chloroform 77
2. Reaction of Phosgene with Cysteine and Free Radical Intermediate 78
3. Body Weight at 48 hours-Oil Vehicle 79
4. Body Weight at 48 hours-Aqueous Vehicle 79
5. Relative Liver Weight- Oil Vehicle 80
6. Relative Liver Weight-Aqueous Vehicle 80
7. LDH at 48 hours- Oil Vehicle 81
8. LDH at 48 hours- Aqueous Vehicle 81
9. AST at 48 hours-Oil Vehicle 8210. AST at 48 hours- Aqueous Vehicle 82
11.5' Nuc at 48 hours- Oil Vehicle 83
12. 5' Nuc at 48 hours- Aqueous Vehicle 83
13. Hepatotoxicity of 0.5 ml CHCI3/kg and TCE in Oil Vehicle -ALT 84
14. Hepatotoxicity of 1.0 ml CHCI3/kg and TCE in Oil Vehicle -ALT 84
15. Hepatotoxicity of 0.5 ml CHCI3/kg and TCE in Aqueous Vehicle-ALT 85
16. Hepatotoxicity of 1.0 ml CHCI3/kg and TCE in Aqueous Vehicle -ALT 85
17. Hepatotoxicity of 0.5 ml CHCI3/kg and TCE in Oil Vehicle -Bile Acids 86
18. Hepatotoxicity of 1.0 ml CHCI3/kg and TCE in Oil Vehicle- Bile Acids 86
19. Hepatotoxicity of 0.5 ml CHCI3/kg and TCE in Aqueous Vehicle-Bile Acids 87
20. Hepatotoxicity of 1.0 ml CHCI3/kg and TCE in Aqueous Vehicle-Bile Acids 87
21. CHCI3 Hepatotoxicity in Oil and Aqueous Vehicles at 24 hours- ALT 88
22. CHCI3 Hepatotoxicity in Oil and Aqueous Vehicles at 48 hours- ALT 88
23. CHCI3 Hepatotoxicity in Oil and Aqueous Vehicles at 24 hours-Bile Acids 89
26. Relative Kidney Weight- Aqueous Vehicle
27. BUN at 48 hours- Oil Vehicle
28. BUN at 48 hours- Aqueous Vehicle 29. CRE at 48 hours- Oil Vehicle
30. CRE at 48 hours- Aqueous Vehicle 31. Nephrotoxicity 0
32. Nephrotoxicity o 33. Nephrotoxicity o 34. Nephrotoxicity o 35. Nephrotoxicity o 36. Nephrotoxicity o 37. Nephrotoxicity o 38. Nephrotoxicity o 39. Nephrotoxicity o 40. Nephrotoxicity o 41. Nephrotoxic! 42. Nephrotoxicity o 43. Nephrotoxic! 44. Nephrotoxic 45. Nephrotoxic 46. Nephrotoxicity o 47. Nephrotoxic 48. Nephrotoxicity o
ty 0
ty 0 ty 0 ty 0
ty o
CHCI3 and TCE
CHCI3 and TCE CHCI3 and TCE
CHCi3 and TCE
CHCI3 and TCE
CHCI3 and TCE
CHCI3 and TCE CHCI3 and TCE CHCI3 and TCE CHCI3 and TCE
CHCI3 and TCE CHCI3 and TCE
CHCI3 and TCE CHCI3 and TCE CHCI3 and TCE CHCI3 and TCE CHCI3 and TCE
CHCI3 and TCE
n Oil Vehicle-AST
n Aqueous Vehicle-AST
n Oil Vehicle-ALT
n Aqueous Vehicle-ALT
n Oil Vehicle-LDH
n Aqueous Vehicle-LDH
n Oil Vehicle-CRE
n Aqueous Vehicle-CRE
n Oil Vehicle-UN
n Aqueous Vehicle-UN n Oil Vehicle-Total Protein
n Aqueous Vehicle-Total Protein n Oil Vehicle-Osmolality
n Aqueous Vehicle-Osmolality
n Oil Vehicle-Volume
n Aqueous Vehicle-Volume n Oil Vehicle-pH
n Aqueous Vehic!e-pH
I. Introduction
Human contact with chemicals, environmentally or occupationaily,
seldom occurs as a single exposure to an individual substance. It is well known that we are exposed to many hundreds of compounds, both synthetic and natural, on a daily basis. As a result, knowledge of the toxicity from single chemical exposures, based on animal toxicity assessments, may not accurately predict the effect of multiple exposures to chemicals in conjunction with other confounding environmental factors. The pursuit of understanding and characterizing such interactions is an important one if we are to ultimately, accurately predict the human health consequences of exposure to multiple
chemicals in the environment.
There is a pressing need to evaluate the toxicity of complex chemical mixtures and since drinking water is a potential media for multiple exposure to potentially large populations, assessing the public health risk associated with drinking water and the maintenance of drinking water quality are high priorities for environmental regulatory and public health agencies. Contaminants associated with the disinfectant process such as trihalomethanes (THMs) as well as other volatile organic compound (VOC) contaminants commonly found in water have been the focus of much interactive toxicity investigations.
Both CHCI3 and TCE are commonly found at hazardous waste sites (Grisham, 1986) and as waste sites are potential sources of groundwater contamination, the simultaneous occurrence of the two compounds in drinking water is probable. Additionally, since CHCI3 is formed by chlorination of
surface waters for disinfection, this increases the importance of studying this
particular VOC and its potential interactive capabilities with other drinking water
contaminants.
TCE is known to potentiate CCI4, and since CCI4 and CHCI3 are structurally similar compounds, it was the objective of this study to examine the possible interaction of CHCI3 and TCE, to characterize the dose dependence of any observed interaction and to examine the effect over time. This would provide us with information on the behavior of two structurally similar binary
mixtures.
A. Introduction
The National Research Council (NRC)(1984) proposed a scheme to prioritize and identify chemicals for toxicity testing and hazard ranking. Important factors included in the prioritizing procedure include:
1. a chemical being present at the disposal site
2. its potential for release and migration through the environment 3. its potential for resulting in adverse human health effects
4. its recognition by the scientific community and or general public as being a chemical causing concern.
In addition, the Mitre Corporation (1983) compiled a list of chemicals or groups of chemicals that were reported as being present in the environment in the vicinity of the then 546 National Priority List (NPL) sites which had been designated by the Environmental Protection Agency (U.S. EPA) as mandated under Comprehensive Environmental Response, Compensation and Liability Act (CERCLA) and are identified by U.S. EPA as being disposal sites causing
documented environmental concern.
According to the Mitre study, trichloroethylene (TCE) was found at 129/546 NPL sites and chloroform (CHCI3) was found at 68/546. When ranked by frequency of occurrence, TCE was first followed by toluene, benzene, lead with chloroform ranked 5th. The Conservation Foundation (1984) also reported that EPA had evaluated approximately 900 sites for possible inclusion on the NPL for cleanup and CHCI3 and TCE were among the ten most commonly reported substances at these sites.
CHCI3 occurs naturally; however, the majority in the environment is due to anthropogenic activities. In 1989, 587.6 million lbs of CHCI3 was produced in the U.S. (SOC 1955-1990). CHCI3 is primarily used to make fluorocarbon-22, a component of the cooling fluid for air-conditioners (ATSDR, 1989a). In addition it is used in the manufacturing of pesticides, dyes, fire extinguishers, spot removers, solvents for penicillin, vitamins, alkaloids, lacquers, floor polishes, waxes and adhesives (ATSDR, 1989a).
Releases into the environment occur from the pulp and paper manufacturing process, pharmaceutical and chemical manufacturing plants and from the chlorination of waste and drinking water (ATSDR, 1989a). CHCI3 was widely used in drug, cosmetic and food products until it was banned for those purposes by EPA in 1976 (Grisham, 1986).
Routes of Exposure
Human exposure to CHCI3 can occur via ingestion, inhalation or dermal contact; however, the exposure pathway of primary concern for the general population is ingestion. CHCI3 enters drinking water from the chlorination disinfection process as well as contamination of surface and groundwater from chemical spills and waste disposal sites. The major exposure is via ingestion of contaminated ground water (Grisham, 1986); however, occupationally, inhalation may be a major route. Inhalation and dermal, in addition to oral exposures, in the domestic environment are now of increasing concern for health-based risk assessments (Jo et al., 1990).
supplies (Grisham, 1986). Higher concentrations of CHCI3 are found in finished drinking water that has high levels of humic/fulvic acids and algal growth, an alkaline pH, and relatively warm temperatures (U.S.EPA 1981). Alternate disinfection processes are available to lower the CHCI3 levels; however, they can be costly and unavailable to smaller water treatment
facilities.
CHCI3 is one of several trihalomethanes (THMs) which are currently regulated collectively by EPA. In efforts to protect public health from drinking
water exposure, EPA has promulgated a drinking water maximum contaminant
level (MCL) for total THMs of 100 ppb (ug/L) as technically and economically feasible for municipal water supplies serving 10,000 people or more (ATSDR, 1989a).
Toxicological Profile
For both inhalation and ingestion routes of exposure, the systemic target organs for toxicity are the liver, kidneys and central nervous system (CNS) (ATSDR, 1989a). The liver and kidney are the most sensitive target organs with CNS toxicity observed only at very high exposures. Toxic hepatitis and liver enlargement were found in workers exposed by inhalation to CHCI3 at levels of
2 to 205 ppm over a period of 1 to 4 years (Bomski et al., 1967). A fatal oral dose of CHCI3 may be as little as 10 ml (211 mg/kg) for a 70 kg human according to Schroeder (1965). A wide range of oral LD50 values (lethal dose that kills 50% of the treated animals) have been reported; the ATSDR reports that the LD50 values for rats are 444 to 2000 mg CHCI3/kg and 118 to 1400 mg CHCI3/kg for mice depending on age, sex and strain.
weeks. Mortality was found to be dose related, due perhaps to liver toxicity (NCI 1976). In mice, gavaged with CHCI3 for 78 weeks and observed for 14-15 weeks, a dosage of 477 mg/kg/day resulted in decreased survival whereas dosages less than 238 mg CHCI3/kg/day did not (NCI 1976).
Levels of acute oral exposures found to produce any liver and kidney effects in humans are not known; however, a patient who ingested 2.6 to 11.6 g CHCI3/day in cough medicine for approximately 10 years developed hepatitis and necrosis (Wallace, 1950). It has been noted that confounding factors make these results difficult to interpret. The NOAEL (no observable adverse effect
level) for humans is currently set at Img CHCI3/kg/day for liver and kidney toxicity (ATSDR, 1989a). The acute oral NOAEL and LOAEL (lowest observable adverse effect level) for target organ toxicity in mice are set at 18 and 30 mg CHCI3/kg, respectively (ATSDR, 1989a). Rats have been found to more resistant to CHCi3 toxicity with the acute NOAEL and LOAEL being 30 and 150 mg CHCI3/kg respectively (ATSDR, 1989a).
An epidemiological study uncovered a possible relationship between human exposure to chlorinated drinking water and cancer of the bladder, large intestine and rectum (U.S.EPA, 1985). CHCI3 is one of several volatile organic contaminants (VOCs) considered to have carcinogenic potential, but has yet to be identified as the main cause of cancer associated with chlorinated drinking water (ATSDR, 1989a).
Metabolism and Hepatotoxicity
When orally ingested, CHCI3 is absorbed rapidly through the intestinal mucosa, a dose-dependent first-pass effect occurs with pulmonary elimination of the unchanged compound (ATSDR, 1989a). Mink et al., (1986) administered single
oral doses of 100 mg 1'^C-CHCIS/kg in corn oil (16uCi/kg) to rats and mice. In
and 3.6% was recovered in organs. A greater extent of metabolism was found in mice with 26% expired as unchanged CHCI3 and 49.6% as C02 with total recovery of 94%.
Large interspecies and sex differences in metabolism, tissue distribution and covalent binding to tissue macromolecules make dose and species extrapolations difficult (ATSDR, 1989a). Dogs appeared to be the most sensitive species to CHCI3 induced hepatotoxicity. The liver is generally the most sensitive target organ but in some male mice strains such as the ICR, the kidneys were more susceptible.
In order to exert toxicity, CHCI3 must first be metabolized (Pohl, 1979). This occurs primarily in the liver and kidneys and has been found to be a saturable process. The exhalation of CO2 is a major route of elimination with the concentration of CO2 in the exhaled breath being dose dependent. The liver converts CHCI3 to C02 approximately 5 times more rapidly than the kidney with the adipose, blood and muscle tissue exerting little influence on CHCI3 metabolism (Paul and Rubenstein, 1963; Pohl, 1979). The metabolic activity is localized in the microsomal fraction of liver homogenates and depends upon the presence of pyridine nucleotides (Pohl, 1979). The pretreatment of animals with inducing agents of liver microsomal cytochrome P-450 such as ethanol, DDT and phenobarbital markedly increased the hepatotoxic response to CHCI3 (Pohl, 1979). In contrast, when animals are pretreated with inhibitors of liver cytochrome P-450 such as SKF 525-A or piperonyl butoxide, a decrease in hepatotoxicity is found .
phenobarbltal (Pohl, 1979). GSH, a scavenger of electrophillic compounds which can potentially bind to tissues may react with the CHCI3 metabolites and
protect against any resulting hepatotoxicity. This role is supported by the observation that hepatotoxicity is potentiated when liver GSH is depleted by pretreatment with diethyl maleate (Pohl, 1979). GSH depletion in the liver is a rapid process. Within 1 hour after the interperitoneal (ip) administration of 0.2
ml CHCI3/kg to phenobarbital-treated rats, it was observed that approximately
59% of the GSH was depleted (llett et al., 1973).
CHCI3 metabolites have been reported to bond covalently in vivo to macromolecules such as protein, lipids or nucleic acids in the target organs where it causes tissue damage (llett et al., 1973). A correlation between the extent of covalent binding of CHCI3 metabolites to tissue macromolecules and tissue damage and toxicity has been reported (Pohl, 1979). Pretreatment with inhibitors or inducers of P-450 decrease or increase, respectively, the amount of liver damage and the amount of covalent binding (Pohl, 1979). Pohl reports that the covalent binding of CHCI3 metabolites displays a striking preference for the accumulation in the centrilobular hepatocyctes and in the proximal convoluted tubular cells in the kidney.
Histological studies have shown that CHCI3 causes marked alterations of cellular organelles. The rough endoplasmic reticulum shows fragmentation and loss of ribosomes and a depression in protein synthesis is observed (Smuckler, 1976). This functional loss is believed to be in part responsible for the accumulation of fat seen in the liver based on the knowledge that excretion of lipid from the liver requires a carrier protein.
As early as 1915 it was suggested that phosgene (C0CI2) was a
(CI3-C-0H) would not be expected to be stable and would spontaneously dechlorinate to C0CI2 since the only trihalomethanol derivative found in the literature is trifluoromethanol (F3C0H) a compound which spontaneously
dehydrofluorinated at -200 C {Pohl, 1979). The C0CI2 is extremely
eiectrophillic since it is a di-acyl chloride and consequently will react with any nucleophile, nucleophilic thiol or hydroxyl and amino groups in protein and lipids and therefore be responsible for the covalent binding and the depletion of
hepatic GSH.
Cysteine is known to react rapidly with C0CI2 to form 2-oxothiazolidine-4-carboxylic acid (see Figure 2). Thus, using cysteine as a trapping agent, since C0CI2 is reactive and volatile, it was concluded that phosgene was in fact a metabolite of CHCI3 (Pohl et al., 1977).
CDCI3 is known to be metabolized more slowly than CHCI3 suggesting that the cleavage of the C-H bond of the CHCI3 was the rate determining step in this enzymatic process (Pohl, 1979). This observation supported the proposed oxidative dechlorination mechanism for CHCI3. Other potential toxic
metabolites of CHCI3 include the trichloromethyl radical and the dichloromethyl
carbene (Pohl, 1979).
Nephrotoxicity
In addition to eliciting hepatotoxicity, CHCI3 is known to be nephrotoxic. The lesion is localized primarily in the proximal tubule and characterized by a marked increase in kidney weight and swelling of the tubular epithelium, which is associated with marked necrosis and tubular casts (Lock, 1989). Species differences have been observed in the renal metabolism of CHCI3 by the rat in contrast to the mouse or rabbit. In a study by Smith et al. (1985) rat renal
cortical tissue was found to metabolize CHCI3 to C02 and a reactive
in the rat tissue was substantially less than that observed previously with mice
and rabbit renal tissue. In addition, an atmosphere of CO:oxygen (80:20) did not alter CHCI3 toxicity in rat renal cortical slices whereas CO did reduce CHCI3 toxicity in mouse renal cortical slices (Smith and Hook,1983).
Hepatic vs Renal Toxicity and Metabolism
It has been suggested that the renal metabolism of CHCI3 may not
involve cytochrome P-450 as much as the hepatic metabolism due to the inability of CO to reduce CHCI3 toxicity in rat renal cortical slices (Pohl, 1979). This suggestion was supported by the observation that the severity of CHCI3 nephrotoxicity in vitro did not differ between Fischer-344 and Sprague-Dawley rats although the concentration of renal cytochrome P-450 has been shown to be two-fold greater in the Fischer-344 rat strain (Smith et al., 1985). Consequently, there appears to be a difference in the metabolism of CHCI3 in the kidney and liver microsomes. This is supported by the finding that in vivo CHCI3 did not deplete GSH in the kidney of the rat as it did in the liver (Docks and Krishna, 1976). Thus, the activation of CHCI3 by oxidative dechlorination may not occur in the rat kidney as it does in the liver since no kidney glutathione is depleted and it does not appear to be catalyzed by P-450 (Docks and Krishna, 1976).
Various ketonic solvents are capable of potentiating CHCI3-induced renal and hepatic toxicity in rats (Hewitt et al., 1983). In Sprague-Dawley rats, the potentiation of hepatic CHCI3 toxicity by 2-hexanone (methyl-n-butyl ketone) is associated with increased concentration of hepatic cytochrome P-450, increased bioactivation of CHCI3 to phosgene, and increased depletion of hepatic GSH (Branchflower and Pohl, 1981).
after the administration of CHCI3 suggested that the metabolism of CHCI3 to
C0CI2 may not occur in the kidney (Branchflower and Pohl, 1981). These data suggested that the mechanism of CHCI3-induced nephrotoxicity in rats may differ from that of hepatotoxicity (Smith et al., 1985). CHCI3-induced murine nephrotoxicity was only observed in males (Smith and Hook, 1983). The renal metabolism of CHCI3 to phosgene (trapped as 2-oxothiazolidine-4-carboxylic acid) requires the presence of 02 and NADPH and can be inhibited by CO supporting a role for cytochrome P-450 in this species (Lock, 1989). Administration of CHCI3 to male mice produced a depletion of renal GSH, indicating that phosgene is also formed in vivo as a metabolite in mouse kidney (Lock, 1989). Incubation of CHCI3 under an atmosphere of CO diminished the toxic effects showing further evidence of renal metabolism suggesting oxidative metabolism of CHCI3 by cytochrome P-450. The levels of renal cytochrome P^ 450 and associated monooxygenases were 3 to 5 times higher in the male vs female mice and pretreatment with diethyl maleate a GSH depletor, increased male but not female susceptability, suggesting sex differences in kidney metabolizing enzymes (Smith and Hook, 1983).
Reductive Metabolism
A large number of studies have suggested that the CHCI3 activation process depends on the microsomal drug metabolizing system and is influenced by the presence of oxygen (Pohl, 1979). In a study by Tomasi et al., (1985) about 30% of the metabolism of CHCI3 still occurs under anaerobic conditions, suggesting the presence of a reductive metabolic pathway. It is known that halomethanes compete with oxygen for electrons supplied at the
hepatocytes incubated under nitrogen and give rise to free radical intermediates (Tomasi et al., 1985). Additionally, Testai and Vitozzi, (1986) recently demonstrated that the induction of rats with phenobarbital dramatically stimulates the hypoxic reductive bioactivation of CHCI3. The investigators concluded that the hypoxic bioactivation may have a role in CHCI3 toxicity.
Testai and Vitozzi, (1992) have extensively studied both reductive and oxidative
metabolism of CHCI3. The investigators have proposed 3 processes that produce chemically reactive species from chloroform. Two of these are oxidative, but differ in their affinity for CHCI3 and O2. The products formed by these processes are not different and both bind to lipids and proteins and are efficiently scavenged by GSH. The difference is that one has been observed to be inhibited by lower O2 tension than the other. The third process is inhibited by oxygen and gives rise to a protein-lipid binding ratio similar to that
attributable to trichloromethyl radicals. This may represent the reductive
formation of radicals in agreement with TomasI (1985). The investigators propose that in the centrilobular region of the liver, the oxidative process is limited because of the low O2 tension and allows the reductive pathway to
C. Trichloroethylene: Occurrence in the Environment
Approximately 200 million lbs of TCE are used annually in the United
States (ATSDR, 1989b). Roughly 80% is used as a solvent for the vapor degreasing of fabricated metal parts and the remaining 20% for chemical intermediates, miscellaneous use and exports (ATSDR, 1989b). Most of the TCE is released into the atmosphere by evaporative losses from degreasing uses and leaching to groundwater from waste disposal landfills (Sabel and Clark,1984).
According to the Mitre study, trichloroethylene (TCE) was found at 129/546 NPL sites. When ranked by frequency of occurrence, TCE was first followed by toluene, benzene, lead with chloroform ranked 5th. The U.S. EPA Groundwater Supply survey of 945 water supplies nationwide using groundwater sources found TCE in 91 of the 945; the median level of the positive samples was ~1ppb with a single maximum level of 130 ppb (Westrick et al.,1984). Various federal and state surveys indicate that between 9 and 34% of the water supply sources in the U.S. may be contaminated with TCE (ATSDR, 1989b); thus, a main source of exposure occurs via ingestion of drinking water.
EPA has established a drinking water standard of 5 ppb which applies to community water systems and those which serve the same 25 or more persons for at least 6 months (ATSDR, 1989b). Occupational exposure is also of major concern and OSHA regulates exposure at an average concentration of 50 ppm in the air for an 8 hour day over a 40 hour week (ATSDR, 1989b).
Pharmacolcinetics
Park Wistar-derived rats and Swiss-Webster and B6C3F1 mice were exposed
via a single intragastric administration to 10, 500, 1000, 2,000 mg/kg C^OTCE
in corn oil, (dosing volume was 1.0 ml for rats and 0.5 ml for mice). Metabolism of TCE in the mouse was linear over the range of dosages whereas in the rat it became constant and independent of dosage at 1000 mg/kg and above. At 2000 mg/kg TCE, 78 % of the dose was eliminated unchanged in the rat, but only 14 % in the mice. Mice appear to have a greater capacity to metabolize TCE, explaining their greater susceptability to TCE toxicity and carcinogenicity (ATSDR, 1989b). No significant strain differences were observed throughout the study other than the B6C3F1 mice having a higher tolerance to doses over
1000 mg/kg TCE.
The absorption characteristics of TCE are different depending on whether the compound is administered to fasted or nonfasted animals. D'Souza et al., (1985) found that in fasted male Sprague-Dawley rats (300-350g), TCE administered in 50% aqueous suspension (PEG 400) was rapidly and completely absorbed with peak blood concentrations 6-10 minutes after dosing. In nonfasted animals the peak blood TCE concentration occurred at the same time but the peak levels were 2-3 times lower than those observed in fasted animals. Vehicle effects on absorption and peak blood concentration have also been observed with TCE (Withey et al.,1983).
Toxicological Profile and Hepatotoxicity
males. Consequently, the oral LD50s were determined to be 2443 mg/kg for female mice and 2402 mg/kg for male mice (ATSDR, 1989b). Tucker et al.,1982, also conducted a subchronic study in which male weanling CD-I mice were exposed to 24 or 240 mg TCE/kg/day in 10% Emulphor (0.01 ml/g body wt) for 14 days by oral gavage. Increased liver weight was the only treatment-related effect. Based on this study, 240 mg/kg represents the NOAEL for hepatic and renal effects for acute oral exposure (ATSDR, 1989b). The dosages of 5,620 mg/kg/day and 3,160 mg/kg/day represent the LOAEL and NOAEL respectively for intermediate oral lethality in rats (ATSDR, 1989b).
In intermediate duration oral studies using male B6C3F1 mice, 2,400 mg TCE/kg by oral gavage in 10 ml/kg corn oil for 3 days caused centrilobular hepatocellular swelling with focal hepatocellular necrosis. Dosages of 500-1200 mg TCE/kg by oral gavage in 10 ml/kg corn oil caused increased relative liver weights in male B6C3F1 mice when administered 5 days/week for 3 weeks (Stott et al., 1982). The highest NOAEL for liver effects in mice is 1200 mg TCE/kg for intermediate duration oral exposure and the only dosage associated with necrosis was 2400 mg TCE/kg which Is designated as the LOAEL (ATSDR, 1989b).
TCE is extensively metabolized (40-75% of the retained dose in humans) to trichloroethanol (TCE-OH), trichloroethanol-glucuronide and trichloroacetic acid (TCA) with minor metabolites including chloral hydrate monochloroacetic acid and n(hydroxyacetyl) aminoethanol.(ATSDR, 1989b) Three urinary metabolites account for -90 % of the total TCE, TCA (15%), TCE-OH (12%) and conjugated TCE-OH(62%). (DeKantetal., 1984).
within 2 hours when 1 ml TCE/kg was administered to phenobarbital-pretreated rats with concentrations returning to control values within 6 hours and increasing significantly 24 hours after the dose. These results suggest that the conjugation of hepatic glutathione with the electrophilic intermediate of TCE does not appear to be a major detoxification pathway for TCE therefore unimportant in TCE hepatotoxicity. In addition, administration of TCE resulted in a dose-dependent decrease of liver microsomal cytochrome P-450 content, reaching an apparent plateau at about 1.0 ml TCE/kg. At this saturation dosage
the concentration of P-450 was decreased to 51% of controls. Rouisse and
Chakrabarti (1986) suggested that the reactive intermediate produced by metabolic activation through the MFO system may form ligand complexes with microsomal cytochrome P-450 with simultaneous loss of mixed function oxidase activity. This study indicated a.good correlation between decreased MFO activity or cytochrome P-450 content and the extent of liver injury. It was also shown that there exists an apparent saturable metabolism of TCE including its activation deactivation pathways which correspond to an apparent threshold (or minimal) toxic dose (eg ~1ml TCE/kg for its hepatotoxicity).
Nephrotoxicity
Chakrabarti and Tuchweber (1988) demonstrated that TCE exerts its acute nephrotoxic potential only at a very high dose level and produces nephrotoxic insult at the proximal tubule and possible glomerular regions of the rat kidney when exposed by inhalation or ip routes.
Treatment of male Fischer-344 rats (150-180g) with up to 11 mmol TCE/kg (0.99 ml TCE/kg) in corn oil per kg body weight (ip) did not influence any of the measured biochemical parameters of nephrotoxicity. Also significantly elevated levels of urinary N-acetyl-b-D-glucosaminidase (NAG) as
iQvel, 22mmol TCE/kg (1.97 ml TCE/kg) (Chakrabarti and Tuchweber, 1988).
Consequently, TCE is known to exert hepatotoxicity well before any nephrotoxic
damage is evident.
D. Oral Gavage Vehicles for Lipophilic Compounds
Health risk assessments of drinking water contaminants have typically been based on the results of toxicity studies in which the chemical is
administered to the animal orally in an oil vehicle. There is increasing concern
that the administration of an oil bolus will not only produce physiological effectsbut alter pharmacokinetic parameters such as the absorption or target organ
dose and in so doing possibly alter the effects or introduce confounding factors
which could significantly affect the accuracy and relevance of oral toxicity
studies (Kim et al.,1990a).
Digestible oils have classically been used as vehicles or diluents for the
volatile lipophilic VOCs because of their poor solubility in oil at concentrations
used for toxicity tests (Kim et al.,1990a). An alternative to corn oil is the use ofemulsifying agents to solubiize hydrophobic compounds in aqueous vehicles
for oral gavage or drinking water exposure. Emulphor, for example, is a
nontoxic liquid (Oral LD50=40g/kg in rats) prepared by polyoxyethylation of
castor oil (GAF corp). It serves as a nonionic surfactant to produce an oil inwater emulsion.
Following is a discussion of several studies demonstrating that the
toxicity or pharmacokinetics of certain VOCs can be significantly affected by the
vehicle in which the chemical is administered.
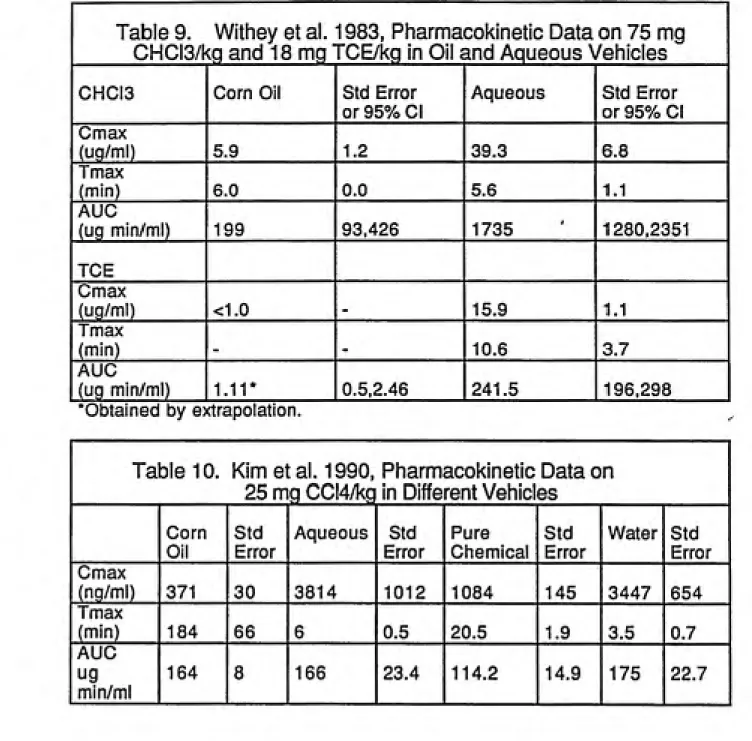
Area under the curve (AUC) blood-concentration time curves and maximum
concentration (Cmax) following intragastric dosing were assessed. Absorption
was rapid in both vehicles but, the rate and extent of absorption varied greatly with vehicle. The peak concentration of CHCI3 in blood after administration was 39.3 ug/ml when administered in water and 5.9 ug/ml when administered in corn oil. This could be due to the faster partitioning of the CHCI3 withmucosal lipids from the aqueous vehicle relative to the oil vehicle since CHCI3
is a lipophilic compound. The time to peak blood concentration occurred
slightly more rapidly with the aqueous vehicle (5.6 min ) than the oil (6.0 min).An even greater difference was observed in the case of TCE where the
AUC ratio of aqueous to oil was 218 (CHCI3 was 8.70). Witheys study
revealed that the most similar uptake between oil and aqueous, based on AUC ratios, occurred with methylene chloride which had the highest aqueoussolubility whereas TCE was the most different and had the lowest aqueous
solubility. Clearly the oil-water partition coefficient had an important bearing on the uptake from an oil solution into the Gl tract showing that the vehicle canproduce substantial effects by altering the systemic bioavailability of a lipophilic
substance. Also the uptake of the VOCs was more pulsed from the oil than the
aqueous possibly due to the dose breaking up into immiscible globules.Chieco et al., (1981) studied the effects of different vehicles (corn oil and aqueous emulsion) when 200 mg 1,1 DCE/kg (dichloroethylene) was given to fed and fasted adult male Sprague-Dawley rats. In the fasted rats massive injury
[(>100 fold increase of alanine aminotransferase (ALT) and aspartate
aminotransferase (AST)] was observed in corn-oil treated animals withmoderate injury (~15 fold increases of ALT and AST) in rats receiving the
aqueous solution. In contrast the fed groups showed only slight liver injury in
Exhalation concentrations were also measured every 15 min for 5 hours. In both fed and fasted animals, the most rapid decline occurred when the compound was administered in aqueous vehicle. The exhalation of 1,1 DCE has an initial rapid phase followed by a slower period occurring one hour following exposure. Exhalation was slightly delayed in the fasted groups in the early phase whereas in the later phase, the vehicle appeared to have a marked
Influence on 1,1 DCE exhalation. The half life of the 1,1 DCE after the 2nd hour
was 103 min for the corn oil vs 42 min for the aqueous. There was little influence of the vehicle on the total percent of the dose exhaled; however, the half life (ti/2) values reflect a marked influence of the administrative vehicle.
Chieco found that the hepatotoxicity of 1,1 DCE in fasted animals was diminished when the compound was given in the aqueous solution, and based on the exhalation of the parent compound can be correlated with the more rapid, clearance of 1,1 DCE from the body. Thus Chieco demonstrated that both fasting and vehicles can greatly affect the absorption and toxicity.
Condie et al. (1986) evaluated the effects of gavage vehicle on the
severity of the subchronic hepatotoxicity of CCI4 in male and female CD-I mice
gavaged with 0, 1.2, 12 or 120 mg CCI4/kg in either corn oil or 1% Tween-60 for 90 days (5 days/week). The study revealed greater hepatotoxicity in the mice that received CCI4 administered in corn oil. In this study the data indicate the NOAEL based on subchronic data in corn oil was 1.2 mg CCI4/kg whereas the NOAEL for aqueous was 12 mg CCI4/kg. In a subchronic study by Bull et al.
(1986), 270 mg/kg/day CHCI3 was administered in corn oil or 2% Emulphor for
90 days in Iml/IOOg dosing volume by stomach tube to male and female B6C3F1 mice. CHCI3 administered in the corn oil vehicle resulted in greaterhepatotoxicity than when the chemical was given in an aqueous vehicle.
mg/kg/day of TCE were administered to male and female B6C3F1 mice in either corn oil or a 20% aqueous solution of emulphor (1ml/100g body weight) for 4 weeks. Within the first week, all male mice exposed to 2400 mg/kg/day died and 8/12 of the female mice died when exposed to 1800 mg/kg/day administered in Emulphor. In contrast, only a few male mice died when exposed to TCE in oil. TCE in Emulphor proved to be more lethal but less hepatotoxic because those that survived for 4 weeks appeared to have less hepatocellular necrosis compared to the animals receiving TCE in oil. Additionally, serum enzyme levels (AST, ALT and LDH) were significantly elevated in the corn oil group compared to the aqueous group. Merrick concludes that the high oil water partition coefficient of TCE for corn oil delays the rate and extent of Gl uptake reducing the peak blood levels over administration in aqueous vehicle, affecting both bioavailability and toxicity.
dosing volumes as the previous study. Differences in the acute hepatotoxicity had been observed in the companion study by Kim et al {1990a) and the objective was to relate the pharmacokinetics of the vehicle effects, bioavailability and absorption to the effects seen in the acute study. Corn oil markedly delayed the absorption of CCI4 from the Gl tract and produced secondary peaks in the blood concentration vs time profile. There was a high degree of correlation of both Cmax and AUC measured from 0 to 120 min with hepatotoxicity. Kim found that CCI4 was less acutely hepatotoxic in corn oil due to delay and prolongation of CCI4 absorption resulting in a marked decrease in the concentration of the chemical in the arterial blood and liver.
E. Chemical Interactions
Toxicological assessment of chemical interactions is a difficult task. It is important not only to assess the biological effects of exposure to chemical mixtures but also the pharmacokinetic influences as well as determining the mechanisms of interaction. This information could aid in the interpretation of the chemical interactions which would allow for tissue dose and species extrapolations and ultimately more accurate assessments of the health risk of multiple chemical exposure.
It has been noted that CHCI3 toxicity is influenced by substances that alter microsomal enzyme activity or hepatic GSH levels (ATSDR, 1989a). Disulfuram, an inhibitor of microsomal drug metabolizing enzymes has been observed to decrease the hepatotoxicity of chloroform (Jorgensen et al., 1988).
Andersen et al. (1987) evaluated the in vivo interaction of TCE and 1,1. dichloroethylene (DCE) in vivo in male Fischer-344 rats. Both compounds are metabolized by single saturable oxidative pathways with high affinity substrate binding. Rats were exposed for six hours to 0, 100, 200, 300 and 400 ppm 1,1 DCE. A dramatic increase in AST levels was observed above the 100 ppm concentration. When coexposed to both 1,1 DCE and TCE, TCE was held constant at 500 ppm and 1,1 DCE concentrations were 300, 713 and 1718 ppm. In the presence of TCE, the concentration response curves were shifted to the right indicating a inhibition of 1,1 DCE metabolism. Consequently, higher concentrations of 1,1 DCE in the presence of TCE were required to produce the same elevation in AST compared to 1,1 DCE alone. An excellent correspondence between predicted and observed behavior was noted when the inhibition was assumed to be purely competitive.
30% solutions in corn oil and rats were killed 24 hours later. When
administered alone 0.1 ml CCI4/kg lowered hepatic P450 concentrations and 0.2 ml CHCI3/kg had no effect. Marked histological changes were seen in animals receiving both chemicals while only modest changes were seen in animals receiving either chemical alone. Both compounds, singly and in combination, failed to alter hepatic GSH concentrations. Harris concluded that by several criteria of hepatotoxicity including serum ALT, triglycerides, calcium concentration and histopathological changes, that subthreshold doses of CHCI3 and CCI4 are hepatotoxic when given together.
Borzellecca et al. (1990) examined the interactions of two pairs of VOCS using male Sprague-Dawley rats (200-250g). CCI4 (0-400 mg/kg) and CHCI3 (0-700 mg/kg) as well as CCI4 (0-400 mg/kg) and TCE (0-400 mg/kg) or the individual chemicals were administered by oral gavage in 5% Emulphor. Borzellecca found that the chemicals in combination displayed a synergistic hepatic response for sorbitol dehydrogenase (SDH), ALT and AST, with the
peak plasma enzyme activity occurring at approximately 36 hours. In this study, animals were fasted for 16-24 hours presurgery, then cannulated via the carotid artery to allow for serial blood sampling. A total of 8 samples were obtained (650ul each). Blood withdrawal and fasting may have stressed the animals causing additional elevations in enzyme levels.
Steup et al. (1991) examined the interactions of CCI4 and CHCI3 as well
as CCI4 and TCE using drinking water for the route of exposure for TCE and
CHCI3 and following with an ip administration of CCI4. Male Fischer-344 rats (175-250g) were pretreated for 3 days by administration of TCE or CHCI3 in their drinking water followed by a challenge dose of Immol CCI4/kg In corn oilincreases in the plasma ALT were observed in response to the CCI4 challenge.
Steup also conducted strain comparisons and investigated the mostappropriate plasma enzyme marker for hepatotoxicity. His results suggest that
the Fischer-344 rat is more sensitive to VOCs and VOC interactions than
Sprague-Dawley rats. The indicator most accurately representing hepatotoxicity and tissue injury was ALT, which provided the clearest evidence of the interactive toxicity consistent with the histological evidence.
Hewitt et al. (1983) demonstrated that the exposure of male Sprague-Dawley rats (150-300g) to a variety of ketones can potentiate the hepatotoxicity of a subsequent exposure to a haioalkane such as CHCI3. Animals were given 15 mmole/kg po of ketones (acetone, 2-butanone, 2-pentanone, 2-hexanone or 2-hepatatone) in corn oil (10 ml/kg) then challenged 18 hours later with 0.5 or 0.75 ml CHCI3/kg ip in corn oil (4ml/kg); liver injury was examined 24 hours later. The relationship between carbon skeleton length of ketonic solvents and potentiation of CHCI3 induced hepatotoxicity was examined. None of the ketones from acetone to heptanone produced appreciable liver injury as neither
did CHCI3 alone. A marked degree of liver injury was produced by CHCI3 in
ketone pretreated rats. The severity of ketone potentiated CHCI3-induced liverdamage correlated with the ketone carbon chain length. The authors suggest
that while carbon chain length is a factor in determining the potentiating capacity of a ketone, other factors are likely to be involved such as metabolite biotransformation. Additionally, a positive correlation between liver weight and ketone chain length was observed. It has been shown that several of the ketonic solvents are capable of inducing hepatic mixed function oxidase activityhepatotoxicity by increasing P450 levels thereby enhancing chloroform metabolism to phosgene and decreasing GSH levels.
Ethanol pretreatment is known to enhance the toxicity of hepatotoxic
agents (Strubelt, 1980). Substances that are potentiated by ethanol are
metabolized in the liver to toxic metabolites and include CCI4, CHCI3 and TCE (Strubelt, 1980). This supports the hypothesis that an induction or activation of
the hepatic microsomal drug metabolizing system is responsible for
ethanol-induced potentiation of hepatotoxicity. Acute or chronic ethanol administration
is known to enhance the MFO activity, to enhance the in vitro and in vivocovalent binding of ""^CCW to liver microsomal protein and to accelerate the in
vitro biotransformation of 14CCI4 to 14002 (Strubelt, 1980).
Pessayre et al. (1982) reported that ip administration of 64 ul CCI4/kg or
1 ml TCE/kg (in 0.5 ml liquid paraffin), did not significantly increase serum ALT
levels and did not significantly decrease hepatic cytochrome P-450
concentrations measured 24 hours later in male Sprague-Dawley rats
(180-220g). However, when CCI4 and TCE were administered simultaneously, ALT
activity increased markedly and a 55% decrease in the hepatic cytochrome
P-450 concentrations was observed. The mechanism of TCE potentiation of CCI4
has been under investigation. Pessayre found an association between lipid
peroxidation and hepatotoxicity which was proposed as the mechanism by
which TCE potentiates CCI4. In contrast, a study by Keflas and Stacy (1989)
showed that lipid peroxidation was not responsible for the TCE-induced
F. Methods of Toxicological Evaluation: Indicators of Hepatic Damage
Toxicological damage to organs can manifest itself in both functional and morphological changes. The morphological or pathological processes involved in the injury will largely determine the functional or biochemical alterations as a result of injury (Plaa and Hewitt,1982). The four categories of tests that are useful specifically for evaluation of hepatic injury include histological analysis, serum enzymes, hepatic excretory function and alterations in chemical constituents (Plaa and Hewitt, 1982).
The hepatic lesions induced by cytotoxic injury occur primarily in the hepatocyte (Tyson et al., 1985). The injury may be characterized by steatosis, the accumulation of lipids or necrosis, the appearance of degenerative processes leading to the death of the cell, a small group of cells (focal necrosis) or zonal damage or damage to virtually all cells in the lobule (massive necrosis) (Plaa and Hewitt, 1982). Cholestatic responses also may occur involving changes in the bile flow resulting in alterations of bile salts and bilirubin concentrations (Plaa and Hewitt, 1982). Hepatomegaly, enlargement of the liver, may be due to increased numbers of cells (hyperplasia) or an increase in cell volume (hypertrophy) (Tyson et a!., 1985) Many, but not all, compounds cause hepatomegaly and there is not always a correlation of hepatomegaly and hepatotoxicity; thus, liver enlargement is viewed by some as an adaptive, functional response rather than atoxic response (Mitoma, 1985).
venule and the portal triad (Plaa and Hewitt, 1982). The acinar model has
corresponding regions of functional specificity and metabolic activity designated
as zones that are not incompatible with the classical description.
Serum enzyme levels have become the standard measure of hepatic
injury (Zimmerman, 1982). They are useful for early detection of liver damage
and for serial sampling over time. The significance of biochemical abnormalities as indices of hepatic injury should be judged by the supporting evidence of histological damage since there are limitations to their uses. Levelsmay increase as a result of leakage from cells due to systemic effects other than
hepatic necrosis and in addition some forms of hepatic injury do not produce
elevations in serum enzyme levels (Zimmerman, 1982).Zimmerman proposed the following classification for serum enzymes in
the detection of hepatic injury:
1. Those reflecting cholestatic alterations such as 5' Nucleotidase (5'NUC) and Alkaline phosphatase (ALK PH).
2. Those reflecting cytotoxic injury subdivided as follows into those:
a) that are nonspecific and can reflect extrahepatic damage, such as
aspartate aminotransferase (AST) and lactate dehydrogenase (LDH).
b) that are mainly in liver, such as alanine aminotransferase (ALT).
c) that are exclusively in liver, such as sorbitol dehydrogenase (SDH).
The investigator states that the enzymes 5'Nuc, AST, LDH and ALT are the most
useful for the detection of hepatic toxicity. They are sensitive to hepatic injuryand reach high concentrations in serum in response to parenchymal injury.
The transaminases are the most widely employed and generally
accepted serum measure of hepatic injury despite equal or greater
hepatospecificity of several other enzymes released to blood as a result of
acute hepatic injury which accounts for the general dependence on the transaminases as a means of detecting toxic liver injury. AST, a cytosolic enzyme is found in several tissues besides liver, including muscle, myocardial and kidney whereas ALT occurs mainly or almost exclusively in the liver (Zimmerman, 1982). In virtually all mammalian species, AST is a sensitive measure of acute hepatic necrosis when accompanied by the elevation of other liver specific enzymes (Zimmerman, 1982). Plaa and Hewitt (1982) note that ALT shows a very good correlation between serum levels and severity of histological lesion since agents that produce severe necrotic lesions also produce pronounced ALT elevation. Thus, ALT allows detection of the presence of liver injury in addition to an estimation of the severity of the lesion by the degree of ALT elevation.
SDH, like AST, is a cytoplasmic enzyme and is relatively specific for hepatocellular damage (Plaa and Hewitt, 1982). In several studies, elevation of SDH has been detected before other enzymes, thus it appears to be one of the most sensitive enzymatic indexes when damage is minimal; however, it appears to be less sensitive than histopathological evaluation (Plaa and Hewitt, 1982).
LDH is widely distributed in mammalian tissue with the myocardium, kidney, liver, and muscle being especially rich. It is ubiquitous and it can be released from erythrocytes with hemolysis; thus, it is highly variable in response to a variety of conditions (Tyson et al., 1985). Total serum enzyme activity of LDH may not be as useful as Isozyme analysis because changes in the isozymes may go undetected. More specificity can be achieved but it does
organ damage (Plaa and Hewitt, 1982). LDH5 is found in rats with liver Injury
and LDH1 and 2 are found in rats with renal damage (Plaa and Hewitt, 1982).
Gopinath et al. (1980) reported on the usefulness of bile acid clearance
and serum bile acid concentrations in rats with acute liver injury for detection of
biliary tract proliferation or obstruction. 5' NUC is another useful indicator of
obstructive liver injury as it is localized in the membranes of the hepatocyte and
bile ductular cells (Plaa and Hewitt, 1982). Alkaline phosphatase is found in the
kidney cortex, intestinal mucosa, bone, placenta and the liver which contains
relatively little in a variety of species including rats (Dooley, 1982).
Chemicals that are hepatotoxic can alter the activity of the hepatic mixed
function oxidase system, thereby changing the rate at which xenobiotics are
metabolized (Plaa and Hewitt, 1982). P450 plays a central role In drug
oxidation and thus serves as the binding site for several chemicals that are
oxidized in the liver to reactive metabolites (Plaa and Hewitt, 1982) including
CHCI3 (Brady et al., 1989) and TCE (Moslen, et al., 1990). The terminal
oxidase of the mixed function oxidase system, cytochrome P-450, is particularly
susceptible to damage and depletion and is an increasingly popular index of
damage to the endoplasmic reticulum (Plaa and Hewitt, 1982).
Finally, the measurement of urea, cholesterol, plasma protein and blood
glucose have been found to be insensitive and nonspecific in the monitoring of
hepatic injury (Zimmerman, 1982).Indicators of Renal Damage
Histological examination of the kidney has been considered a useful
method for detecting chemically induced renal damage and is important in
determining the site of damage (Ohata et al., 1987). Renal pathological lesions
caused by chemical or biological agents primarily result in nephrosis
desquamation of tubule cells (Tyson et al., 1985). Seventy-five percent of the
water the kidney filters is reabsorbed in the proximal convoluted tubule of thenephron and consequently is found to be particularly vulnerable (Price, 1982).
The resulting concentration of the remaining fluid, coupled with the high blood flow thru the kidney (25% cardiac output) makes it particularly vulnerable to toxic attack (Price, 1982).Two of the more commonly used serum indicators for renal injury in
animal toxicity studies are BUN and creatinine. Increases in BUN concentrations can result from any damage to the nephron whether the lesion occurs in the glomeruli or tubules or whether it affects renal blood supply andthus indirectly the glomerular filtration rate (Tyson et al., 1985) BUN provides
no insight into site or nature of the lesion and is generally considered to be arelatively insensitive marker for renal injury (Tyson et al., 1985). Berndt (1976)
noted that measurements of BUN are commonly used to assess glomerular
function. BUN increases as filtration slows or ceases. Serum creatinine is
derived from creatinine in skeletal muscle and is excreted by the kidneys mainly
by glomerular filtration Serum creatinine values do not increase significantly in
renal disease until kidney function is considerably impaired such as severe toxic nephrosis (Tyson et al., 1985). Plasma creatinine levels parallel those ofBUN and are frequently used as a marker for glomerular filtration for acute renal
failure due to xenobiotic-induced damage as well as chronic failure (Berndt,1976).
Ohata et al. (1987) noted that increases in urinary enzyme excretion
precedes other common indicators of nephrotoxicity including the increase in
urinary protein, the decrease in creatinine clearance, the elevation of serum
creatinine and blood urea nitrogen (BUN) and that the increase in urinary
renal damage caused by several nephrotoxic agents. Compared to serum enzymes, urinary indicators in general have received little attention as diagnostic indicators (Price, 1982). The principal reason for the slow development is the difficulty involved with assays of enzymes in a fluid which varies in volume, composition and which is a hostile environment for many enzymes (Price, 1982).
The principal source of urinary enzymes is the kidney while the bladder and urogenital tract contribute comparatively little (Price, 1982). Urinary enzymes have been used in nephrotoxicity studies as noninvasive tests for renal damage and elucidation of the primary site of damage along the nephron. In addition, as excretion is dose related they can be used to assess the nephrotoxicity of xenobiotics (Price, 1982). Urinary enzymes are most valuable during the early acute stages of renal disease but also can provide information on the rate of recovery (Price, 1982). Periodic determination by urinalysis is required because the increases are transient (Ohata et al., 1987). When an enzyme is chosen as a diagnostic indicator, its subcellular and regional location should be known, it should be stable in urine and maintain activity under
storage conditions for a reasonable time at 4^0 (Price, 1982). In addition,
control levels of enzymes in normal serum and urine should be known.
Typically, urine is collected from animals housed in metabolism cages and should be collected over ice. The samples should be filtered or centrifuged to remove hair, debris, fecal and food contamination because of the presence of enzymes in gut flora and commercial food pellets (Price, 1982). Most importantly urinary enzyme and constituent analysis should be done on samples collected over a finite period of time and related to urinary creatinine to reduce intra- and inter-individual variability (Tyson et al., 1985).
collection and sampling site for serum enzyme analysis (Neptun et a!., 1985) and collection conditions for urine enzyme analysis. The routine use of urinalysis in rodent studies for the assessment of kidney function continues to be limited by a need to improve collection methods and handling (Tyson et al., 1985; Sey eta!., 1991).
It is known that there are changes in cortical and medullary metabolism which suggests the differentiation of enzymes along the nephron (Guder and Ross, 1984); however, no enzyme has proven to be entirely specific to a particular region (Price, 1982). AST activity is greatest in the ascending limb and distal convoluted tubule with considerable activity also present in the proximal tubule. AST, a mitochondrial enzyme is found in the cytosol and follows the mitochondrial density along the nephron (Guder and Ross, 1984). Mitochondria are unevenly distributed along the nephron with the greatest density in the thick ascending limb of the loop of Henle and the proximal convoluted tubule (Guder and Ross, 1984). ALT is present in all structures in relatively small amounts except the proximal straight tubule where it is much higher and exceeds that of AST (Guder and Ross, 1984).
In a study by Stonard et al. (1987) the urinary enzyme NAG among
Others was measured as an indicator of papillary damage. When damage occurred, NAG was elevated; thus, it is a useful diagnostic enzymes for that region (Price, 1982). Sustained increases in urine volume and NAG activity
suggest a defect in concentrating ability and therefore also indicative of papillary damage (Price, 1982).
Measurement of nonenzymatic urinary indicators such as total protein, glucose, pH, albumin and osmolality can prove useful information in assessing the functional, as opposed to biochemical, state of the kidney (Price, 1982). Urine volume is used to indicate changes in kidney load and function. In acute renal malfunction, urine volume is either normal or reduced (oliguria) and many well known chemicals such as CCI4 can produce this effect. Frequently however, the initial oliguria may be superceded by a diuretic phase (Tyson et al., 1985). Urine volume, specific gravity and color are somewhat interdependent in that as volume increases color is paler and specific gravity decreases (Tyson et al., 1985). In the assessment of the toxicological significance of biochemical changes, it is important to have sufficient background data on normal ranges of values to be expected in the strain and species used (Tyson et al., 1985). Also, controls should accompany samples and laboratory historical data can provide a good reference for normal ranges.
The use of urinary enzymes to monitor glomerular function suffers two disadvantages. First there are few examples of enzymes which are specific markers for glomeruli. Second, glomerular damage allows the passage of normally excluded plasma enzymes into the tubular fluid which, if not reabsorbed, appear in the urine (Price, 1982). The measurement of urinary excretion of proteins is, however, a useful procedure for the assessment of the
an important aspect of normal renal function. When the selective permeability is decreased, a common occurrence in renal failure, excessive amounts of plasma proteins are excreted (Berndt, 1976). The first proteins to leak through the glomerulus are albumin and alpha-globulin followed by other serum proteins as the damage increases (Tyson et al., 1985), Not all proteinurias should be interpreted as evidence of glomerular dysfunction, although any time an experimental animal excretes increased amounts of protein in urine, glomerular dysfunction is suspected (Berndt, 1976). In addition, increased protein could be due to failure of tubular reabsorption and not glomerular damage. The differentiation of glomerular from tubular proteinuria may be accomplished by separation of high and low molecular weight proteins by gel filtration (Tyson et al., 1985).
Changes in urinary pH can also be nonspecific reflecting adaption to nonrenal physiologic abnormalities. Exposure of urine to air for extended periods of time can render pH measurements useless (Tyson et al., 1985). Consequently, care should be taken in the measurement and interpretation of urine pH. It has been noted that nephrotoxic agents reduce the animal's ability to concentrate urine, changes in urine osmolality occur early but osmolality is not nephro-specific and usually occurs as a prelude to other events (Berndt,
1976).
of renal drug metabolism (Guder and Ross, 1984).
III. Materials and Methods Animals
Male Fischer-344 rats (Charles River Laboratories, Raleigh, NC), 62-65 days old on arrival were housed 2/cage in polyethylene shoebox cages with heat-treated pine-shavings as bedding. Two days later rats were moved to individual plastic Nalgene metabolism cages (Nalgene Corp., Rochester, NY)
for the duration of the experiment including a 3 day acclimation period prior to
chemical treatment.Tap water and feed (Rodent Chow no. F0165 BioServ, Results Brand, Frenchtown NJ) were provided ad libitum. Animals were maintained under
conditions of controlled temperature of 22 2^ C, relative humidity of 50
+/-10% and a 12 hour light-dark cycle with light from 0600 to 1800. Feed and water consumption and body weight were monitored daily. At the end of the 3 day acclimation period, rats were assigned by body weight to one of 12
treatment groups.
Dosing
The treatment groups included dosages of 0, 0.5 or 1.0 ml CHCI3/kg, 0 or
1.0 ml TCE/kg or their factorial combinations in either corn oil or aqueous
vehicle. The solutions were administered at a constant volume of 10 ml/kg for both the oil and aqueous vehicles. The individual chemicals and their binary combinations were administered via a single oral gavage, CHCI3 (Aldrich, Milwaukee, Wl, 99.8+% spectrophotometric grade, Lot No. 04201CX) and TCE(Aldrich, Milwaukee, Wl, 99+% spectrophotometric grade, Lot No. 00723AP)
were prepared in either corn oil (Sigma, St. Louis, MO, Lot No. 80H0835) or
10% Emulphor (GAF Corp., Linden, NJ, EL-620 Lot No. 3053) in deionized
Control animals received only corn oil or 10% Emulphor. One day prior
to dosing, Emulphor-620 and deionized water were heated separately to 40^ C.
A 10% solution of Emulphor was prepared by shaking the deionized water and
Emulphor vigorously and maintaining the solution at 40^ C. Dosing solutions
were prepared in crimp top vials, sealed and shaken then placed in the water bath for 2 hours before being removed, covered and left at room temperature until the following morning when animals were dosed. Chemicals were administered in a constant volume of 10 ml/kg by oral gavage with 20-gauge, 2.5 inch ball-tipped gavage needles attached to a 3.0 ml disposable syringe.
Control animals received vehicles in the same volume.
Safety Precautions
All dosing solutions were made under the ventilated hood in the laboratory. During animal dosing, personnel were required to wear respirators with cartridges for removing organic vapors in addition to protective lab coats and gloves. Dosing was performed in an animal room under negative pressure
ventilation which is restricted for VOC studies.
Experimental Design
Twenty-four hours post exposure, rats were tail bled. Blood was collected using serum separator tubes (Microtainer, Becton-Dickinson, Lincoln Park, NJ Lot No. 1A671) held on ice for 30 minutes then centrifuged at 17,000 x g for 4
minutes. Serum was collected and frozen at -80^ C until analyzed. At 48 hours
rats were weighed then anesthetized with sodium pentobarbital (Nembutal, Abbot Lab., Chicago, III), injected at 50 mg/kg ip. They were bled through the abdominal aorta using serum separator tubes (Becton-Dickinson, Lincoln Park, NJ). The blood was held on ice for 30 minutes then centrifuged at 1000 x g for
Urine Clinical Chemistry
Animals were housed in stainless-steel wire-bottomed plastic Nalgene metabolism cages (Nalgene Corp., Rochester, NY) with a separating funnel
below to separate feces and allow urine to run down into a collecting tube.
Refrigerant ice packs (Polyform Packer Corp., Wheeler, IL) surrounded thecollection tube to keep the samples cold. A baseline urine sample was
collected for 12 hours prior to dosing in addition to collection from 0 to 6 hours,
6 to 12 hours, 12 to 24 hours 24 to 36 hours and 36 to 48 hours post gavage.
Samples were centrifuged at 800 x g for 10 minutes at 40c then poured into
clean tubes.
Osmolality, pH and volume were measured immediately following urine
collection. Remaining urine samples were held at 40C and within 24 hours of
the urine collection, urine chemistry profiles were determined by automated
procedures using a Centrifichem-500 centrifugal analyzer (Baker Instruments
Co., Allentown, PA) and appropriate reagent kits. Analysis inlcuded determination of activities of aspartate aminotransferase (AST), alanine aminotransferase (ALT), alkaline phosphatase (ALKPH) and lactate dehydrogenase (LDH) and the concentrations of creatinine (CRE), urea nitrogen (UN) and total protein. Remaining urine samples were frozen at-400C as is or in 10% glycerol (Sigma St Louis, MO, Lot No. 10H0549).
Serum Clinical Chemistry
Serum chemistry profiles were determined by automated procedures
using a Centrifichem-500 centrifugal analyzer. Analysis included determination
of activities of aspartate aminotransferase (AST), alanine aminotransferase
(ALT), alkaline phosphatase (ALKPH), lactate dehydrogenase (LDH), sorbitol
creatinine (CRE), blood urea nitrogen (BUN), bile acids, triglycerides (TRIG), total billinjbin (TBILJ) on the 48 hour samples and the determination of ALT and bile acids on the 24 hour samples. Parameters for the 24 hour samples were selected based on expected sensitivity from preliminary experimental data and quantity of serum required for the analysis.
Histology
regenerative foci, increased number of tubular protein casts, increased glomerular damage with adhesions between the glomerular tuft and perietal epithelial cytoplasm with 50-75% of the cortex affected); and marked (diffuse
involvement of cortex, "end-stage" kidney with sufficient impairment to result in
either secondary hyperparathyroidism or contribute to death).
Statistical Methods
Analysis of variance (ANOVA) (SAS Institute, Inc., 1989) was used to assess the statistical significance of CHCI3, TCE and vehicle effects on serum and urinary indicators of toxicity and organ and body weights. In all cases, 0.05 was the level of significance. A Bartlett's test was performed prior to analysis to test for the assumption of homogeneity of variance. The criterion of significance for the homoscedasticity tests was p^ 0.001 (Anderson and McLean, 1974). If the assumption was not satisfied, a log scale transformation was performed to correct for heterogeneity.
A four-way analysis of variance with the factors CHCI3, TCE, vehicle and
experiment and their interactions was performed on each variable. Experiment was included as a blocking factor to remove variability due to the effect of experimental replication. In the majority of analyses of serum and urinary indicators and organ and body weights, at least one interaction with vehicle was significant. Therefore, it was necessary to perform a three-way analysis of variance with CHCI3, TCE and experiment factors on the data for each vehicle.
In the three-way analyses of variance where CHCI3 and TCE did not interact significantly, a Ryan(1959 and 1969)-Einot(1975)-Welsh(1977) (REW) multiple comparison procedure was performed to assess the differences among CHCI3 doses if that main effect was significant (p<0.05).
data at each level of CHCI3 to determine if the difference in TCE was significant. Also, a two-way analysis of variance was done on the data at each level of TCE to assess differences in CHCI3. In these last two analyses if the CHCI3 effect was significant, a REW multiple comparison procedure was done to determine
which dose levels were different from each other.
The serum indicators LDH, CRE, BUN, NUC and AST in addition to body and organ weights were single independent measurements whereas the bile acids and ALT were repeated measures at both 24 and 48 hours. All urinary
indicators were measured over 48 hours at a total of 6 time intervals. These
repeated measures parameters were treated separately at each time point and consequently analyzed using the same approach as the single measure serum indicators.
A 5-way multivariate analysis of variance for repeated measures with the factors CHCI3, TCE, vehicle, time, experiment and their interactions was performed on both ALT and bile acids which were measured at 24 and 48 hours. Experiment was included as a blocking factor to remove variability due to the effect of experimental replication. Vehicle interactions were significant; therefore, it was necessary to perform a three-way analysis of variance to examine the effects of time on each combination of CHCI3 and TCE for each
IV. Results
Acute Hepatic Response Chloroform Toxicity
The administration of 0.5 and 1.0 ml CHCI3/kg alone in corn oil produced a significant decrease, compared to controls, in animal body weight 48 hours post dosing (Figure 3). Consequently relative liver weight (liver weight/body weight) was assessed rather than absolute liver weight. In both the 0.5 and 1.0 ml CHCI3/kg dosage groups there was a significant elevation in relative liver weight over the control animals (Figure 5). The administration of 0.5 and 1.0 ml
CHCI3/kg in the aqueous vehicle produced a significant decrease in body weight at 48 hours with 1.0 ml causing a significant decrease over 0.5 ml CHCI3/kg (Figure 4). Relative liver weight, in the aqueous group, was significantly decreased by 1.0 ml CHCI3/kg (Figure 6).
Serum enzyme indicators used for the detection of hepatic damage included LDH, AST and 5'Nuc which were measured at 48 hours post dosing. Additionally, ALT and bile acids were measured at both 24 and 48 hours post dosing in order to assess the effect of time on the observed toxicity. LDH and 5' Nuc were significantly elevated at 48 hours when 0.5 and 1.0 ml CHCI3/kg alone were administered in oil (Figures 7 and 11). AST enzyme levels were also significantly elevated over the control group at 0.5 and 1.0 ml CHCI3/kg in oil with 0.5 ml CHCI3/kg causing significantly greater elevations of AST than 1.0 ml CHCI3/kg (Figure 9). When administered in the aqueous vehicle,