Michael
Luger
isa professorat theDepartment
ofCityand
RegionalPlanningand
chairman ofthe CurriculuminPublic Policy AnalysisattheUniversityofNorth CarolinaatChapel
Hill
Kenneth
M. Temkin
is currentlya research associateat theUrban
Institutein
Washington,
D.C He
receivedhisPh.D. inCity
and
Regional Planningfrom
theUniversityofNorth CarolinaatChapel Hillin 1997.
Editors'Note: This
paper
was
originally preparedforpresentationatthe
American
RealEstateand Urban Economics
AssociationConferencein
May
1998.
Who
Pays
in
the
End?
Residential
Developers'
'Rule
of
Thumb'
and
the
Incidence
of
Regulatory
Costs
Michael
I,Luger
and
Kenneth
M. Temkin
Sincethe turn
of
the century,governments
have
placedrestrictionson
the locationand
characteristicsof
new
buildings,theprimary
reason beingtherec-ognition that
new
construction created negative side-effects for surroundingresidents.'
Consequently,
itisdifficultformost
housing
analysts toadvocate
eliminatingallgovernment
regulationsrelating tohousing
production.How-ever, there is
disagreement
among
housing
policyobserversaboutwhat
levelof
regulationsis socially desirable.The
key
taskof
researchers isto establish the costsof
regulationsothatthe benefitsof
these regulations,which
accrueboth
tothehome
buyer
and
residentsof
the largerneighborhood, can
be
com-pared
tothe costs incurredby
housing consumers.
Therefore,propermeasure-ment
of
regulationcostsisan
essentialelement
of any
policy debate surround-ing regulatoryreform
of
thehousing development
process.Many
studieshave
attemptedtoquantifythe effectof
government
regula-tions
on
home
prices.A
largenumber
of
these studies identifieda positiveand
significantrelationshipbetween
home
pricesinagivengeographicareaand
thepresence
of
regulations,such
aslarge-lotzoning requirements,growth
controlsand
subdivision standards(foranexcellentreview of
thislargebody
of
litera-ture see Fischel 1990).
Moreover,
some
housing
market
analysts argue thathome
ownership
hasmoved
beyond
thereachof
many
Amencan
families be-causeof
the costs associatedwithcomplying with uimecessary
government
regulations.^
While
providingsome
evidenceof
the effectof government
regu-lations,therehasbeen
littleresearchaboutthedecisionprocess used
by
devel-operswhen
facedwith
government
regulations. Therefore, previous studieshave concluded
that regulatory costshave one of
two
effects.Some
studiesshow
costs arepassedforward
on
adollar-for-dollarbasis toconsumers
intheform
of
higherprices.Alternatively,some
studiesshow
government
regulations arepassed
back
tolandowners
in theform of lower
values for developableland.'
Inthis article,
we
arguethattheratioof
the effectsof regulationson
home
pricestothe costsborne
by
developers isgreaterthan one.Many
developerswork
under
a"rule-of-thumb"thathome
prices shouldbe
between
two
tofour times the price paid for land. Consequentiy,government
regulations thatMICHAEL LUGER
andKENNETH
TEMKIN
resultin relativelysmall increases inlandcosts can resultin large increases in the asking price for
new
home. For
example, a regulation that results inan
additional$10,000
in costs to the developerwould
acmallybe
passedon
to thebuyer
as a$20,000
to$40,000
increase in final costs. Obviously, marketconditions
wiU
affectthe ultimate pricepaidby
con-sumers; however,toacertainextent,new home
prices will reflectsome
multipleofregulatory costs associ-ated withthedevelopment
process. Ifso, regulatorsmust
be
awarethatregulationswithseeminglymodest
effects
on
land pricesmay
result in relatively highincreases to
newly
constructedhome
prices.The
remainderofthisarticleisorganizedintofoursections.
The
nextsectionpresentsaschematicmodel
ofadevelopea-'sdecision calculusalong witha discus-sionofhow
government
regulations affectthedevel-opment
process. In the third section,we
develop amodel
toexplainwhy
government
regulationswould
have
a multiphedeffecton
prices. In the fourthsec-tion,
"Methods
andAnalysis,"we
presentourresearchmethodology and
results.The
finalsectionprovidesadiscussionofthepolicyimpHcations of ourfindings.
A
Conceptual
Framework
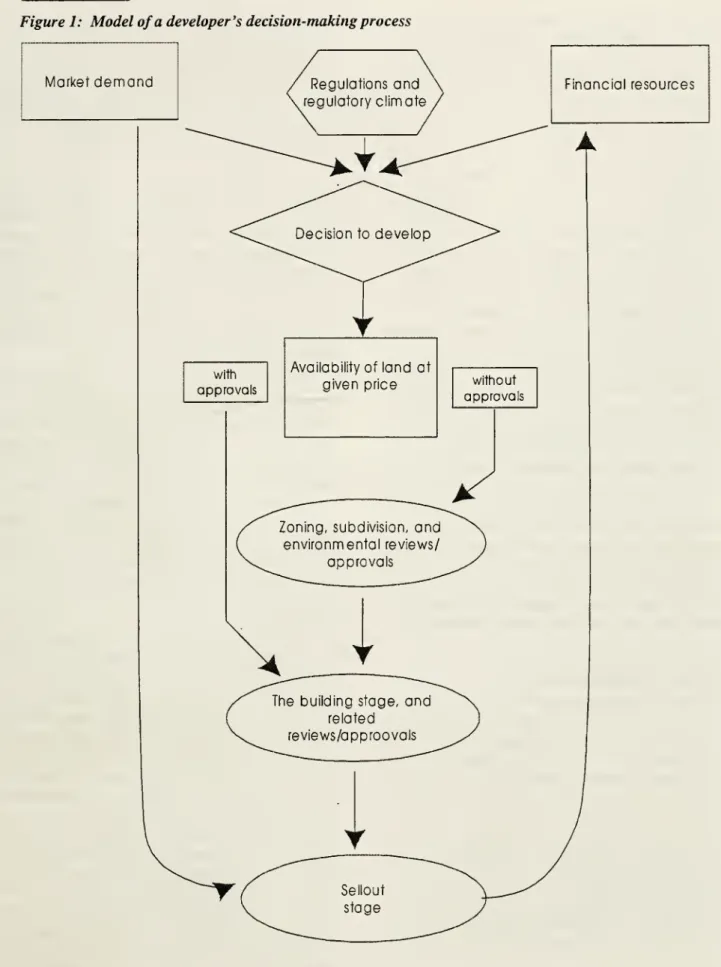
Figiire 1 illustratesadeveloper's decision
calcu-lus.
The
model
ispredicatedon
theassumption
thatadeveloperhas
some
predetermined notion ofboth
the typesofregulationstheywillfaceand
thetimeneeded to complete the project. Therefore, a developer's decisionswiU
reflecttheanswerstoseveral questions.Did
theyknow
beforehandwhat
therestrictionswere,and
thenfactorthem
intoprojectplanning?How
didhe
or sherespond to therestrictions:By
seeking tochange them?
By
offeringless forthelandthanhe
orshe otherwise
would?
By
changingprojectdesign?By
changingthe pricingofunits?
Or
didhe
orshe miscal-culatethe costs or delays sothatthebottom
linewas
reduced?The
development
environmentthat existswhen
adeveloper contemplates a project includes several
components.
There
is the aspect ofmarket
demand
(thetypesofunitsthe
buying
pubhc
wants bmlt), an elementaffectedby
macxoeconomic
conditions, demo-graphics,and
tastes.The
financialresources available to thedeveloperis afactor affectedby
macroeconomic
conditionsand
the developer's past success.The
development
environmentalso incorporatestheregu-latory miheu,
which
includesapphcable
ordinancesand
statutes, precedent,and
practice in particularplaces.
Once
a developer decidestoembark
on
aproject (taking intoaccountthe three factors just discussed),he
orshe attemptstofindlandthatis "pricedright." Thatmay mean
landthat is partof abankruptcy
orunder RealEstateInvestment Trust
(REIT)
control~
resultingitsbeingpricedunder
market
value.On
the otherhand,the parcelmay
be
solargethatitis afford-ableforonlywell-capitalizedbuyers.The
developer's searchfortherightpricemay
alsomean
aseller will accede to terms the developer considers favorable, includingadiscoimtedsaleprice,or asaleconditionalon
obtainingnecessaryapprovals.The
priceof land shouldreflectwhetherithas ap-provals inplace. Ifitdoes,buildingcan beginprior tofinal approvals for foundations,
hookups,
or othersuch items.
There
may
be
delays,but theynormally willbe
shorterthanin theabsence ofpriorapprovals.When
landisbought
withoutapprovals, thedevelopermust
seek them.Whether
or not a developer paid a"properprice" forlandwill
depend
on
how
longand
costly theapproval processwas
relativetowhat
he
orsheexpected.
A
developerobviouslywants to gettothe sellout stage as quickly as possible. Ifthere are
unexpecteddelays alongthe
way,
marketdemand
may
have
changed,making
theproducthardto sell atthe desiredprice.Iflandisbought
outright,thereare also carrying costsassociatedwithdelays.Both
thetimingofthedevelopment
processand
theaccuracyofallactors' expectationsdeterminethe incidence of the regulatory burden. In aworld
ofperfect information
—
no
stirprises—
and
completemobihty
ofcapital, stricterrequirements for develop-ers and longer delayswould
not negatively affect developers in the long run. Ifthey acted rationally, theywould
not stay inthedevelopment
business if they could not earn a risk-adjusted, economy-viide, averagerateofreturn.Rather thantietheirresourcesup
in building,and
earning, say, a 6 percent rateof return,theywould
seek higherreturns by, say, invest-ing in equities ormanufacturing widgets.That would
reducethesupplyofhousing
beingbuUt and
raise the pricebecause of excessdemand. That
should inducemore
buildersintothe regulated market.Consequently,thelikelylong-run incidenceiseither
on homebuyers,
who
pay
higherprices,oron
landowners,who
receiveFigure
1:Model
of a
developer'sdecision-making process
Market
demand
Regulationsand
regulatory climate
Financial resources
with
approvals
Availabilityofland at
given price without
approvals
The building stage,
and
related
reviews/approovals
MICHAEL LUGER
andKENNETH
TEMKIN
However,
the incidenceofregulation costsis also affectedby
thefactthatthereisalimiton what
home-buyers can
spend
annxiaUy for a house,normally about30
percentofgrossincome.As
the costofregulation drivesup
housingprices,demand
fallsand
thebottom
end
ofthehousing market drops out, leaving mostly high-end housesinthebuildingpipeline. Thus,lowerand middle-income
households bear the burden, not simply through higherhome
ownership costs, but throughtheunavaUabUityofhomes
in theirprice range.Presumably,rentsrise as well,in
which
casethereisa loss ofconsumer
surplus.Or
therecouldbe
a welfareloss
due
to doubling up,Uving
with parents, Uvingfarther
away
from
work
where
housingis less expen-sive,and
soon.The
outcomes
oftheregulatoryprocesseswe
de-scribemay
deviatefrom what
legislatorsand
regulatorsintended
when
draftingstatutes,ordinances,and
rules.For
example, staff shortages tendto create delays inappUcationreviews. In addition, miiltiplereviews at differentlevels of
government
extendthe permittingtimeline
and
may
lead to inconsistent discretionary requirements. Also, regulatorswho
have
some
flexibil-ity (toaccommodate
awide
range ofsound
proposals)sometimes
useittodeny
ordelayprojectsthatmay
be
in technicalcoropliancebut faUto
meet
thespiritoftherules. Similarly,
pubhc
hearingsand
court appeals,intendedinpart to ensure that
government
officialsfoUow
therules,are alsopowerfultoolsforopponentsof developments. Foes canusehearingstopoUticize
an
appro\'alprocessand
convinceelectedofficialsnot tofoUow
therules,ortodelay and/orkillprojects.A
Model
of theEffectsof
Regulation
on
Home
PricesOur
working
hypothesis is thatsome
costs of regvilationresultingfrom
factorsdiscussedabove
will result inprice increasesthatare greaterthanthe actual costsborne
by
the developer.This hypothesisisbased
on
thesimphfied housing productionmodel
inEquation 1:H
=
AS"L^
(1)H
istheoutput of housing,measured
as abundle
that includes land and biuldings; Sand
L
represent structuresand
land, respectively;and
A
,a
,and
/3areparametersthatrepresent neutral technicalprogress
and
the shares of structuresand
land in production.respectively.
Assuming
constant orshghtlyincreasingeconomies
ofscale, CC and fi willeachbe
lessthan1. Differentiating (1)withrespect toland(9H/ 3
L),and
settingthatequaltothe real "rental rate"on
land (r), aswould
be
appropriateinlong-run equihbrium,yieldstheexpression
shown
inEquation
2:PH
=
-P
(2)
Here,
pH
isthecostofhousing
and rL
is the costofthelandrequired foritsproduction.
A
doUar change
inthenumeratoron
therighthand
side,due,forexam-ple, toregulation,changes theleft
hand
sideby more
thanadollar,aslongas /3 islessthanone.For
exam-ple, foraparameter value of0.5, adollarincrease in the costof land(rL)
woidd
have
tobe
accompanied
by
atwo-dollar increase in the costof housing(pH)forthe
equahty
tohold.The
smaller )S is(lessthanone),the largerApH
forany doUar
change
in rL. Since /3 is directiy pro-portional totheelasticityofdemand
forhousing withrespect to the price
of
land,we
can seethat less elasticdemand
allowsregulatory costs tobe
passed forwardmore
readily.Because
landisunmobUe,
thereshouldbe
alower
ovm-price elasticityofdemand
foritthanforstructures(this
was
theorizedby
Sommervfllein1996).This hypothesis
was
testedusing datacollectedfrom
builder/developers inNew
Jersey.A
discussionofthedata
and
the resultsfoUow
inthenextsection.Methods
and
Analysis
The
results presented in thispaper
are derivedfrom
alargerstudyofdevelopersand
regulatorsinNew
Jerseyand
North
Carolina.'*As
part ofthe studywe
conducted
two
typesofprimary datacollectionefforts.The
firsttypeof datacollectedwas from
questionnairesmailedtoastratified
sample of
850
builders/developers inNew
Jersey.(The sample was
stratifiedin order toensuregeographiccoverageoftheentirestate.)
Two
hundred
biulders/developersthroughoutthestatewere
randomly
selected toreceive a "short" questionnaire;longerquestionnaires
were
sent totheremaining650
buUder/developers in each of four regions: theNew
York
commuting
shed; theRoute
1corridor;thePhila-delphia
commuting
shed;and
elsewherein thestate .(Luger, et al., 1998, presents details of the survey
methodology, sampling
strategy,and
validity issues.)(approxi-REGULATORY
COSTS:
WHO
PAYS
IN
THE END?
the short
form
by
300;we
also sent severalhundred
replacementquestionnairestotheoriginalsample.The
second
typeofdata collectedcame
from
tele-phone
interviews with66
builder/developersdrawn
from
thesame
sample
asour mailsurvey.We
dividedthe interviewedpartiesintofour panels.
The
firstpanel of respondentswas
askedthefollowingquestions:Assuming
thatthere isademand
inyour
market for
completed
homes
sellingfor$500,000 on
half-acre lots:In
a
typical case,what
isthemost you
would
put
into thehard
coststobuildthehouse
and
appur-tenances (brick,lumber
and
directlabor?)In
a
typicalsituationwhat
isthemost
you
would
pay
for
thatimproved
lot, with allapprovals in place (construction, subdivision,and
environ-mental)?(Disregardthe possibilityof additionalcosts
for impact
fees, dedications, etc.)Again
ina
typical case,what
is themost
you
would
have
paid
forthatsame
lotina
subdivi-sion if
approvals
were
inplace, butwithoutany
improvements?
What
is themost you
would
have
paid
for thatsame
lot ina
subdivision, but withouteither ap-provalsor
improvements?
We
alsoaskedthesequestionstothesame
panelofbiiilder/developers fora
$500,000
home
on
atwo-acre lot. PanelTwo
was
askedthesame
questions forhalf-and two-acre lots,but for a
$250,000
selling price. PanelThree
was
askedthe questions for a$125,000
home
on
ahalf-acrelot,and PanelFour
fora$750,000
home
on
two
acres.The
"willingnesstopay"
questionsareconsistentwiththecontingent valuationapproach
commonly
used inenvironmental research. In this case, ourpurpose
was
to ascertainhow
builders value approvalsand
improvements.We
used
differentlyvalued propertiesto account for possible non-linearities in thedemand
curve.
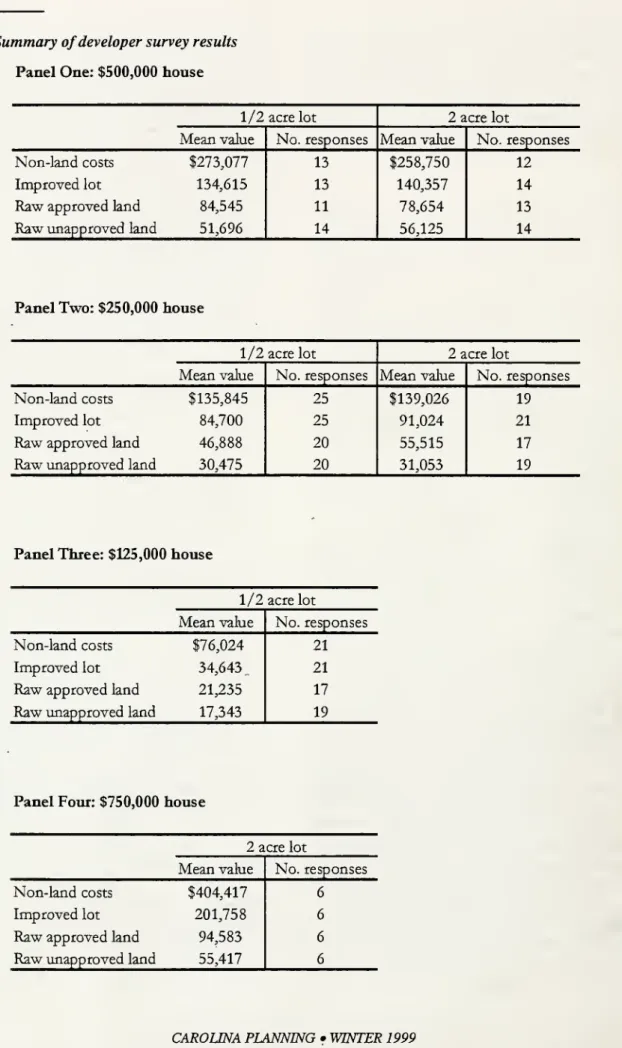
Table
1reports themean
values.Note
that the pricepaid forimproved,approved
land plus the cost of non-landimprovements
do
notsum
totheselling price. Inpart, thisis aconsequence
ofthedatadistribution(summing
mean
values);how-ever thereis also aprofit
margin
to consider.The
table indicates the followingratesofreturn to builder/developersFor
a$750,000
home
on 2
acres: 23.7percentFor
a$500,000
home
on
V2 acre:22.6percentFora
$500,000
home
on
2acres: 25.3percentFor
a$250,000
home
on
V2 acre: 13.4percentFor
a$250,000
home
on
2
acres: 8.9percentFor
a$125,000
home
on
V2 acre: 13.0percentThose
estimates are consistent withwhat
devel-oper/builders claimin
foUow-up
interviewsamong
a subsample
of questionnaire respondents: that higher rates ofreturnaccrue tohigher-valued property,per-haps
becausethepriceelasticityofdemand
forhousing isrelativelysmall forthehighestincome
households, allowingmore
regulatory costs tobe
passedforward.(Notethatthe figures are
rough
proxiesofactualrates ofreturn,because
theydo
not includefinancingcosts,and
are not annuahzed.)The
longer adevelopment
project takes,thelowertheannualizedrateofreturn,which
is the relevant indicator of financial viabihty.The
datainTable1roughly agree withour mail survey responsesfrom
New
Jerseybuilder/ developers.The
median
priceofnew
homes
buUt
by
our respondentswas
$236,000, and
themedian
sizeofadevelopedlotwas
0.8 acres.The raw
landcomponent
ofthatparcelwas
$24,000,and
themedian
perparcel cost forim-provements
was
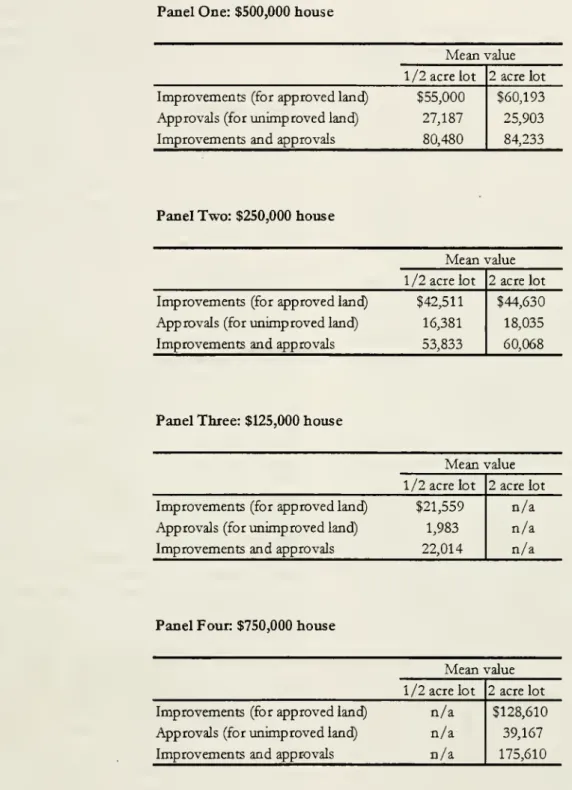
$27,900.The
responses inTable
1 canbe
translatedintothe costs for approved,unimproved and
improved,ap-proved
lots,asshown
inTable
2.The
offering prices in the table are hypothetical.For
example, a developerwould
be
willing topay
$27
,187more
forunimproved
landwithapprovalsthanfor
unimproved
land without approvals for aplanned$500,000
home
on
halfan
acre.As
expected, themore
expensivea
home,
the largerthis difference. (Notethatthe relatively small differences
between
themean
values for one-half acreand
two-acre lotswere
notsignificant as
measured
by
a t-test.)The
firstrow
ineach panel ofthe table alsoprovides a basis for
esti-mating
improvement
costs,which
rangefrom
10.7percent to 15.1 percent ofthesales price. Itis worth-whileto note that the written developer surveys re-vealed that hypothetical cost of
improvements,
if weightedby
themix
ofdifferent-valuedhomes
inNew
Jersey,would
be
in the$22,000
range.The
survey responses indicated that per-lotimprovements were
11.8percentofthe salesprice.
MICHAEL LUGER
andKENNETH
TEMKIN
Table
1:Summary
of
developer surveyresultsPanel
One:
$500,000
house
1/2
acrelot 2acre lotMean
valueNo.
responsesMean
valueNo.
responsesNon-land
costs$273,077
131258,750
12Improved
lot 134,615 13 140,35714
Raw
approved
land 84,545 1178,654
13Raw
unapproved
land 51,696 14 56,12514
Panel
Two:
$250,000
house
1/2
acrelot2
acre lotMean
valueNo.
responsesMean
valueNo.
responsesNon-land
costs$135,845
25
$139,026
19Improved
lot 84,70025
91,024
21Raw
approved
land 46,88820
55,515 17Raw
unapproved
land 30,47520
31,053 19I
Panel
Three:
$125,000house
1/2
acrelotMean
valueNo
responsesNon-land
costs$76,024
21Improved
lot 34,64321
Raw
approved
land 21,235 17Raw
unapproved
land 17,343 19Panel
Four: $750,000
house
2
acrelotMean
valueNo.
responsesNon-land
costs$404,417
Improved
lot201,758
Raw
approved
land 94,583Table2:Costs
of approvals
and
improvements
Panel
One:
$500,000house
Mean
value1/2acre lot
Improvements
(forapprovedland) 155,000 Approvals (forunimproved
land) 27,187Improvements and
approvals 80,4802 acrelot
160,193
25,903
84,233
Panel
Two:
$250,000house
Mean
value1/2acrelot 2acrelot
Improvements
(forapprovedland) |42,511Approvals(for
unimproved
land) 16,381Improvements and
approvals 53,833$44,630
18,035
60,068
Panel
Three: $125,000house
Mean
value1/2acrelot 2acre lot
Improvements
(forapprovedland) |21,559 Approvals (forunimproved
land) 1,983Improvements
andapprovals 22,014n/a
n/a
n/a
Panel
Four: $750,000house
Mean
value1/2acre lot 2 acrelot
Improvements
(forapprovedland)n/a
Approvals(forunimproved
land)n/a-Improvements
andapprovalsn/a
3128,610
39,167
175,610
Table 2isbased
on
theassumptionthatdevelopershave
a targetmarket inmind when
undertakingproj-ects,
and
changes inthe cost of approvals affect the pricingofland.However,
thisis anextreme
assump-tion. Consider, forexample, a$125,000 house on
ahalf-acrelot.
A
landowner
may
agree to sellthat lot withoutapprovals orimprovements,
not for$17,434, but for $20,000.A
developerwould
then assesswhetherthe extra
$2,600
couldbe
passedonto a buyer,or if
he
or she couldMve
withalower
rate ofreturn.MICHAEL LUGER
andKENNETH
TEMKIN
The
answer dependson market
conditions in aparticu-larplaceata particular
moment
intime(asreflected in the priceelasticityofdemand).
The
issue of the incidence of cost changes forstructures
and
landwas
addressed empiricallyby
SomerviUe
(1996).He
demonstratedthatunexpected changesinthe costofland,suchasthosedue
to unan-ticipatedregulatory delays, areborne
in theshortrunby
builders ordevelopers inlowerprofits,butunex-pected increasesinthe costof astructure
can
be
passedon
toconsumers
in higher fmal prices. Therefore,"bunder behavior
would
be
expectedtobe
much
more
sensitive tolandcosts
because
theydirectly affectthe builder'sbottom
line^".Over
time,diminished supplywould
affectpricesthroughnormal
supplyand
demand
adjustments.
In addition tobeing supported
by
thecontingentvaluation data, the rule-of-thumb multipher is also evident in our analysis of mail surveys
from
New
Jersey builder/developers. Eightrespondentsestimated the
median
increase in the price of ahouse due
tozoningrestrictions(whichrequired
them
tochange
thedesign and/orlayoutoftheirprojects) to
be
$50,000.Using
the multiplierof 4.0for theratiobetween
salespricechanges
and
raw
landprice value, thatestimate shouldtranslatebackward
intoaraw
landprice differ-ence of $12,500. Indeed,therespondentswho
provided an estimate ofthechange
inraw
land valuedue
to zoning restrictionsgave
amedian
figure of approxi-mately $7,000.The
higherimpUed
multiplier (closeto7.0)is
most
likelyanartifactofthesmall unrepresen-tativesample
ofbuilder/developersrespondingto thatquestion,butitisofthe rightorderof magnitude.
These
findings indicate thatthereismore
than ahousing prices, the extent of
which
wUl
varyfrom
projecttoprojectdependingon
localconditions,house
size, land-to-structures ratio,
and
other factors. Thistranslation occurs
whether
the cost of regulation is accounted for in the non-land (structures) or landcomponent
ofthehousing
biondle, sinceboth
share parameters, j3and
a,,areless than 1.However,
itisgreaterforthoseelements
of
landcostssince /3<a
.
Thatrelationshiphelpsustinderstandthe
relation-ship
between
home
pricesand
regulation costs insome
ofthesurveyresponses. Builder/developersindicated, forexample,that
open
spaceset-asidescausedthem
to raise the price ofamedian
finished unitby
$3,500.Using
a multiplierof4.0, thatmeans
that the actualSimilarly,delay coststendtotranslate intohighersales
prices with this multipher effect.
For
example,we
notedearher that each
12-month
delayaddsapproxi-mately
$1,500
per unit in additional carrying costs,which
would
translate into atmost
$6,000
more
for a buyer.These
price translations reflect long-run re-sponsestoregulatorycosts;inthe short-term, builders react ina varietyofways
to regulatorycosts.While
ourfindings arebased
on
arelativelysmall sample,the consistencyoftheresultsderivedfrom
boththe contingent valuation
and
surveydata suggestthatarule-of-thumbis
used
in practiceby
developerswhen
determiningtheoptimalcapital/landratioofproduction
costs. Increases in the costof
raw
land or the costofimproved
land are passed along toconsumers
inamotmts
greater than the costs paidby
developers.Lx)calcircimistances dictate the ultimate incidenceof
government
regulations,but buUder/developers attempt tomaintaina fixed capital/land costratiowhen
devel-oping
an
initialaskingprice.The
pohcy
inqjhcationsof thisresultarediscussedin theconcludingsection.Conclusions
and
PolicyImplicationsThe
factthattheelasticityofdemand
forhousing with respect to price is less than zero has another important consequence: a dollaradded
tothe priceof landdue
tothe capitalizationofthe required regulatoryapproval adds
more
than a dollar to the final selling price.That
multipher rangesfrom
two
tosix,depend-ing
on
thevalueoftheproperty beingsoldaswellason
theway
land-priceismeasured
(with or withoutim-provements
in place). In general,a multipher offouris not unreasonable; thismeans
thatwhen
a developer expectsregulation to cost adoUar
(substantively or inproceduraldelay),
on
averagehe
orshewillattenpttoincrease
by $4
thepriceofthehouses beingbuilt.The
phrase"on
average" is important, because surveydatashowed
awide
range ofactualexperiencesamong
builder/developers.Of
57
respondents to aquestion about the incidence of subdivision
require-ments,forexample, 19indicatedtheychangedtheoffer
price for land,
and
19 saidtheychanged
the pricingof units. Similarly,of
64
respondents,22
said stringent zoningaffects their offer-pricesforland,while10said it affectedtheir selling prices. In addition,74
of230
respondents indicated lower land-price offers in re-sponsetoenvironmentalregulations,while39
saidtheycharged
more
for a house.Moreover,
themedian
regulations reduced a developer's
bottom
lineby
1 percentagepoint.To
conclude, our article suggests thatregulatory costs to consumers, in certain circumstances,may
exceedcosts
borne
by
builder/developers.Many
devel-opersdescribearule-of-thumb
where
landcostsmake-up
a fixedpercentage (usuallyaround25
percent)oftheaskingprice for
new
homes.
As
aresult,relativelymodest
additional costs forlandresultingfrom
gov-ernment
regulationmay
translate into sizeable price increases facedby
consvimersofnew
housing. Iftrue,regulators
must
be
keenly aware ofthefullcostimpacts ofadditional regulationsinordertogeneratean accu-ratecost-benefit assessment ofregtiia|^nsinitiatedto fostersociallydesirableobjectives.Endnotes
'Lubove, 1981.
Advisory
Commission
onRegulatoryBarriersto Afford-ableHoTisiag, 1991,Lowry
andFerguson, 1992, Na-tionalAssociation of Homebuilders, 1995.^Dealdn
1989,
Knapp
and Nelson1988,WachterandCho
1991."Lugeretal, 1988.
Lugeretal., 1998, presents detailsofthesurvey method-ology, sanqilingstrategy,andvalidity issues.
The
contingentvaluationapproachisa techniqueusedtovaluebenefitsor resourcesthroughtheconstructionof ahypotheticalsituation. Individuals aresurveyedand askedtovaluethe
good
inquestionbasedoninforma-tionpresentedin thebackgroundscenario. For
more
information, refertoPaterson,Lugerand Lindsay 1995.
SomerviUe,p.410.
This translatesinto 2.54 percent ofthe medianhousing priceperyear, or 0.2percent per
month
This islessthan the 1.2 percent per
month
estimated by Seidel(1978),which presumablyreflects changesin interest ratesand housingvaluessincethat time.
References
Advisory
Commission
onRegulatoryBarrierstoAfford-ableHousing (Kean Commission).1991.
NIMBY:
Regulatory BarrierstoAffordableHousing.U.S.
DepartmentofHousing and
Urban
Development, Washington,DC.
Deakin,E. 1989.
Growth
controlsand growthmanage-ment
A
summary
andreview of empirical research D. Brower, D. GodschalkandD.
Porter, eds.Under-standing
Growth
Management
Wasinng^on,D.C.:The Urban Land
Institute.Fischel.
W.
1990.Do
Growth
ControlsMatter?A
Review of Empirical Evidence on the Effectivenessand
Effi-ciencyof Local
Government
Land
UseRegulation.Washington,D.C.LincolnInstituteof
Land
PoUcy.Knapp,G.and A.Nelson. 1988.
The
effectsofregionallandusecontrolinOregon:
A
theoreticaland enq)iri-calreviewThe Review of RegionalStudies 18:37-46.Lowry,I.andB.Ferguson. 1992.Development
Regula-tion
and
HousingAffordability.Urban Land
Institute, Washington,DC.
Lubove,R. 1981.
The
rootsofurbanplanning.R.Lubove
ed. The
Urban
Community:Housing
and
Planning in theProgressiveEra
Westport, Conn.:Greenwood
Press.
Luger, Michael. 1998,
Ken
Temkin, SpencerCowan
andArt Wells.TheEffectsof
Government
Regulationson HousingPricesinNew
Jerseyand
North Carolina.Report Prepared for
Housing
New
Jerseyand
the StateofNew
JerseyDepartment ofCommunity
Af-fairs.Report
NationalAssociationofHomebuilders. 1995.TheTruth
About
Regulationsand
theCost ofHousing.National Association of Homebuilders.Paterson,Robert,MichaelLugerandGregLindsay. 1994.
The
use of contingentvaluationinplanning.Journalof Planning Education
and
Research.Seidel,S. 1978.Housing Costs
and Government
Regula-tions: ConfrontingtheRegulatoryMaze.
The
Centerfor
Urban Pohcy
Research,New
Brunswick, NJ.SommerviUe,C. 1996.
The
contributionof landand structuretobuilderprofitsandhoxise prices.Journal of Housing Research7:127-141.Wachter,S.
andM.
Cho. 1991.Interjurisdictionalprice effectsof land usecontrols. Washington University Journal ofUrban
and
Contemporary Law. 40:49-63.