DISTANCE TRAVELED BY MUNICIPAL SOLID WASTE: AN ANALYSIS OF
DEMOGRAPHIC AND SOCIOECONOMIC EFFECTS
Daniel Rosenbaum
A thesis submitted to the faculty at the University of North Carolina at Chapel Hill in partial fulfillment of the requirements for the degree of Master of Science in Public Health in Environmental Sciences and Engineering in the Gillings School of Global Public Health.
Chapel Hill 2014
Approved by:
Jacqueline MacDonald Gibson
Courtney Woods
ABSTRACT
Daniel Rosenbaum: Distance Traveled by Municipal Solid Waste: An Analysis of Demographic and Socioeconomic Effects
(Under the direction of Dr. Jacqueline MacDonald Gibson)
North Carolina counties increasingly ship municipal solid waste (MSW) long distances
for disposal, which disproportionately burdens a small number of communities with the risks
associated with living near municipal solid waste landfills. Communities that are able to ship
their MSW further may benefit due to decreased exposure to the negative health and economic
impacts of living near landfills. Nonetheless, potential inequities stemming from shipping
distances of MSW have not been previously analyzed. A mixed-effects regression model was
used to test whether the distance that North Carolina counties shipped MSW for disposal was
explained by the racial composition, population density, and wealth level of the counties where
MSW originated in fiscal year 2012-2013. The results show that higher county wealth levels, as
assessed by median house value, were associated with significantly greater shipping distances for
MSW disposal (type III F(1,378)=5.9, p=0.015). The counties with highest home values shipped
their waste 3 miles further away, on average, than those with the lowest house values. The
effects of racial composition were significant but complex: racial composition interacted with
both population density and mass of waste shipped in affecting MSW disposal distances. In
low-population-density counties, a higher minority population fraction was associated with large
whereas the opposite was true in high-population-density counties. By focusing on MSW origin,
TABLE OF CONTENTS
LIST OF TABLES………..vi
LIST OF FIGURES………...vii
LIST OF ABBREVIATIONS………..viii
CHAPTER 1: INTRODUCTION………...……….1
CHAPTER 2: METHODS………...6
Facilities………...………8
Shipping Path Distances……….……….9
Tonnages of MSW Transported………...………9
Statistical Analysis……….10
CHAPTER 3: RESULTS………...…………12
Effect of County Wealth on MSW Shipping Distance………..13
Interacting Effects of Race, Population Density and Tonnage on MSW Shipping Distance………...……….….15
Other Explanatory Variables………..19
Subsidiary Results………..20
CHAPTER 4: DISCUSSION……….23
Limitations……….…24
CHAPTER 5: CONCLUSION………..…………27
REFERENCES………..………30
LIST OF TABLES
Table 1: Independent variables considered for analysis……….….7
Table 2: Type 3 Tests of Fixed Effects (added last)……….….12
LIST OF FIGURES
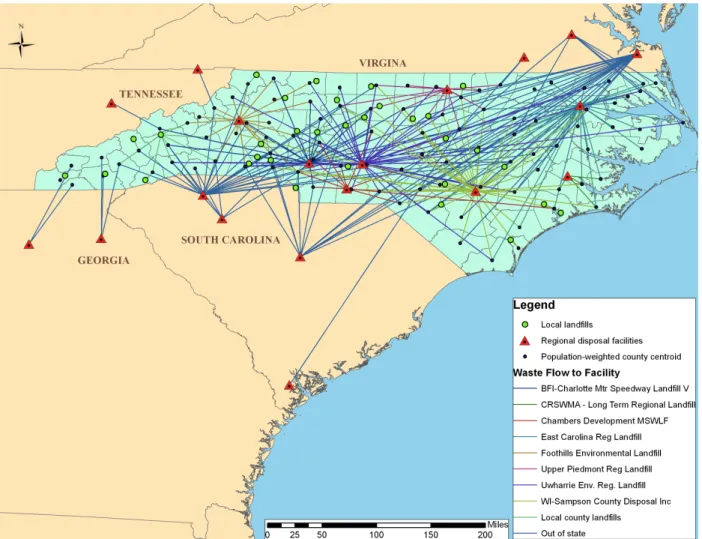
Figure 1: Flow of MSW from county of origin to solid waste facilities in fiscal year 2012-2013..3
Figure 2: NC counties, median house value and waste flow to Uwharrie Regional MSWLF…..15
Figure 3: Relationship between percent non-white*population density interaction term and distance……….….16
Figure 4: Relationship between percent non-white*ln(tons) interaction term and distance……..17
Figure 5: Relationship between percent non-white*population density interaction term and distance………..18
Figure 6: Relationship between percent non-white*population density interaction term and distance………..……19
Figure 7: Fraction of North Carolina MSW shipped out of county of origin versus fraction of MSW disposed in county of origin………...….21
LIST OF ABBREVIATIONS
EPA – United States Environmental Protection Agency
MSW – Municipal Solid Waste
MSWLF – Municipal Solid Waste Landfill
NCDENR – North Carolina Department of Environment and Natural Resources
CHAPTER 1: INTRODUCTION
Since the 1990s, use of regional municipal solid waste landfills (MSWLFs) has been on
the rise in North Carolina and the United States. Municipal solid waste is primarily the
nonhazardous waste disposed by households and commercial establishments and institutions.
The US Environmental Protection Agency (EPA), in implementing regulations required by the
Resource Conservation and Recovery Act (RCRA) Hazardous and Solid Waste Amendments of
1984, required all MSWLFs in operation after January 1, 1998 to meet modern liner criteria.
Landfills not up to standards were forced to close (North Carolina Department of Environment
and Natural Resources, 1997). Meanwhile, total MSW generation increased steadily from 1960
to 2005, and no sufficient alternatives to using MSWLFs emerged (United States Environmental
Protection Agency, 2012; Melosi, 2000). The high costs of permitting, constructing and
operating new MSWLFs was prohibitive for many counties. Additionally, MSWLF capacity was
diminishing, and localities faced difficulties in siting new facilities due to consistent local
opposition.
In response to the changing regulations, difficulties in landfill siting, and increasing waste
generation, local counties (typically the primary managers of MSW in North Carolina) and
private waste disposal companies constructed large MSWLFs, or expanded existing facilities, to
serve different areas of the state (Melosi, 2000; North Carolina Department of Environment and
Natural Resources, 2003). Many of these facilities were permitted to accept MSW from all North
Carolina counties and counties from neighboring states. Local counties and private companies, in
turn, built transfer stations enabling counties to ship MSW long distances by truck to these
regional MSWLFs (North Carolina Department of Environment and Natural Resources, 2003;
The EPA reported in 1995, “Congress recognized in RCRA the importance of regional
solutions and directed states to ‘identify the boundaries of each area … which, as a result of
urban concentrations, geographic conditions, markets, and other factors, is appropriate for
carrying out regional solid waste management’” (US Environmental Protection Agency, 1995).
As a result of this shift from local to regional disposal practices, North Carolina MSW is often
shipped far away from its origin to high-capacity, regional MSWLFs (Figure 1).
Studies of environmental injustices pertaining to MSW disposal have documented
historic geographic inequity in the locations of solid waste disposal facilities (SWDFs). SWDFs
can include MSWLFs, Industrial Waste Landfills, Construction and Demolition Landfills,
Compost facilities, transfer stations, incinerators and others depending on the state. SWDFs
across the United States have been sited disproportionately in low-income, minority
communities. (Bullard, 1983; Bullard, 2000; Bullard, 2005; Mohai et al., 2009; Mohai and Saha,
2006; Martuzzi et al., 2010; Faber and Krieg, 2002; Bullard et al., 2007; Pastor, 2001). A 2007
statewide study of North Carolina found that historic MSWLFs and other SWDFs had been
located, and new facilities were more likely to be sited in, high percentage non-white,
low-wealth communities (Norton et al., 2007).
Research suggests that MSWLFs, the facilities that predominantly accept North
Carolina’s MSW, contribute to increased health and economic risks for neighboring
communities. Risks for cancers (Goldberg et al., 1995; Goldberg et al., 1999), congenital
anomalies and having low or very low birth weight babies have been shown to be higher for
Figure 1: Flow of MSW from county of origin to solid waste facilities in fiscal year 2012-‐2013. Most counties shipped to multiple facilities. Some facilities were regional facilities that accepted waste from long distances (red triangles) and others were local county landfills (green circles). The color of the line corresponds to waste flow to specific facilities.
Emissions of MSWLF gas and MSWLF odor in general increase stress among
neighboring community members and contribute to respiratory problems (Heaney et al., 2011;
Berger et al., 2000; Izhar et al., 2013). Hosting a MSWLF also can mean increased truck traffic,
which can negatively affect air quality, street safety, and noise levels and can exacerbate
community concerns about the facility’s proximity and impact on residents (Baxter, 1999;
dumping also can result from a MSWLF being sited in a community. Research also suggests that
MSWLFs decrease the property values of adjacent homes (Boyle and Kiel, 2001; Nelson, 1992;
Noonan, 2009) and that higher capacity MSWLFs impact property values more severely than
lower capacity facilities (Ready, 2010).
In addition to the negative health and economic impacts associated with living in close
proximity to MSWLFs, hosting a MSWLF can be stigmatizing and a major stress factor for
communities (Eyles et al., 1993; Heaney et al., 2011; Berger et al., 2000; Izhar et al., 2013).
While community concerns are often related to pollution, odor, pests, trucks, noise and potential
health and economic impacts, research shows that many communities attach stigma to taking
waste that originates from outside of their community (Baxter et al., 1999; Sasao, 2004).
Research also suggests that people who perceive that they live very far away from a landfill are
less concerned about landfill location, indicating that there is an advantage to living further away
from a landfill (Johnson and Scicchitano, 2004).
The disproportionate siting of MSWLFs in low-income, and/or high percentage
non-white communities means that these populations are disproportionately exposed to the negative
health and economic impacts associated with residing in close proximity to these facilities. The
use of regional facilities likely exacerbates distributive inequities, because large facilities create a
larger burden for surrounding communities and because these communities are exposed to risks
so that other communities can avoid exposure (English, 1992).
While racial and economic disparities in the siting of MSWLFs and other SWDFs have
been documented in North Carolina and other states, differences among communities that
generate MSW and benefit by not living near MSWLFs have not been studied. The objective of
Carolina MSW is transported can be explained by the racial and socioeconomic makeup of the
disposing communities. The predominant underlying hypothesis for this research is that higher
wealth and lower percentage non-white populations shipped MSW further than lower wealth and
CHAPTER 2: METHODS
To analyze the effects of race, wealth, and population density on MSW shipping
distances, this analysis used a mixed-effects regression model. The dependent variable was the
length of each possible shipping path connecting each county to the destinations disposing of the
county’s waste. In total, 50 different MSWLFs accepted waste from North Carolina’s 100
counties during 2012-2013; 40 facilities were located in state, and the remaining facilities were
out of state (Figure 1). One incinerator (in Portsmouth, Virginia) also accepted a small amount of
North Carolina’s waste. Collectively, these facilities that accepted North Carolina MSW will be
referred to as solid waste disposal facilities (SWDFs) except in instances when only landfills
(MSWLFs) are relevant. Some of the waste travelled directly from the originating county to the
SWDF, while in other cases waste travelled first to a transfer station before shipping to the final
destination. In total in 2012-2013, there were 509 different shipping paths connecting counties to
SWDFs. For 20 of these paths, data on receiving facilities were incomplete, and therefore these
paths were excluded from the analysis. The lengths of the remaining 489 shipping paths are the
dependent variables in this research.
Independent variables were selected to characterize the counties in which MSW
originated and the disposal facilities to which MSW was shipped (Table 1). Independent variable
data were obtained from the sources shown in Table 1. Appendix A provides summary statistics
for all variables.
Percent non-white was selected as the descriptor for county racial composition; this
designation included all people not self-described as white, non-Hispanic in the 2010 Census.
<15%, 15% - <40%, ≥40%. These categories were based on the natural breaks in the distribution
of racial composition among North Carolina’s 100 counties.
Table 1: Independent variables considered for analysis
Variable Description Source
County-of-origin characteristics
Percent non-white US Census, 2010
Median house value American Community Survey 5-Year, 2008-2012
Population density US Census, 2010
Total number of facilities (both active and inactive)
NCDENR, Solid Waste Permitted Facilities List, 2014
(http://portal.ncdenr.org/web/wm/sw/facilitylist)
Region of origin county (Coastal, Mountain,
Piedmont) NCPedia, Counties. (http://ncpedia.org/geography/counties)
Tons of MSW disposed NCDENR MSWLF and transfer station facility annual
reports, 2012-2013
Percentage rural US Census, 2013
Use of a transfer station (Y/N) NCDENR transfer station facility annual reports, 2012-2013
Disposal facility characteristics
Volume remaining at landfill (tons)
NCDENR, Capacity Report, 2012-2013; Georgia Dept. of
Community Affairs, List of 2012 Landfill Remaining
Capacity, 2012; South Carolina Dept. of Health and
Environmental Control, South Carolina Solid Waste
Management Report, 2012; Virginia Department of
Environmental Quality, Solid Waste Managed in Virginia
During Calendar Year 2012, 2013.
Volume remaining at landfill (years)
NCDENR, Capacity Report, 2012-2013; Georgia Dept. of
Community Affairs, List of 2012 Landfill Remaining
Capacity, 2012; South Carolina Dept. of Health and
Environmental Control, South Carolina Solid Waste
Management Report, 2012; Virginia Department of
Environmental Quality, Solid Waste Managed in Virginia
During Calendar Year 2012, 2013.
Privately owned, Publicly owned, or Publicly owned/privately operated facility.
NCDENR, 2013; Norton et al. 2007; Wheelabrator
Technologies Inc., Wheelabrator Portsmouth News, 2010;
South Carolina Dept. of Health and Environmental Control, South Carolina Solid Waste Management Report, 2012.
Regional facility (Y/N) NCDENR Update of the North Carolina Solid Waste
Management Plan 2003 to 2013, 2003.
Tipping fees (disposal facility or transfer station)
NCDENR, Tipping fee report, 2012-2013; Draper Aden
Associates, 2011 Virginia Tipping Fee and Recycling Report,
2011; Wheelabrator Technologies Inc., Wheelabrator
Portsmouth News, 2010; Georgia Dept. of Community
Affairs, MSW and C&D Landfill Tipping Fees: 2009 Solid
Waste Management Update, 2010; Biocycle, The State of Garbage in America, 2010; South Carolina Dept. of Health
and Environmental Control, South Carolina Solid Waste
Consistent with other studies of environmental injustice (Bullard et al., 2007; Norton et
al., 2007), “median value of owner-occupied housing units” was selected as the metric for
community wealth.
To estimate the length of each shipping path (the dependent variable) and the mass of
waste transported along each path (an independent variable in the analysis), data from publicly
available documents were compiled and analyzed. The steps in deriving these variables from
available data are described in the following sections. Then, the statistical analysis process for
exploring the associations of MSW shipping path distances with the independent variables in
Table 1 is described.
Facilities
Coordinates for most of the 51 SWDFs and the 79 transfer stations were obtained in
decimal degree units from a previous analysis of MSW facility siting by Norton et al. (2007). To
obtain coordinates for newer facilities and out-of-state facilities not included in the Norton et al.
analysis, facility addresses were entered into Google Earth, and coordinates in decimal degree
units for the center of landfills were recorded (Google Earth, 2013). For facilities other than
landfills (transfer stations and the one incinerator in Portsmouth, Virginia), the coordinates of
facility entrances were used. All layers were converted into World Geodetic System 1984 datum
(D_WGS_1984), and were projected into World Geodetic System 1984 coordinate system
Shipping Path Distances
The distance of each shipping path was calculated in miles from population-weighted
county centroids to either SWDFs or to SWDFs via transfer stations. ArcGIS version 10.0 OD
cost matrix network analysis tools were used to determine the on-road mileage (Environmental
Systems Research Institute, 2010). Distances were calculated as on-road rather than Euclidian
distances to better estimate the actual distances that MSW traveled for disposal. The network
dataset StreetMap, created by Environmental Systems Research Institute, was used for these
calculations. Due to non-normality, the square root of the distance (rather than the actual
distance) of each shipping path was used as the dependent variable in the final analysis.
Tonnages of MSW Transported
SWDF annual reports provided the annual tonnages that each facility accepted from each
North Carolina county (North Carolina Department of Environment and Natural Resources,
2013). However, if a SWDF received MSW from a transfer station, the facility reported the
county in which the transfer station was located, not the county from which the MSW originated.
Therefore, to determine the MSW tonnage that passed through a transfer station, transfer station
annual reports also were used. Special attention was given to avoid double counting tonnages
from counties that hosted transfer stations. Any tonnages SWDFs reported accepting that were in
excess of tonnages received by transfer stations were assumed to have been sent directly from
the county rather than having passed through a transfer station. Lastly, there were, at times,
discrepancies between MSW volumes that some transfer stations reported accepting from
counties and the volumes reportedly transported to SWDFs. In these cases, the original amounts
contribution to the total tonnage the transfer station received. Due to non-normality, the total
tonnage of waste transported along each shipping path was log-transformed in the final analysis.
Statistical Analysis
A mixed-effects model with random intercept for each county was created using SAS®
software Version 9.2 (SAS Institute, 2009). Within county, MSW shipping paths were
considered to be independent. Mixed-effects models are able to account for correlations among
multiple measurements and therefore are the appropriate model form for this data set, since
counties had multiple shipping paths (Seltman, 2013). All statistical testing was performed at a
two-sided α=0.05 significance level.
The model used augments a traditional ordinary least squares regression with a random
intercept variable for each county. The basic mixed-effects model fit for this study is as follows:
𝑌!" =𝛽!+𝛽!𝑥!"#+ 𝜀!!+ 𝑏!!
where 𝑌!" is the distance of MSW shipping path i originating in county j, 𝛽! is an intercept, 𝛽! is
a vector of model parameters for the k independent variables, 𝑥!"# represents a vector of values
of the k independent variables for shipping path i originating in county j, 𝜀!" is an error term, and
𝑏!! represents a random intercept for each county.
In addition to the above-mentioned conversion of non-white population percentage to a
categorical variable, total number of MSWLF facilities in each county was divided into three
categories (<5, 5 - <10, and ≥10) due to a high variance in the number of existing facilities in
Two-way interactions were tested for percent non-white, median house value, the
log-transformed tons of waste transported on each path, and population density, in order to better
understand the relationships between these variable.
A backward selection method was used, in which all variables (Table 1) were included in
the model and removed based on significance. Independent variables were removed from the
model if the p-value corresponding to the Type III (added-last) F-test was >0.15, beginning with
the highest p-value. Once the final model was selected, restricted maximum likelihood was used
for determination of parameter estimates.
The null hypotheses for Type III F-tests were that the corresponding parameter estimate
was 0, controlling for all other variables in the model. However, if interaction variables had p
values ≤0.15 and were therefore allowed to remain in the model, main effects also were retained.
To test overall significance for variables of interest (percent non-white and/or median house
value) included with interactions in the final model, Chi-square likelihood ratio tests were
CHAPTER 3: RESULTS
North Carolina’s Municipal solid waste (MSW) is increasingly shipped long distances to
high-capacity, regional solid waste disposal facilities (SWDFs), usually landfills; this practice
places the negative impacts of living adjacent to facilities disproportionately on the small number
of communities that host facilities and provide benefits to communities living further away that
do not have to build facilities. While the placement of landfills and other SWDFs inequitably in
high percentage non-white communities and low-income communities has been documented, the
purpose of this study was to test if (1) high-wealth communities shipped their MSW farther than
low-wealth communities and (2) communities with lower percentages of non-white residents
shipped their waste farther than those with higher percentages of non-white residents. Evidence
that these hypotheses are true could indicate an environmental injustice. A mixed-effects
regression model shows significant differences in shipping patterns across North Carolina’s
counties, with high-wealth counties shipping MSW greater distances than low-wealth counties
for disposal. The results also show that race, population density, and the amount of MSW
shipped interact in complex ways to affect distance.
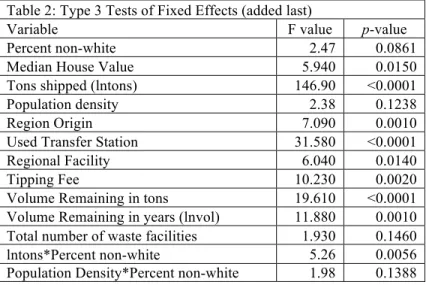
Table 2: Type 3 Tests of Fixed Effects (added last)
Variable F value p-value
Percent non-white 2.47 0.0861
Median House Value 5.940 0.0150
Tons shipped (lntons) 146.90 <0.0001
Population density 2.38 0.1238
Region Origin 7.090 0.0010
Used Transfer Station 31.580 <0.0001
Regional Facility 6.040 0.0140
Tipping Fee 10.230 0.0020
Volume Remaining in tons 19.610 <0.0001
Volume Remaining in years (lnvol) 11.880 0.0010
Total number of waste facilities 1.930 0.1460
lntons*Percent non-white 5.26 0.0056
Effect of County Wealth on MSW Shipping Distance
The final mixed-effects model (which includes all the variables shown in Table 2 and
which is summarized in Table 3) shows that higher median house values are associated with a
higher predicted shipping distance (F(1, 378)=5.9, p=0.015). Counties with median house values
in the top 10th percentile (those with median home price above $196,790) are predicted to ship
MSW nearly 3 miles further than counties in the bottom 10th percentile (those with median house
values below $85,190), on average.
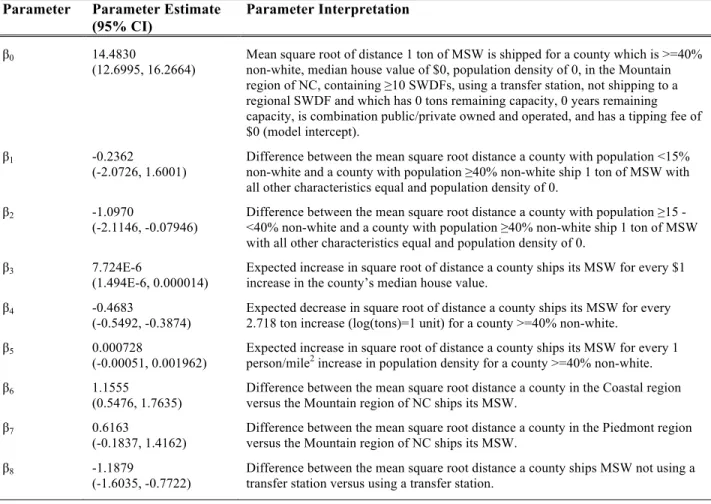
Table 3: Final mixed effects model, parameters, and parameter interpretations Final origin mixed effects model:
𝑑𝚤𝑠𝑡=𝛽!+𝛽!𝐼 𝑝𝑐𝑡𝑛𝑤<15 +𝛽!𝐼 15≤𝑝𝑐𝑡𝑛𝑤<40 +𝛽!𝑚𝑒𝑑ℎ𝑣+𝛽!log 𝑡𝑜𝑛𝑠 +
𝛽!𝑝𝑜𝑝𝑑+𝛽!𝐼 𝑟𝑒𝑔𝑜=𝐶𝑜𝑎𝑠𝑡𝑎𝑙 +𝛽!𝐼 𝑟𝑒𝑔𝑜=𝑃𝑖𝑒𝑑𝑚𝑜𝑛𝑡 +𝛽!𝐼 𝑡𝑟𝑎𝑛=𝑁𝑜 + 𝛽!𝐼 𝑟𝑒𝑔𝑓𝑎𝑐=𝑁𝑜 +𝛽!"𝑡𝑖𝑝𝑓+𝛽!!𝐼 𝑜𝑤𝑛𝑜𝑝=𝑃𝑟𝑖𝑣𝑎𝑡𝑒 +𝛽!"𝐼 𝑜𝑤𝑛𝑜𝑝=𝑃𝑢𝑏𝑙𝑖𝑐 + 𝛽!"𝑣𝑜𝑙𝑡𝑜𝑛+𝛽!"log(𝑣𝑜𝑙𝑦𝑟+1)+𝛽!"𝐼 𝑡𝑜𝑡𝑓𝑎𝑐𝑜<5 +𝛽!"𝐼 5≤𝑡𝑜𝑡𝑓𝑎𝑐𝑜<10 +
𝛽!"𝐼 𝑝𝑐𝑡𝑛𝑤<15 ∗log 𝑡𝑜𝑛𝑠 +𝛽!"𝐼 15≤𝑝𝑐𝑡𝑛𝑤<40 ∗log 𝑡𝑜𝑛𝑠 +𝛽!"𝐼 𝑝𝑐𝑡𝑛𝑤<15 ∗ 𝑝𝑜𝑝𝑑+𝛽!"𝐼 15≤𝑝𝑐𝑡𝑛𝑤<40 ∗𝑝𝑜𝑝𝑑 + 𝜀!" + 𝑏!!
𝜀!"~𝑁(0,𝜎!), 𝑏!!~𝑁(0,𝐷) 𝜀!" 𝑖𝑛𝑑,𝑏!! 𝑖𝑛𝑑,𝑏!!⊥𝜀!"
𝜎!=3.5365, 𝐷=0.4385
Parameter Parameter Estimate (95% CI)
Parameter Interpretation
β0 14.4830
(12.6995, 16.2664)
Mean square root of distance 1 ton of MSW is shipped for a county which is >=40% non-white, median house value of $0, population density of 0, in the Mountain region of NC, containing ≥10 SWDFs, using a transfer station, not shipping to a regional SWDF and which has 0 tons remaining capacity, 0 years remaining capacity, is combination public/private owned and operated, and has a tipping fee of $0 (model intercept).
β1 -0.2362
(-2.0726, 1.6001)
Difference between the mean square root distance a county with population <15% non-white and a county with population ≥40% non-white ship 1 ton of MSW with all other characteristics equal and population density of 0.
β2 -1.0970
(-2.1146, -0.07946) Difference between the mean square root distance a county with population <40% non-white and a county with population ≥40% non-white ship 1 ton of MSW ≥15 - with all other characteristics equal and population density of 0.
β3 7.724E-6
(1.494E-6, 0.000014)
Expected increase in square root of distance a county ships its MSW for every $1 increase in the county’s median house value.
β4 -0.4683
(-0.5492, -0.3874)
Expected decrease in square root of distance a county ships its MSW for every 2.718 ton increase (log(tons)=1 unit) for a county >=40% non-white.
β5 0.000728
(-0.00051, 0.001962)
Expected increase in square root of distance a county ships its MSW for every 1 person/mile2 increase in population density for a county >=40% non-white. β6 1.1555
(0.5476, 1.7635)
Difference between the mean square root distance a county in the Coastal region versus the Mountain region of NC ships its MSW.
β7 0.6163
(-0.1837, 1.4162)
Difference between the mean square root distance a county in the Piedmont region versus the Mountain region of NC ships its MSW.
β8 -1.1879
β9 -1.6413
(-2.9539, -0.3287)
Difference between the mean square root distance a county ships MSW not to a regional facility versus to a regional facility.
β10 -0.04201
(-0.06783, -0.01618)
Expected decrease in square root of distance a county ships its MSW for every $1 increase in the SWDF’s tipping fee.
β11 -0.2442
(-0.7750, 0.2866) Difference between the mean square root distance a county ships its MSW to a privately owned and operated SWDF versus a combination public/private owned and operated SWDF.
β12 -2.3863
(-3.6770, -1.0957)
Difference between the mean square root distance a county ships its MSW to a publicly owned and operated SWDF versus a combination public/private owned and operated SWDF.
β13 4.531E-8
(-, -)1 Expected increase in square root of distance a county ships its MSW for every 1 ton increase in the SWDF’s volume capacity (tons).
β14 -0.4632
(-0.7275, -0.1989) Expected increase in square root of distance a county ships its MSW for every 1 unit increase in the SWDF’s log(volume capacity in years +1).
β15 -0.7166
(-1.4545, 0.02124) Difference between the mean square root distance a county with <5 SWDFs versus ≥10 SWDFs ships its MSW.
β16 -0.3360
(-0.9959, 0.3239) Difference between the mean square root distance a county with versus ≥10 SWDFs ships its MSW. ≥5 - <10 SWDFs
β17 0.2193
(0.06567, 0.3729) Additional effect related to interaction of <15% non-white and log(tons shipped). The difference in the mean square root distance 2.718 tons is shipped (log(tons)=1) for a county <15% non-white versus a county ≥40% non-white, all other variables equal and population density=0, is (β1 + β17).
β18 0.1405
(0.03494, 0.2460) Additional effect related to interaction of shipped). The difference in the mean square root distance 2.718 tons is shipped ≥15 - <40% non-white and log(tons (log(tons)=1) for a county ≥15- <40% non-white versus a county ≥40% non-white, all other variables equal and population density=0, is (β2 + β18).
β19 -0.00997
(-0.02032, 0.000372) Additional effect related to interaction of <15% non-white and population density. The difference in the mean square root distance 1 ton of MSW is shipped for a county<15% non-white with population density=Xperson/mile2 versus a county ≥40% non-white with population density=Xperson/mile2, all other variables equal, is (β1 + X*β19).
β20 -0.00062
(-0.00224, 0.001002) Additional effect related to interaction of density. The difference in the mean square root distance 1 ton of MSW is shipped ≥15 - <40% non-white and population for a county≥15 - <40% non-white with population density = X people/mile2 versus a county ≥40% non-white with population density = X people/mile2, all other
variables equal, is (β2 + X*β20).
[1] Confidence interval not estimable since, given decimal limitations, standard error was estimated to be 0.
Figure 2 provides an illustration of the phenomenon of high-wealth counties shipping MSW
great distances to lower-wealth counties: it shows shipments to Uwharrie Regional landfill, in a
low-wealth county (indicated by yellow shading) from high-wealth counties (darker shading)
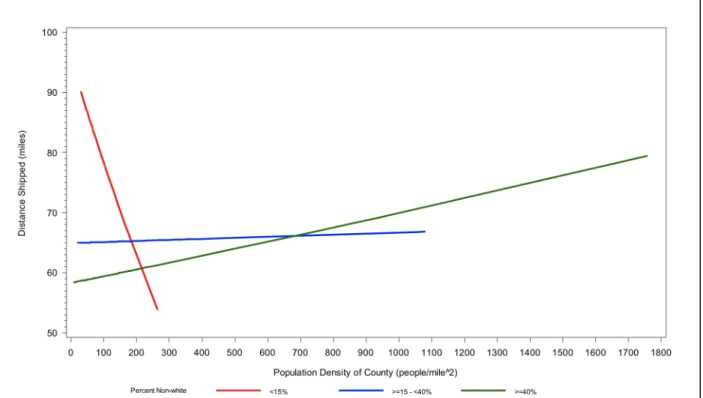
Interacting Effects of Race, Population Density and Tonnage on MSW Shipping Distance
Race (measured as percentage non-white), county population density, and tonnage of
MSW moving along each shipping path interact significantly to affect the transport distance of
MSW from counties to disposal facilities. Assuming the average shipment mass (15,865 tons),
counties with low population densities and higher-percentage non-white populations on average
dispose of their MSW closer to home than those with low minority population percentages
(compare green line and red line on left side of Figure 3). On the other hand, when population
density increases above about 450 persons/mi2, this pattern reverses (Figure 3, right side). At the
mean population density of 195 persons/mi2, counties with low-minority population percentages Figure 2: NC counties, median house value and waste flow to Uwharrie Regional MSWLF. This figure presents an instance in which wealthy counties ship waste across the state to a lower-‐wealth, rural county. Lines indicate waste flow and amount shipped. County shading corresponds to the county median house value.
ship their waste farther than those with larger minority populations (Figure 3). Several of the
highest population density counties in the state, including Durham, Forsyth, Guilford and
Mecklenburg counties, had populations ≥40% non-white and are predicted to ship MSW the
furthest distances according to this model. Counties ≥15% - <40% non-white has a relatively flat
slope.
For shipments >20,000 tons, counties that are ≥40% non-white are predicted to ship
MSW the shortest distances, not taking population density into account (Figure 4). For any
shipments >6,000 tons, counties that are ≥15% - <40% non-white are predicted to ship MSW the
furthest. However, for low tonnage shipments counties ≥40% non-white are predicted to ship
MSW furthest.
Figure 5 presents the interaction between percent non-white and county population
density for shipments of 50,000 tons, which is roughly the top 10th percentile of shipping
tonnages. For such high tonnages, the model predicts more extreme disparities between
low-density counties across racial categories, with low percentage non-white counties shipping MSW
the furthest.
Figure 4: Relationship between percent non-‐white*ln(tons) interaction term and distance. Distance and tons converted to real units.
In contrast, Figure 6 presents the interaction between percent non-white and county
population density but for shipments of only 1 ton, which represents roughly the bottom 10th
percentile of shipments. When such low tonnages are shipped, the model predicts that counties
with populations ≥40% non-white will nearly always ship MSW the furthest.
To test overall whether percent non-white was a significant predictor in the model, the
null hypothesis that β1=β2=β17=β18=β19=β20=0 was compared to an alternative that at least one of
those parameter estimates was not 0. The Chi-square test statistic from the likelihood ratio test
using a maximum likelihood ratio to compare the final model with and without those parameters
yielded Chi-square(6)= 15.7, p=0.015. Consequently, the null hypothesis that percent non-white
is not a significant predictor was rejected and it was concluded that percent non-white is a
significant predictor of distance in the model.
Other Explanatory Variables
In addition to relationships among wealth, race, population density and tonnage shipped,
the model also makes predictions regarding the other explanatory variables that influence
distance. Use of a transfer station, shipping to a regional facility, and shipping to SWDFs with Figure 6: Relationship between percent non-‐white*population density interaction term and distance. Distance and tons converted to real units. Assumes 1 ton shipped (roughly the bottom 10th percentile of
greater tonnage capacity is also associated with a higher predicted distance. In contrast, distance
is predicted to be lower for SWDFs have greater years of capacity. Distance is also predicted to
be lower when the tipping fee of the facility being shipped to is higher. Coastal and Piedmont
region counties are predicted to ship MSW further than mountain region counties with coastal
counties shipping the furthest.
MSW is predicted to be shipped the shortest distance to publicly owned and operated
SWDFs, which are typically local county landfills. MSW is predicted to be shipped the furthest
distance to publicly owned, privately operated SWDFs and to privately owned and operated
SWDFs. Interestingly, counties hosting the fewest number of active or inactive SWDFs of any
type are predicted to ship MSW the shortest distance and counties hosting the greatest number of
active or inactive SWDFs are predicted to ship MSW the furthest. This suggests that counties
that have a history of hosting SWDFs may prefer to ship MSW away rather than build new
facilities. These decisions may be due to political opposition, few optimal sites, and/or the cost of
permitting, construction and operation.
Subsidiary Results
Data collected from NCDENR facility annual reports allow for additional
characterizations of North Carolina MSW disposal practices that expand on the model results
presented above. In fiscal year 2012-2013, the majority of MSW was shipped to disposal
facilities located outside of the county where MSW originated (Figure 7). Nearly all (93%) of
North Carolina-generated MSW was disposed in municipal solid waste landfills (MSWLFs) in
North Carolina and 7% was shipped out-of-state (Figure 8) to facilities in Georgia, South
Figure 7: Fraction of North Carolina MSW shipped out of county of origin versus fraction of MSW disposed in county of origin.
Figure 8: Fraction of North Carolina MSW disposed in North Carolina landfills versus the fraction disposed in out-‐of-‐state facilities.
Shipped out of county Disposed in county of origin
60% 40%
Out of State Facilities
North Carolina LandTills
7%
accepting North Carolina MSW. This incinerator accepted only 0.02% of North Carolina’s
MSW.
Of the MSWLFs used that were located in North Carolina, facilities were distributed
somewhat unevenly by region. Of the 40 in-state MSWLFs used, 21 were located in the
Piedmont region, 10 in the coastal region, and 9 in the mountain region (Appendix A). Of these,
4 MSWLFs in the Piedmont were regional facilities. The coastal and mountain regions hosted 3
and 1 regional MSWLFs respectively. Eleven out-of-state facilities were used, all of which were
considered to be regional. Also, each region had a different number of counties. The Piedmont
region had 35 counties, Coastal region had 41 counties, and the Mountain region had 24
counties.
The most densely populated counties were located in the Piedmont region. These densely
populated counties included Durham, Forsyth, Guilford, Mecklenburg and Wake, which contain
the cities Durham, Winston-Salem, Greensboro, Charlotte and Raleigh respectively; these cities
produced more than 31% of that state’s MSW sent to MSWLF. Of these counties, Durham,
Forsyth, Guilford and Mecklenburg all had populations ≥40% non-white; in total, these counties
produced 24% of the state’s MSW sent to MSWLF.
The state has a distinct racial distribution with all counties with populations ≥40%
non-white located in the coastal and Piedmont regions and all counties <15% non-non-white in the
mountain region. Wealth, as assessed by median house value, followed a less clear distribution
with high concentrations of wealth in the Piedmont near major cities, but also on the western and
CHAPTER 4: DISCUSSION
This research provides further support to evidence of disparities in exposure to risks from
MSW disposal. The research found that in 2012-2013, high-wealth North Carolina counties were
able to ship their MSW significantly farther than low-wealth counties, thus placing a greater
distance between their homes and potential hazards of MSWLFs. In contrast, MSW remained
closer to the place of origin in low-wealth counties. Furthermore, counties with low population
densities but comparatively large minority populations disposed of large MSW tonnages closer
to home than counties with low population densities and smaller minority populations. On the
other hand, densely populated counties with relatively large minority communities shipped large
waste tonnages farther away than densely populated counties with smaller minority populations.
This latter finding presumably reflects that in North Carolina, the densely populated counties
with relatively large minority populations contain major cities (Charlotte, Winston-Salem,
Greensboro, and Durham), which likely are more able to afford MSW shipping costs, or possess
greater political power, than rural areas.
The economic disparities in MSW shipping distances identified in this research are
consistent with previous research on MSW landfill siting. Norton et al. (2007) found that
low-wealth communities in North Carolina were more likely to host solid waste facilities than high
wealth communities (Norton et al., 2007). Faber and Krieg (2002) also found that solid waste
facilities were disproportionately sited in low-income communities in Massachusetts (Faber and
Krieg, 2002). Other studies, such as Bullard (1983), discussed disproportionate siting of solid
waste facilities in low-income and predominantly non-white communities but only tested for
exist not only in landfill siting but also in the distances that communities may be able to place
between themselves and the disposal sites for their waste.
While the interactions among race, population, and MSW tonnage in affecting shipping
distances are complex, the findings in this research lend support to previous research discussing
urban/rural disparities in waste disposal practices. Jones (2011) described power disparities
between urban and rural areas, discussing MSW disposal and land-application of biosolids.
Additionally, Blowers and Leroy discussed regional power structures and locally unwanted land
uses in the United Kingdom, explaining that when an urban core is successful in opposing a
proposed unwanted land use, the unwanted land use (in this case, a landfill) is placed instead in
more remote and politically weaker areas. While focused on case studies in the United Kingdom
and not the United States, their discussion provides insight into the results from this study. They
write, “The idea of a peripheral community or area suggests that it is located on the edges of the
mainstream. There is a geographical and spatial basis to the concept, the idea of communities
that are physically remote or inaccessible (though not necessarily distant) from the central,
dominant region which is the focus of communications and development” (Blowers and Leroy,
1994).
Limitations
One limitation of the study was the use of county as the geographic scale for MSW
origin. North Carolina have no system for reporting how much MSW originates at the municipal
or census-block-group level. Community size is typically defined much smaller than the county
level. Environmental justice research often defines community by US Census blocks, block
people) (Bullard et al., 2007; Mohai and Saha, 2006; Gilbert, 2013; Liu, 2001). North Carolina’s
average county population of 95,355 thus constitutes a much larger unit of analysis than is ideal
in environmental justice research (US Census Bureau, 2010). Such large populations may not
show significant, community-level injustices; this problem has been termed the modifiable areal
unit problem (Noonan et al., 2009). Data on the quantity of MSW generated by each block or
block group and the distance the MSW traveled to its final disposal site would enable a much
more powerful analysis of inequities in MSW transport, but such data are not available.
Additional explanations for the distance that MSW was shipped could not be included in
the model. For example, each disposal facility in North Carolina creates a franchise agreement
between the disposal facilities and the county in which the facility is located. Such agreements
are different for each facility and can specify maximum distances from which the facility can
accept MSW or detail requirements that the facility only accept MSW from specific counties.
Due to lack of information about the details of these agreements at the facility level, this analysis
was unable to account for differences in franchise agreements. Moreover, local politics, which
are often characterized by vehement opposition to siting landfills, were not considered.
Nonetheless, the influence of local politics may be partially accounted for in the differing
intercept terms for each county.
Several other potentially influential factors also were not included in the model due to
lack of data. These factors include the nature of waste hauling contracts (including cost), local
funding for waste management, and local recycling practices.
Despite the limitations, this research showed evidence of statistically significant
than destinations as in previous studies, this research adds to the ongoing discussion about
CHAPTER 5: CONCLUSION
Disparities in waste disposal practices documented by this and other research may
increase in the future without regional policies to address inequities due to the lack of incentives
to decrease waste volumes and (perhaps unintended) incentives to maintain high rates of waste
generation. For example, MSWLFs, as they currently operate, compete with recycling,
composting and other waste reduction efforts. Private facilities rely on a steady flow of MSW in
order to turn a profit and pay off construction and operation costs. At the time of construction or
expansion, MSWLF owners and operators ensure that there is a market for the facility in the
region -- that the surrounding counties will use the facility for MSW disposal (Golder Associates
NC, 2013; Randolph County Public Works, 2013). Though bound by daily disposal limits and
pre-arranged service areas written into permits to operate and franchise agreements, private
facilities market disposal services and try to maximize profits by having a continual flow of
MSW (North Carolina Department of Natural Resources and Environment, 2003). Some facility
operators enter into “put-or-pay” contracts with communities, which require a certain tonnage be
disposed at the facility; failure to generate the required waste tonnage results in fines to the
community (US Environmental Protection Agency, 2010). Bae (2009) found that in North
Carolina, 69% of municipalities that publicly delivered waste disposal services offered recycling
and reuse programs while only 44% of private contractors offered these waste reduction services
(Bae 2009). The availability of potential “customers” for privately owned MSWLFs also may
continue to drive the expansion and construction of such facilities, in place of reducing waste
generation. Wealthier counties may be willing and able to pay to ship MSW further and avoid
building a new facility. Therefore, the wealth of distant counties willing to ship MSW greater
While the shift to regional waste disposal came to prominence relatively recently, these
trends may continue as existing local facilities reach capacity. Orange County, North Carolina
closed its MSWLF (one of several facilities at this particular site) in July 2013 after several
expansions. The community neighboring the MSWLF is a historic African American community
in Chapel Hill with a long history of organizing against environmental injustices (Campbell et
al., 2013; Pearce, 2008). Instead of building a new MSWLF, the county began hauling MSW to
transfer stations in Durham County, which shipped the MSW over 100 miles to Uwharrie
Regional MSWLF in Montgomery County, a rural county with a marginally higher percentage
population non-white but a much lower wealth level than Orange County (American Community
Survey, 2012; Orange County Solid Waste Management Department, 2012).
Once a MSWLF or incinerator is constructed, its role in accepting solid waste from
surrounding counties has been solidified. Many of the regional landfills included in this study
were originally built 10-15 years ago. However, most were subsequently expanded from their
original sizes, which allowed the facilities to accept MSW from more counties at greater
tonnages (North Carolina Department of Environment and Natural Resources, 2014; North
Carolina Department of Environment and Natural Resources, Facility Permit No: 14-03 Foothills
Regional MSWLF Facility, 2007; North Carolina Department of Environment and Natural
Resources, Facility Permit No: 04-03-MSWLF-2010, 2007).
Regional equity is a growing field in which communities, policy makers, and regional
planners are working to address disparities within regions, rather than cities. Such discussions
focus on the disparities in economic opportunities available, quality of life, and disproportionate
environmental burdens on certain communities in the urban, suburban, and rural areas that
SWDFs in a region, are included in such discussions. “Community based regionalism” and
“smart growth” concepts are based on the understanding that the social, economic and political
futures of each community in a region are interconnected and interdependent, particularly the
low-income communities of a region (PolicyLink, 2002; Bullard, 2007). Such regionally focused
planning efforts will be necessary to address all aspects of MSW generation and disposal.
This is the first research to show inequities in the distance at which MSW is shipped prior
to disposal. Future research could build on the findings here by conducting analyses at the
census block group or tract level. Also helpful would be time-series analyses with multiple time
points dating back to the mid 1990s, when the shift from local to regional MSW disposal began.
Overall, such research would be valuable in informing discussions about ways to decrease
disparities in MSW management practices and develop regionally sustainable approaches to
REFERENCES
Bae, S. (2009). Public Versus Private Delivery of Municipal Solid Waste Services: the Case of North Carolina. Contemporary Economic Policy, 28(3), 414–428. doi:10.1111/j.1465-7287.2009.00180.x
Baxter, J., Eyles, J., & Elliott, S. (1999). “Something Happened”: The Relevance of the Risk Society for Describing the Siting Process for a Municipal Landfill. Geografiska Annaler, 81(2), 91–109.
Berger, S. A., Jones, P. A., & White, M. C. (2000). Exploratory analysis of respiratory illness among persons living near a landfill. Journal of Environmental Health, 62(6), 19–23.
Biocycle (2010). The State of Garbage in America.
http://www.biocycle.net/images/art/1010/bc101016_s.pdf.
Boyle, M. A., & Kiel, K. A. (2001). A Survey of House Price Hedonic Studies of the Impact of Environmental Externalities. Journal of Real Estate Literature, 9, 117–145.
Bullard, R. D. (Ed.). (2007). Growing Smarter. Cambridge: The MIT Press.
Bullard, R. D. (2000). Dumping in Dixie: Race, Class, and Environmental Quality (3rd ed.). Boulder: Westview Press.
Bullard, R. D. (1983). Solid Waste Sites and the Black Houston Community. Social Inquiry, 53(2-3), 273–288.
Bullard, R. D. (2005). The Quest for Environmental Justice. San Francisco: Sierra Club Books.
Bullard, R. D., Mohai, P., Saha, R., & Wright, B. (2007). Toxic Wastes and Race at Twenty, 1987-2007.
Campbell, R. L., Caldwell, D., Hopkins, B., Heaney, C. D., Wing, S., Wilson, S. M., … Yeatts, K. (2013). Integrating Research and Community Organizing to Address Water and
Sanitation Concerns in a Community Bordering a Landfill. Journal of Environmental Health, 75(10).
Draper Aden Associates (2011). 2011 Virginia Tipping Fee and Recycling Report.
Elliott, P., Briggs, D., Morris, S., de Hoogh, C., Hurt, C., Jensen, T. K., … Jarup, L. (2001). Risk of adverse birth outcomes in populations living near landfill sites. BMJ (Clinical Research Ed.), 323(7309), 363–8. Retrieved from
http://www.pubmedcentral.nih.gov/articlerender.fcgi?artid=37394&tool=pmcentrez&render type=abstract
English, M. R. (1992). Solid Waste Facilities and Other LULUs: Considerations for Rural Communities. Knoxville, TN. Retrieved from http://infohouse.p2ric.org/ref/18/17301.pdf
Environmental Systems Research Institute (ESRI). (2010). ArcGIS Desktop: Release 10.0. Redlands, CA.
Environmental Systems Research Institute (ESRI). (n.d.). StreetMap Premium for ArcGIS. (Accessed January 1, 2014). Redlands, CA.
Eyles, J., Taylor, S., Johnson, N., & Baxter, J. (1993). Worrying about waste: living close to solid waste disposal facilities in southern Ontario. Soc Sci Med., 37(6), 805–812.
Faber, D. R., & Krieg, E. J. (2002). Unequal exposure to ecological hazards: environmental injustices in the Commonwealth of Massachusetts. Environmental Health Perspectives, 110 Suppl (April), 277–88. Retrieved from
http://www.pubmedcentral.nih.gov/articlerender.fcgi?artid=1241174&tool=pmcentrez&ren dertype=abstract
Georgia Department of Community Affairs (2012). List of 2012 Landfill Remaining Capacity. http://www.gaepd.org/Documents/lpb_solidwaste.html.
Georgia Department of Community Affairs (2010). MSW and C&D Landfill Tipping Fees 2009 Solid Waste Management Update.
http://www.dca.state.ga.us/development/research/programs/downloads/2009TippingFees.pd f.
Gilbert, P. (2013). The State of Exclusion: An Empirical Analysis of the Legacy of Segregated Communities in North Carolina.
Goldberg, M. S., Al-Homsi, N., Goulet, L., & Riberdy, H. (1995). Incidence of cancer among persons living near a municipal solid waste landfill site in Montreal..pdf. Archives of Environmental Health, 50(6), 416–424.
Golder Associates NC. (2013). Facility Plan Report Proposed for Municipal Solid Waste Landfill. Randolph County, NC. Vol III. Prepared for Randolph County Public Works. Greensboro, NC.
Google. (2014). Google Earth version 7.0.3.8542. Retrieved from http://www.google.com/earth/
Health Effects Institute. HEI Panel on the Health Effects of Traffic-Related Air Pollution. (2009). Traffic-Related Air Pollution: A Critical Review of the Literature on Emissions, Exposure, and Health Effects (Preprint). HEI Special Report 17. Health Effects Institute. Boston, Mass. In press.
Heaney, C. D., Wing, S., Campbell, R. L., Caldwell, D., Hopkins, B., Richardson, D., & Yeatts, K. (2011). Relation between malodor, ambient hydrogen sulfide, and health in a community bordering a landfill. Environmental Research, 111(6), 847–52.
doi:10.1016/j.envres.2011.05.021
Izhar, T. N. T., Ramli, N. A., & Yahaya, A. S. (2013). Odour Nuisance near Semi-Aerobic Landfill: A Distance-Based Study in Malaysia. International Journal of Environmental Science and Development, 4(1), 32–36. doi:10.7763/IJESD.2013.V4.298
Johnson, R. J., & Scicchitano, M. J. (2012). Don’t Call Me NIMBY: Public Attitudes Toward Solid Waste Facilities. Environment and Behavior, 44(3), 410–426.
doi:10.1177/0013916511435354
Jones, C. C. (2011). Environmental Justice in Rural Context: Land-Application of Biosolids in Central Virginia. Environmental Justice, 4(1), 220–233. doi:10.1089/env.2009.0034
Liu, F. (2001). Environmental Justice Analysis: Theories, Methods, and Practice. Boca Raton: Lewis Publishers.
Melosi, M. V. (2000). The Sanitary City. Baltimore: The Johns Hopkins University Press.
Martuzzi, M., Mitis, F., & Forastiere, F. (2010). Inequalities, inequities, environmental justice in waste management and health. European Journal of Public Health, 20(1), 21–6.
doi:10.1093/eurpub/ckp216
Mohai, P., Pellow, D., & Roberts, J. T. (2009). Environmental Justice. Annual Review of
Environment and Resources, 34(1), 405–430. doi:10.1146/annurev-environ-082508-094348
Mohai, P., & Saha, R. (2006). Reassessing Racial and Socioeconomic Disparities in Environmental Justice Research. Demography, 43(2), 383–399.
Nelson, A. C., Genereux, J., & Genereux, M. (1992). Price Effects of Landfills on House Values. Land Economics, 68(4), 359–365.
Noonan, D. S., Turaga, R. M. R., & Baden, B. M. (2009). Superfund, hedonics, and the scales of environmental justice. Environmental Management, 44(5), 909–20. doi:10.1007/s00267-009-9372-y
North Carolina Department of Environment and Natural Resources. (2003). An Update of the North Carolina Solid Waste Management Plan, 2003-2013.
North Carolina Department of Environment and Natural Resources (2014). Solid Waste Permitted Facilities List. http://portal.ncdenr.org/web/wm/sw/facilitylist.
North Carolina Department of Environment and Natural Resources (2013). Facility ownership data provided by NCDENR staff.
North Carolina Department of Environment and Natural Resources. (2013). Municipal Solid Waste Landfill and Transfer Station Annual Reports. Retrieved from
https://edm.nc.gov/DENR-Portal/
North Carolina Department of Environment and Natural Resources. (2007). Facility Permit No: 14-03 Foothills Regional MSWLF Facility.
North Carolina Department of Environment and Natural Resources. (2014). Facility Permit No: 04-03-MSWLF-2010. Permit to Operate. Chambers Development MSW Landfill.
North Carolina Department of Environment and Natural Resources (2014). Capacity Report, 2012-2013.
North Carolina Department of Environment and Natural Resources (2014). Tipping Fee Report, 2012-2013.
North Carolina Department of Environment and Natural Resources Division of Waste Management. (2013). North Carolina Solid Waste and Materials Management Annual Report FY2012-13. Retrieved from
http://portal.ncdenr.org/web/wm/sw/swmar?p_p_id=110_INSTANCE_V4fV&p_p_lifecycl
e=0&p_p_state=maximized&p_p_mode=view&p_p_col_id=column-3&p_p_col_count=1&_110_INSTANCE_V4fV_struts_action=%2Fdocument_library_displ ay%2Fview&_110_INSTANCE_V4fV_folderId=15429422
North Carolina Department of Environment and Natural Resources. Solid Waste Section. (2007). Final Fact Sheet and Permit Decision Response to Public Comment Permit Number: 62-04.
North Carolina Department of Environment and Natural Resources. Solid Waste Section. (1997). Solid Waste Management Annual Report. Retrieved from
Norton, J. M., Wing, S., Lipscomb, H. J., Kaufman, J. S., Marshall, S. W., & Cravey, A. J. (2007). Race, wealth, and solid waste facilities in North Carolina. Environmental Health Perspectives, 115(9), 1344–50. doi:10.1289/ehp.10161
Orange County Solid Waste Management Department. (2012). Waste Matters. Retrieved from http://www.co.orange.nc.us/recycling/documents/Wastematters_May2012.pdf
Pastor Jr., M., Sadd, J., & Hipp, J. (2001). Which Came First? Toxic Facilities, Minority Move-In and Environmental Justice. Journal of Urban Affairs, 23(1), 1–21.
Pearce, E. E. (2008). Rogers Road. Self published. Retrieved from
http://www.lulu.com/shop/emily-eidenier/rogers-road/ebook/product-17402774.html
PolicyLink. (2002). Promoting Regional Equity: A Framing Paper. Retrieved from
http://www.policylink.org/atf/cf/%7B97c6d565-bb43-406d-a6d5-eca3bbf35af0%7D/REGIONALEQUITYFRAMINGPAPER_FINAL.PDF
Porta, D., Milani, S., Lazzarino, A. I., Perucci, C. a, & Forastiere, F. (2009). Systematic review of epidemiological studies on health effects associated with management of solid waste.
Environmental Health : A Global Access Science Source, 8, 60.
doi:10.1186/1476-069X-8-60
Randolph County Public Works. (2013). Questions and Answers Regarding the Proposed
Regional Landfill. Retrieved from http://www.co.randolph.nc.us/pw/landfill/QA121004.pdf
Ready, R. (2010). Do Landfills Always Depress Nearby Property Values? Journal of Real Estate Research, 32(3), 321–339. Retrieved from
http://ares.metapress.com/index/6420X06213902T71.pdf
SAS Institute Inc. (2009). SAS software Version 9.2. Cary, NC.
Sasao, T. (2004). An estimation of the social costs of landfill siting using a choice experiment. Waste Management, 24(8), 753–62. doi:10.1016/j.wasman.2004.05.003
Seltman, H. J. (2013). Experimental Design and Analysis (pp. 357–375).
South Carolina Department of Health and Environmental Control (2013). South Carolina Solid Waste Management Report, 2012.
https://www.scdhec.gov/environment/lwm/recycle/annual_report.htm.
Stansfeld, S., & Matheson, M. P. (2003). Noise pollution: non-auditory effects on health. British Medical Bulletin, 68(1), 243–257. doi:10.1093/bmb/ldg033
US Census Bureau. (2012). American Community Survey 5-Year Estimates, 2008-2012. Median value for owner-occupied housing units. Retrieved from
US Census Bureau (2010). Decennial Census 2010, SF 1. Retrieved from http://factfinder2.census.gov/faces/nav/jsf/pages/index.xhtml.
US Census Bureau (2010). Percent urban and rural in 2010 by state and county. http://www.census.gov/geo/reference/ua/urban-rural-2010.html.
US Environmental Protection Agency. (2010). LFG Energy Project Development Handbook (Chapter 5). Retrieved from http://www.epa.gov/lmop/publications-tools/handbook.html
US Environmental Protection Agency. (2012). Municipal Solid Waste (MSW) in the United States: Facts and Figures, 2010. Retrieved from
http://www.epa.gov/waste/nonhaz/municipal/pubs/2012_msw_fs.pdf
US Environmental Protection Agency. Office of Solid Waste. Municipal and Industrial Solid Waste Division. Chapter 1. (1995). Report to Congress: Flow Controls and Municipal Solid Waste. Retrieved from
http://www.epa.gov/waste/nonhaz/municipal/landfill/flowctrl/report/chpt-i.pdf
US Environmental Protection Agency. (2002). Waste Transfer Stations: A Manual for Decision-Making. Retrieved from http://www.epa.gov/osw/nonhaz/municipal/pubs/r02002.pdf
Virginia Department of Environmental Quality (2013). Solid Waste Managed in Virginia During Calendar Year 2012.
http://www.deq.virginia.gov/Portals/0/DEQ/Land/SolidWaste/2013_Annual_Solid_Waste_ Report.pdf.
Wheelabrator Technologies Inc (2010). Wheelabrator Portsmouth News. 1(1). Summer 2010.
APPENDIX A
Descriptive summaries of variables considered for inclusion in destination models
Variable Statistic Result Variable Statistic Result
Shipment path level County level
Distance MSW is shipped (miles) [dist]
n mean (SD) median min, max 509 93.037 (63.066) 85.530 1.32, 307.79 Non-white population (%) [pctnw] n mean (SD) median min, max 100 31.0 (17.7) 29.0 5, 73
Amount of MSW
shipped (tons) [tons] n mean (SD) median min, max 509 15865.072 (38719.167) 1418.070 0.01, 519176.76 Median house
value ($) [medhv] n mean (SD) median min, max 100 137607.0 (45606.0) 129650.0 69400, 307900
Tipping fee at destination SWDF ($) [tipf] n mean (SD) median min, max 509 45.592 (8.690) 44.000 26.33, 80.00 Population density (people/mile2)
[popd] n mean (SD) median min, max 100 195.44 (260.39) 113.05 9.5, 1755.5
Volume remaining at destination SWDF (tons) [volton] n mean (SD) median min, max 489 16336615.1 (12216135.6) 11468526.0 0, 45466954 Urban population
(%) [pcturb] n mean (SD) median min, max 100 38.797 (28.168) 37.725 0.00, 98.93
Volume remaining at destination SWDF (years) [volyr] n mean (SD) median min, max 489 35.711 (67.230) 24.800 0.0, 899.59
Number of SWDF in origin county [totfaco] n mean (SD) median min, max 100 8.2 (11.8) 5.0 0, 79 Ownership and operation of SWDF [ownop] Public Private Public/Private n (%) n (%) n (%) 75 (14.7) 339 (66.6) 95 (18.7) Origin county region [rego] Coastal Mountains Piedmont n (%) n (%) n (%) 41 (41.0) 24 (24.0) 35 (35.0)
Used a transfer station [tran] No Yes n (%) n (%) 256 (50.3) 253 (49.7) Regional facility [regfac] No Yes n (%) n (%) 65 (12.8) 444 (87.2)
Amount of MSW disposed, weighted by distance shipped (tons*miles) [miton] n mean (SD) median min, max 51 7159008.59 (18894146.7) 1180361.80 42031.9, 113475149.1 Destination county region [regd] Coastal Mountains Piedmont Out of state
n (%) n (%) n (%) n (%) 10 (19.6) 9 (17.7) 21 (41.2) 11 (21.6) Tipping fee at
Variable Statistic Result Variable Statistic Result
Volume remaining at destination SWDF (tons) [volton] n mean (SD) median min, max 49 8156738.2 (10772680.3) 3685876.0 0, 45466954 Regional facility [regfac] No Yes n (%) n (%) 32 (62.8) 19 (37.3) Volume remaining at destination SWDF (years) [volyr] n mean (SD) median min, max 49 63.107 (146.159) 30.070 0.00, 899.59
Number of SWDF in destination county [totfacd] n mean (SD) median min, max 40 14.2 (17.4) 7.5 2, 79
Median house value ($) in census block group, 1 mile radius [medhvbg1] n mean (SD) median min, max 50 137617.02 (56918.24) 126591.30 56992.30, 320382.60 Non-white population (%) in census block, 1 mile radius [pctnwb1]
n mean (SD) median min, max 50 29.883 (25.700) 17.915 1.88, 77.62
Median house value ($) in census block group, 2 mile radius [medhvbg2] n mean (SD) median min, max 51 136474.99 (56291.18) 126219.10 18846.70, 339252.80 Non-white population (%) in census block, 2 mile radius [pctnwb2]
n mean (SD) median min, max 51 27.244 (20.690) 19.630 3.93, 69.13 Population density (people/mile2) in
census block group, 1 mile radius [popdbg1] n mean (SD) median min, max 51 297.964 (424.540) 143.990 11.21, 1998.83 Non-white population (%) in census block group, 1 mile radius [pctnwbg1] n mean (SD) median min, max 51 31.411 (22.802) 25.830 2.80, 84.85 Population density (people/mile2) in