Long-term weight loss and improved intermediate cardiovascular outcomes associated with a Mediterranean-style diet in high-risk participants with diabetes:
findings from the Heart Healthy Lenoir Project
by
Genevieve Guenther Ricart Embree, MD
A Master’s Paper submitted to the faculty of the University of North Carolina at Chapel Hill in partial fulfillment of the requirements for the degree of Master of Public Health
in the Public Health Leadership Program
Chapel Hill
2016
___________________________________
Adviser’s signature
___________________________________
Printed name Date
___________________________________
Second reader’s signature
___________________________________
Table of Contents
Abstract………....3
Long-term weight loss and improved intermediate cardiovascular outcomes associated with a Mediterranean-style diet in high-risk participants with diabetes: findings from the Heart Healthy Lenoir Project……..……….5
References……...………...22
Figure………...25
Tables………...26
Literature Review: Does a Mediterranean Diet Reduce Cardiovascular Disease?...31
References………..44
Figure……….46
Abstract
Objective
To determine whether a lifestyle intervention promoting a Mediterranean-style diet and physical
activity results in improved lifestyle behaviors and weight loss among participants residing in the
“stroke belt” of the Southeastern United States, where the rates of cardiovascular disease are
disproportionately high, particularly among people with diabetes and African Americans.
Research Design and Methods
The study was designed as a two-year prospective cohort study to evaluate the lifestyle
intervention with an embedded randomized controlled trial (RCT) of a maintenance weight loss
intervention during the second year. There were three phases of the study. Phase I (6 months
long) was an individually-tailored lifestyle intervention promoting a Mediterranean-style dietary
pattern and increased walking. Phase II (also 6 months long) included an optional 16-week
weight loss intervention for participants whose BMI was at least 25 kg/m2 or a maintenance of
lifestyle intervention for all others. Phase III (12 months long) included optional participation in
a maintenance of weight loss RCT for participants who lost at least 8 lbs or the maintenance of
lifestyle intervention for all others. The Phase II weight loss intervention was offered in two
formats: 16 weekly group sessions or 5 group sessions and 10 phone calls. Changes in lifestyle
behaviors, physiologic cardiovascular intermediate outcomes, and weight were assessed at 6, 12,
and 24 month follow-up visits and analyzed to determine differences by diabetes status and then
Results
Baseline characteristics (n=339): mean age 56, 77% female, 65% black, 37% had diabetes; mean
weight was 103kg for those with diabetes, 95kg for those without diabetes. Outcomes:
Participants with diabetes reported increased walking and activity times at 24 months,
particularly among blacks. Systolic and diastolic blood pressures were reduced by over 8 mmHg
at 24 months among black participants with diabetes. Participants with diabetes demonstrated
greater weight loss than those without diabetes; those with diabetes lost an average of 1.2 kg, 1.5
kg, and 3.7 kg at 6, 12, and 24 months, respectively. The intervention was highly acceptable in
this population.
Conclusions
Overall, participants with diabetes achieved a 3.7 kg sustained weight loss at 24 months. The
study interventions also led to improved blood pressure, physical activity, diet quality, and a
trend toward improvement in hemoglobin A1c among participants with diabetes. Further study
Introduction
The Southeastern United States, particularly the “stroke belt,” has high rates of cardiovascular
disease (CVD),1-4 attributed in part to the fact that residents are more likely to be of low
socioeconomic status, obese, and sedentary.5-7 African Americans also have increased rates of
cardiovascular disease3,4,8 and are more represented in the Southeastern United States. The diet
in the Southeast also tends to be less healthful compared to other areas of the United States,9-11
which further contributes to the observed higher rates of obesity, diabetes, and CVD.12,13
Several studies have been published looking at lifestyle interventions to promote weight loss and
reduce CVD in populations with high rates of diabetes; however many of them did not achieve
the desired outcome of CVD reduction. Franz et al. published a systematic review and
meta-analysis of lifestyle weight-loss intervention outcomes in adults with type 2 diabetes mellitus.14
They reported that only the Look AHEAD trial and another Mediterranean diet-based
intervention achieved at least 5% weight loss as well as improvement in other intermediate
cardiovascular outcomes (blood pressure, lipids, and hemoglobin A1c). Both of these trials also
included a physical activity component and frequent contact with healthcare providers.14
However, Look AHEAD did not actually demonstrate a reduction in CVD events.15 The
PREDIMED trial was the first study to document the ability of a lifestyle intervention to
substantially reduce cardiovascular events among participants with and without diabetes; they
did so using a Mediterranean diet.16 One theory for why prior studies such as Look AHEAD17
and the Diabetes Prevention Program18 failed to reduce CVD events was because they
important factor in reducing CVD.12 Therefore, a Mediterranean-type diet with high quality fats
is a critical component to a lifestyle intervention that successfully reduces CVD.
For these reasons, our group developed a culturally-appropriate lifestyle intervention specifically
for a high-risk, racially diverse population like much of the Southeastern United States with a
focus on improving diet quality using a Mediterranean-like diet, increasing physical activity, and
promoting weight loss. The main results of the Heart Healthy Lenoir Project (HHLP) lifestyle
study have previously been published.19 This paper specifically focuses on how diabetes status
and race influence lifestyle and weight loss outcomes as this type of intervention has not
previously been studied to determine its effectiveness and acceptability in a largely African
American, high-risk population.
Methods
Study Overview
HHLP was a collaborative research effort designed to reduce CVD risk and disparities in risk in
Lenoir County, North Carolina. The project consisted of three coordinated studies focusing on
lifestyle, high blood pressure, and genomics as they affect cardiovascular risk.20 The studies
were conducted in Lenoir County because of its location in the “stroke belt” with rates of CVD
higher than state and national averages as well as its population that is predominantly lower
socioeconomic status and 40% African American.21
HHLP lifestyle study participants were recruited from the Lenoir County community as well as
practices.22 The HHLP lifestyle study was designed and conducted with input from a local
community advisory committee20 and was approved and monitored by the University of North
Carolina’s Institutional Review Board. Data were collected between September 20, 2011 and
November 7, 2014.
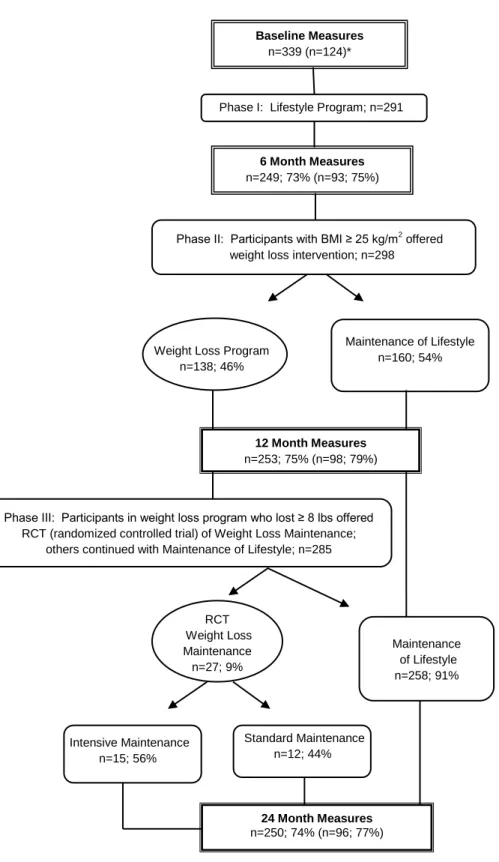
The lifestyle study consisted of three phases, depicted in Figure 1. Phase I focused on improving
diet quality and increasing physical activity; this phase lasted 6 months and was the same for all
study participants. Phase II consisted of 1) a weight loss intervention for participants with a
body mass index (BMI) ≥ 25 kg/m2
who chose to enroll in that arm and 2) a maintenance of
lifestyle intervention for participants with a BMI < 25 kg/m2 and those who declined the weight
loss intervention. Phase II also lasted 6 months and immediately followed Phase I. Phase III
included 1) a year-long, randomized controlled trial comparing a more intensive and less
intensive maintenance of weight loss intervention for participants who took part in the Phase II
weight loss intervention and lost at least 8 lbs and 2) a year-long maintenance of lifestyle
intervention for all other participants. Prior randomized trials from our group23-26 have shown
that similar formats of lifestyle and weight loss interventions are effective among low
socioeconomic status participants, therefore, we opted not to include a control group for Phases I
and II. Furthermore, the community advisory committee strongly encouraged a study design in
which all participants received “active treatment.”
Participants
The goal enrollment was 350 participants based on having an adequate sample for the embedded
participants were recruited from the community and 200 were recruited from the high blood
pressure study. High blood pressure study participants were included because of their increased
risk for CVD and thus potential to benefit from improved lifestyle behaviors. Participants from
the community were recruited through flyers, newspaper articles, television notices, word of
mouth, and the study website. The study’s screening inclusion criteria were relatively limited in
an effort to enroll a representative sample. The criteria were: age ≥ 18 years and interest in
improving lifestyle behaviors to reduce cardiovascular disease risk. Screening inclusion criteria
for the high blood pressure study were age ≥ 18, being an established patient at a participating
practice, and systolic BP ≥ 150 mmHg when assessed during routine care within the prior 12
months. Participants attending the enrollment visit for the high blood pressure study were
invited to also take part in the lifestyle study until 200 agreed to do so.
After obtaining verbal informed consent, research staff conducted phone interviews to screen
potential participants, as previously described.19 If eligibility criteria were met, participants were
invited to attend an enrollment visit at a central research office or at participating clinics.
Written informed consent was obtained prior to collecting baseline measures. Participants were
compensated monetarily at each of the enrollment, 6, 12, and 24 month visits, receiving a total of
$120 if they attended all visits.
Phase I – Lifestyle Intervention
The lifestyle intervention used in this study is a modification of a previously developed and
tested intervention originally developed by Ammerman and colleagues,27,28 which was
healthy diet.23 Consistent with the evolving literature suggesting regular consumption of foods
with high quality fats is also important in reducing the risk of CVD in those with and without
diabetes,16,29-34 this study’s dietary intervention was further modified to include a major focus on
improving dietary fat quality as well. These changes rendered the HHLP lifestyle intervention
dietary pattern very similar to the PREDIMED study’s nut intervention arm diet;16
therefore,
HHLP named the dietary pattern the “Med-South diet” because of its intended use in the
Southeastern United States.
The intervention format and content have been previously published and described in detail.19
Phase I included four monthly sessions delivered by a trained counselor administered as
hour-long individual counseling sessions or two-hour-hour-long group sessions which were held in the
central research office or participating clinics. Participants chose their preferred counseling
format. Intervention content and time was largely dedicated to dietary counseling (75%) and the
rest (25%) physical activity counseling. Dietary counseling focused on using culturally-relevant
content to improve fat quality (such as increasing consumption of nuts, full-fat mayonnaise, and
vegetable oils); increase fruit and vegetable consumption; favor fish and poultry to red and
processed meats; and minimize sugar-sweetened beverages, desserts, and snacks. Physical
activity counseling recommended a goal of at least 7500 steps per day or at least 30 minutes of
physical activity at least five days per week. Spouses and friends were also invited to join the
counseling intervention sessions. When participants could not physically attend counseling
sessions, telephone counseling was offered. Participants also received a pedometer and activity
logs to self-monitor physical activity as well as a listing of local community resources for
pressure study also received a home blood pressure monitor and were instructed to measure their
blood pressure at least three times per week. Other interventions included in the high blood
pressure study were not initiated during Phase I of the lifestyle study for the vast majority of
participants who were dually enrolled.
During counseling sessions, participants received dietary counseling and created an
individually-tailored action plan with his or her counselor to guide eating behaviors. Dietary tips were given
relevant to identified problematic eating behaviors, including recipe suggestions in a
Southern-style cookbook that was given to all participants. Time permitting, physical activity was
addressed at each session. At the beginning of Sessions 2-4, the counselor and participants
reviewed progress made toward previously stated goals.
Phase II – Weight Loss and Maintenance of Lifestyle Intervention
Participants with a BMI ≥ 25 kg/m2
could choose to take part in a weight loss intervention during
the second phase of the HHLP lifestyle study. Those who were not eligible for the weight loss
intervention (BMI < 25 kg/m2) and those who declined the intervention received a maintenance
of lifestyle intervention consisting of three phone calls, as previously described.19 Participants
who elected to be in the weight loss intervention arm could choose between two formats: a
previously-tested weekly group session format over 16 weeks or five group sessions with ten
phone contacts (combination intervention), also over 16 weeks.
Participants who took part in the Phase II weight loss intervention and lost at least 8 lbs could
choose to take part in a maintenance of weight loss randomized controlled trial (RCT). All other
study participants received brief, quarterly maintenance of lifestyle intervention phone calls
(similar to Phase II), as previously described.19 For the maintenance of weight loss RCT,
participants were randomized 1:1 to receive either 36 phone contacts (24 weekly calls over 6
months followed by 12 biweekly calls over 6 months; more intensive intervention) or 18 phone
contacts (12 biweekly calls over 6 months followed by 6 monthly calls over 6 months; less
intensive intervention).
Measures
Outcome measures were assessed at baseline, 6, 12, and 24 months. Previously validated
questionnaires were administered including the Dietary Risk Assessment (DRA) which addresses
overall diet quality,27,35 SF-12 (SF-12 instrument, Quality Metric, Inc., Lincoln, RI) which
addresses quality of life, in addition to other assessments of fruit and vegetable intake,36 dietary
fat quality,37 and physical activity.38,39 Physiologic measures included blood pressure, total
cholesterol, HDL, hemoglobin A1c, blood carotenoids, and weight. Weight was calculated as
the average of two measures to the closest tenth pound according to an electronic scale. Height
was measured with a portable stadiometer at baseline only to calculate body mass index (BMI).
Blood pressure was calculated as the average of three measurements which were recorded at 60
second intervals (Omron HEM-907XL, Omron Healthcare, Lake Forest, IL) after being seating
Statistical analysis
The HHLP lifestyle study size of 350 (based on powering the Phase III RCT) was considered
sufficient for the primary descriptive outcome of changes in diet quality at 6 months and the
secondary descriptive outcome of changes in diet quality and weight at 12 and 24 months
follow-up.
Sample characteristics were summarized using descriptive statistics, with subgroups by diabetes
status and race. Outcomes were assessed using pre-post changes by diabetes status and race
using paired t-tests for continuous outcomes, McNemar’s tests for binary outcomes, and
Chi-squared tests for subgroup analysis when appropriate. Change in weight and percentage of
participants who achieved greater than 5% weight loss were also analyzed by diabetes status and
then by race within diabetes status. In addition, changes in weight-related outcomes were further
analyzed by intervention group; however, the RCT was ultimately underpowered so trends are
shown without significance levels. Because age, race, sex, education, and baseline weight are
potential confounders for weight loss according to the literature, a linear regression model was
performed adjusting for these variables. Finally, questionnaires were administered at the end of
each study phase to assess acceptability of the intervention; results were again summarized using
descriptive statistics. Participants who became pregnant, had bariatric surgery, or were
diagnosed with cancer (excluding non-melanoma skin cancer or localized breast or prostate
cancer diagnosed by screening tests) were excluded from analysis. SAS version 9.3 was used for
Results
Baseline Characteristics
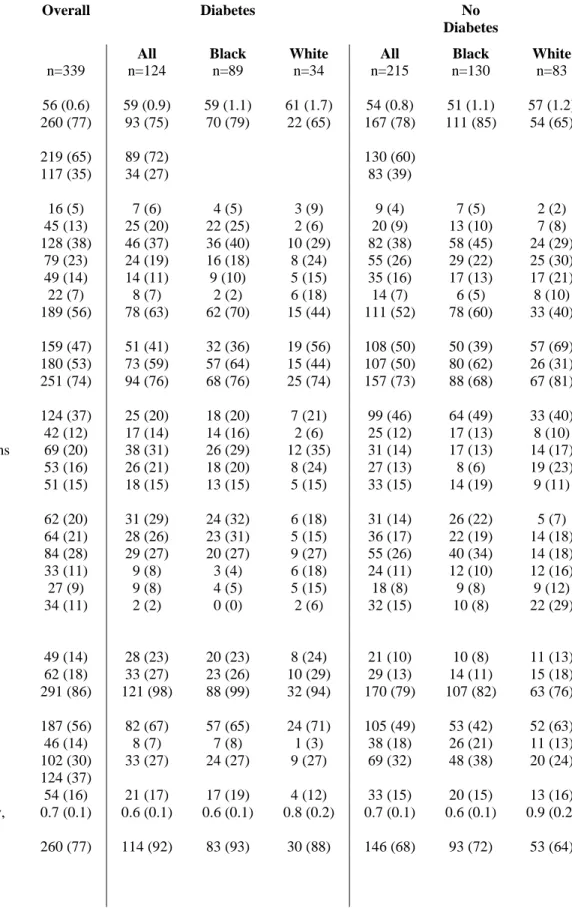
Participants’ baseline characteristics, by diabetes status then further categorized by race, are
outlined in Table 1. More than one third of study participants had diabetes. The overall average
age was 56 years; participants with diabetes were older on average than those without diabetes
(59 versus 54 years) and white participants slightly older than black participants (58 versus 54
years). Men, particularly black men, were underrepresented in the sample. More than half of
participants did not have any college education; participants with diabetes and black participants
were less educated on average than those without diabetes and white participants. Those without
diabetes and whites were also more likely to be married or living with a partner compared to
others. Most participants had health insurance (74%) and this did not appear to vary by diabetes
status or race. People with diabetes were more likely to not work due to health reasons (31%
versus 14%) and less likely to be currently employed (34% versus 58%). Black participants
were slightly more likely to be currently employed than white participants regardless of diabetes
status, though white participants reported higher household incomes on average compared to
black participants. Median household income was less than $40,000 overall; less than $20,000
among participants with diabetes.
In terms of cardiovascular risk factors, reported rates of hypertension were very high in the study
(86% overall), which may be largely attributed to how participants were selected. Participants
with diabetes were more likely to report a history of hypertension (98% compared to 79%); and
blacks reported higher rates of hypertension than whites within each subgroup. Participants with
there were no apparent differences between races. The majority of study participants had high
cholesterol at baseline (56%); participants with diabetes were more likely to have high
cholesterol (67% versus 49%) and whites were more likely to have high cholesterol than blacks,
particularly among those without diabetes (63% versus 42%). There was no apparent variation
in smoking by diabetes status or race.
At baseline, overall diet quality and fat quality were similar across diabetes status and race, with
an average DRA total score of 27.8 and fat quality screener score of 15.5. Participants with
diabetes had slightly higher fruit and vegetable consumption at baseline (average 3.7 servings per
day compared to 3.3). Within that subgroup, blacks reported slightly higher fruit and vegetable
consumption (3.8 versus 3.3) though whites reported higher fruit and vegetable consumption
among participants without diabetes (3.5 versus 3.1). Participants without diabetes reported
much higher total walking and total activity time at baseline (mean 105 and 171 minutes per
week, respectively, compared to 67 and 112 minutes per week among those with diabetes).
Black participants reported longer walking times than whites at baseline within each diabetes
status subgroup though there was less of a difference between races for total activity time.
Participants with diabetes weighed more on average than those without diabetes at baseline (103
kg compared to 95 kg). Among participants without diabetes, blacks weighed more than whites
at baseline (99 kg versus 90 kg); there was no difference in weight between races among
participants with diabetes. BMI is similarly reflective of this trend with an average BMI of 38
among participants with diabetes, regardless of race, and an average of 37 among black
participants without diabetes and 32 for white participants without diabetes. Systolic blood
(138 mmHg compared to 131 mmHg) among participants with diabetes. Among those with
diabetes, black participants had higher hemoglobin A1c percentage at baseline than whites (8.0
compared to 7.6). There was no difference between races among those without diabetes.
Participants with diabetes had lower total cholesterol levels at baseline (188 mg/dL compared to
196 mg/dL), with HDL slightly lower (51 mg/dL versus 56 mg/dL) for those without diabetes.
Black participants had slightly higher HDL levels (55 mg/dL versus 43 mg/dL among those with
diabetes) and lower total cholesterol levels among those without diabetes (193 mg/dL compared
to 200 mg/dL).
Outcomes
Several lifestyle and physiologic outcomes of interest were assessed at baseline and at the end of
each of the three study phases (6 months, 12 months, and 24 months). Follow-up rates are
outlined in Figure 1 with approximately 75% follow-up after each of the three phases.
Follow-up rates were similar between participants with and without diabetes.
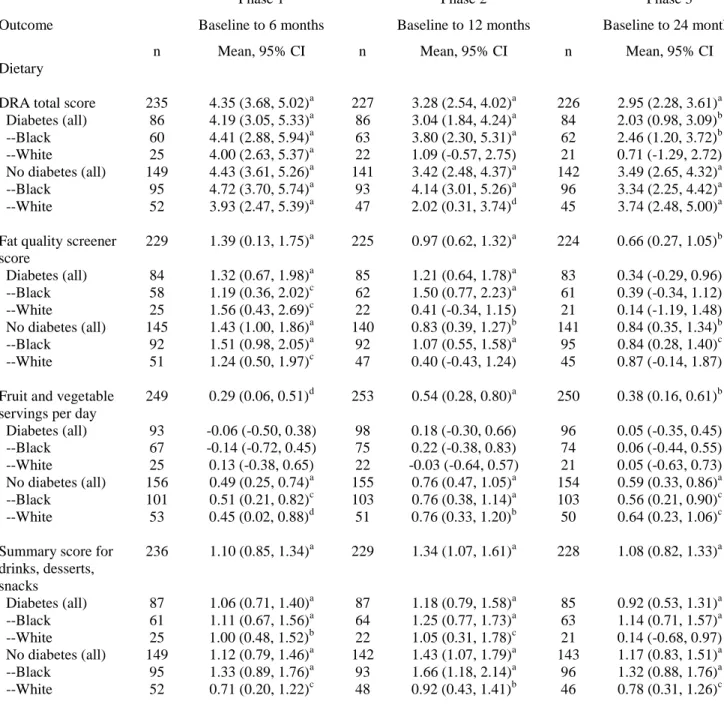
Lifestyle outcomes (Table 2) revealed that DRA total score was 4 points higher, representing
better diet quality, at 6 months among all subgroups, which was statistically significant.
Improvement in DRA total score was maintained at 12 months and 24 months compared to
baseline among all subgroups except white participants with diabetes. Fat quality score improved
by 1.4 on average at 6 months with no significant difference between subgroups by race or
diabetes status. Improvement in fat quality was sustained at 12 and 24 months but only
statistically significant among the subgroups with larger sample sizes. Only participants without
month, 12 month, and 24 month follow-up. Summary score for drinks, desserts, and snacks was
higher among black participants with and without diabetes.
An increase in walking time was sustained at 24 months only among participants with diabetes,
and black participants demonstrated a greater increase in walking than whites within that
subgroup. This was also true for total activity time where black participants with diabetes were
the only subgroup to demonstrate significantly increased activity time compared to baseline at 24
months.
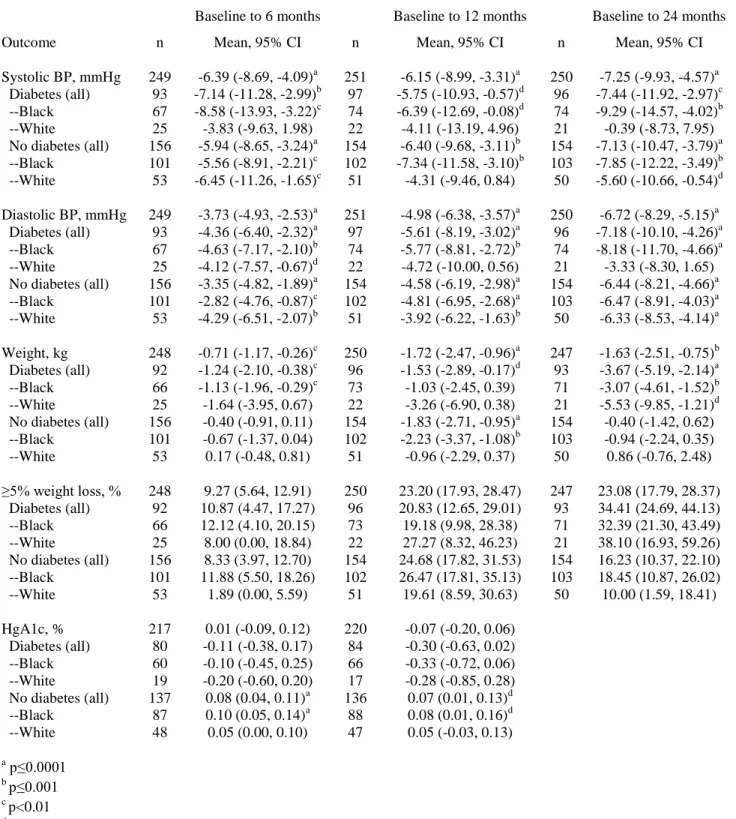
Several measured physiologic outcomes (Table 3) also improved over the course of the study.
Among participants with diabetes, systolic blood pressure was reduced by an average of 6
mmHg at 6 months. This finding was sustained at 24 months with an average drop in systolic
blood pressure of 7 mmHg among participants with diabetes. The improvement in systolic blood
pressure among participants with diabetes can be largely attributed to the black subpopulation of
participants as whites did not demonstrate the same improvement in systolic blood pressure
(-0.39 mmHg at 24 months) compared to blacks (-9.29 mmHg at 24 months). There was a similar
trend with improvement in diastolic blood pressure over the course of the study. On average,
both participants with and without diabetes demonstrated improvements in diastolic blood
pressure (-7.18 mmHg at 24 months for participants with diabetes and -6.44 mmHg at 24 months
for participants without diabetes). Improvements in blood pressure were approximately equal
across races among participants without diabetes however among participants with diabetes,
black participants again had greater change in diastolic blood pressure compared to baseline on
to -3.33 which was not statistically significant, respectively). There is a trend toward significant
improvement in hemoglobin A1c at 12 months among participants with diabetes (-0.30; p=0.07).
Weight loss was a major outcome of interest. Participants with diabetes had significant,
sustained, and progressive weight loss compared to baseline at 6, 12, and 24 months (mean -1.24
kg, -1.53 kg, and -3.67 kg respectively) across all intervention groups. White participants with
diabetes appear to have greater weight loss than black participants with diabetes however their
weight loss only reached statistical significance at 24 months given the small sample size. Black
participants with diabetes appeared to lose the most weight during phase III of the study.
Participants with diabetes showed greater weight loss than those without diabetes as participants
without diabetes did not have sustained weight loss at 24 months on average, despite showing
significant weight loss at 12 months. Sample sizes are too small to provide informative statistics
by intervention group though weight loss was similar across intervention groups at 24 months.19
After adjusting for age, race, sex, education, and baseline weight, our regression model
demonstrated that only participants with diabetes had significant, sustained weight loss at 24
months (p<0.0001) and that participants with diabetes had significantly more weight loss on
average than participants without diabetes (p=0.01).
In addition to measuring average change in absolute weight from baseline, success of the
intervention was also measured by calculating percentage of participants who achieved greater
than five percent weight loss compared to baseline at each time point. Again, a greater
proportion of participants with diabetes demonstrated sustained, >5% weight loss compared to
respectively). Percentages were similar between blacks and whites with diabetes however more
black participants without diabetes achieved >5% weight loss at 24 months than whites without
diabetes (18.5% compared to 10.0%, respectively).
Acceptability of the interventions was assessed using questionnaires at the end of each study
phase. At the end of the lifestyle intervention (Phase I), the majority of participants, regardless
of diabetes status or race, felt that the session on nuts, spreads, dressings, and oils was most
helpful. The vast majority of participants with and without diabetes either “strongly agreed” or
“agreed” that the lifestyle intervention was easy to understand. More participants without
diabetes “strongly agreed” that the lifestyle program was easy to understand (65%; compared to
43% with diabetes). Almost all (97%) of participants with diabetes and (98%) without diabetes
either strongly agreed or agreed that they would recommend the lifestyle program to others.
After Phase II, all participants with diabetes in the group weight loss arm were satisfied or very
satisfied with the intervention and 88% of participants with diabetes in the combination weight
loss arm were satisfied or very satisfied with the intervention. Participants without diabetes were
similarly satisfied with the interventions.
Discussion
The HHLP lifestyle study promotes a Mediterranean-style diet with a focus on fat and
carbohydrate quality in a way that is designed to be appealing to residents of the Southeastern
United States, particularly in the “stroke belt” where the population’s cardiovascular risk is very
high. Though this type of dietary intervention has been validated in Europe, it has not been
lifestyle and weight loss interventions in our study led to improved reported overall diet quality,
fat quality, fruit and vegetable consumption; and improved observed blood pressure and weight
loss, though some subgroups of participants across diabetes status and race appeared to benefit
more than others. The sustained weight loss among participants with diabetes at 24 months (3.67
kg) was the most noteworthy outcome. Participants with diabetes may have been more
motivated to lose weight than those without diabetes.
The PREDIMED study documented efficacy of a similar dietary intervention however African
Americans were not well represented in that study. PREDIMED study participants were 97%
white. Because of the socioeconomic make-up of Lenoir County, residents have unique
challenges compared to a largely European cohort. Despite these challenges, our tailored
intervention led to improved cardiovascular intermediate outcomes such as reduced blood
pressure, increased physical activity, improved diet quality, as well as weight loss.
Our intervention did not achieve the same degree of weight loss documented in the Diabetes
Prevention Program (DPP) study,18 which was over 5 kg at 24 months; however the study
populations were very different. All participants in DPP were enrolled in an intensive weight
loss intervention whereas fewer than half of participants in the HHLP lifestyle study opted to
participate in the weight loss intervention. DPP also had more selective inclusion criteria and
more exclusion criteria than HHLP. Furthermore, DPP enrolled participants without diabetes
who had lower baseline weight; other studies have shown that individuals with higher BMI have
more difficulty losing weight.24,40,41 Incidentally, white participants with diabetes in the HHLP
meta-analysis of weight loss interventions among individuals with diabetes shows that the
average weight loss using lifestyle interventions is much less than 3.7 kg at 24 months.14
Unfortunately race data are not available as part of the meta-analysis however other studies have
documented that whites tend to lose more weight on average than blacks with lifestyle
interventions.42
Older participants and women are more likely to succeed with this type of counseling-based
intervention format43 and the study population is largely older women. Though we cannot
account for all differences in baseline characteristics, a regression model adjusting for age, race,
sex, education, and baseline weight did not show materially different outcomes compared to our
unadjusted results.
The main limitation of the study is the lack of control group. Observed changes may be due to
the intervention, by also may be due to secular trends. However, in the control groups of the
DPP and Look AHEAD RCTs, weight loss at 2 years, on average, was less than one
kilogram15,18 suggesting that the weight loss is likely due to the intervention. In addition, from
2011 to 2014, there was no change in rates of overweight and obesity as assessed by the CDC’s
behavioral risk factor surveillance system.44 Another limitation is that lifestyle outcomes were
self-reported and may have been exaggerated due to social desirability reporting bias.
Strengths of the study include its unselected sample with few exclusion criteria which enhances
its generalizability. Furthermore, the fact that participants could choose their study arm allowed
follow-up at 24 months, which is longer follow-up than most weight loss studies, with a
substantial percentage of patients with diabetes. Physiologic outcomes were obtained using
standardized objective measures. Finally, the weight loss observed in this study was more than
most studies with 24 month follow-up.14
Conclusions
Although the majority of participants did not choose to participate in the weight loss intervention
arm of the study, participants with diabetes across intervention arms achieved a sustained 3.67 kg
weight loss at 24 months, as well as improved blood pressure, physical activity, diet quality, and
a strong trend toward improvement in hemoglobin A1c. This study shows promise for a lifestyle
intervention to improve cardiovascular risk, particularly among participants with diabetes, in a
high-risk region of the United States. Therefore, further study is warranted with a randomized
controlled trial to assess the benefits of this Mediterranean diet-based lifestyle intervention in
References
1. Bonow RO, Grant AO, Jacobs AK. The cardiovascular state of the union: confronting healthcare disparities. Circulation. Mar 15 2005;111(10):1205-1207.
2. Go AS, Mozaffarian D, Roger VL, et al. Executive summary: heart disease and stroke statistics--2014 update: a report from the American Heart Association. Circulation. Jan 21 2014;129(3):399-410.
3. Howard G, Labarthe DR, Hu J, Yoon S, Howard VJ. Regional differences in African Americans' high risk for stroke: the remarkable burden of stroke for Southern African Americans. Ann Epidemiol. Sep 2007;17(9):689-696.
4. McWilliams JM, Meara E, Zaslavsky AM, Ayanian JZ. Differences in control of cardiovascular disease and diabetes by race, ethnicity, and education: U.S. trends from 1999 to 2006 and effects of medicare coverage. Ann Intern Med. Apr 21
2009;150(8):505-515.
5. Centers for Disease Control and Prevention. Prevalence of self-reported physically active adults--United States, 2007. MMWR Morb Mortal Wkly Rep. Dec 5 2008;57(48):1297-1300.
6. Flegal KM, Carroll MD, Ogden CL, Curtin LR. Prevalence and trends in obesity among US adults, 1999-2008. JAMA. 2010;303(3):235-241.
7. Haskell WL, Lee IM, Pate RR, et al. Physical activity and public health: updated recommendation for adults from the American College of Sports Medicine and the American Heart Association. Circulation. Aug 28 2007;116(9):1081-1093.
8. Peterson E, Yancy CW. Eliminating racial and ethnic disparities in cardiac care. N Engl J Med. Mar 19 2009;360(12):1172-1174.
9. US Department of Agriculture. Access to affordable and nutritious food: measuring and understanding food deserts and their consequences. 2009.
http://www.ers.usda.gov/media/242675/ap036_1_.pdf.
10. Larson NI, Story MT, Nelson MC. Neighborhood environments: disparities in access to healthy foods in the U.S. Am J Prev Med. Jan 2009;36(1):74-81.
11. Moore LV, Diez Roux AV, Nettleton JA, Jacobs DR, Jr. Associations of the local food environment with diet quality--a comparison of assessments based on surveys and geographic information systems: the multi-ethnic study of atherosclerosis. Am J Epidemiol. Apr 15 2008;167(8):917-924.
12. Mozaffarian D, Appel LJ, Van Horn L. Components of a cardioprotective diet: new insights. Circulation. Jun 21 2011;123(24):2870-2891.
13. Wang X, Ouyang Y, Liu J, et al. Fruit and vegetable consumption and mortality from all causes, cardiovascular disease, and cancer: systematic review and dose-response meta-analysis of prospective cohort studies. BMJ. 2014;349:g4490.
14. Franz MJ, Boucher JL, Rutten-Ramos S, VanWormer JJ. Lifestyle weight-loss
intervention outcomes in overweight and obese adults with type 2 diabetes: a systematic review and meta-analysis of randomized clinical trials. Journal of the Academy of Nutrition and Dietetics. Apr 29 2015, In Press. Available online at: http://ac.els- cdn.com/S2212267215002592/1-s2.0-S2212267215002592-main.pdf?_tid=7d324756-
15. Look Ahead Research Group, Wing RR, Bolin P, et al. Cardiovascular effects of
intensive lifestyle intervention in type 2 diabetes. N Engl J Med. Jul 11 2013;369(2):145-154.
16. Estruch R, Ros E, Salas-Salvado J, et al. Primary prevention of cardiovascular disease with a Mediterranean diet. N Engl J Med. Apr 4 2013;368(14):1279-1290.
17. Look Ahead Research Group, Wing RR, Bolin P, et al. Cardiovascular effects of
intensive lifestyle intervention in type 2 diabetes. N Engl J Med. Jul 11 2013;369(2):145-154.
18. Knowler WC, Barrett-Connor E, Fowler SE, et al. Reduction in the incidence of type 2 diabetes with lifestyle intervention or metformin. N Engl J Med. Feb 7 2002;346(6):393-403.
19. Keyserling T, Samuel-Hodge C, Jilott Pitts S, et al. A community-based lifestyle and weight loss intervention promoting a Mediterranean-style diet pattern evaluated in the stroke belt of North Carolina: the Heart Healthy Lenoir Program. BMC public health. Submitted February 2016,.
20. Pitts SB, Vu MB, Garcia BA, et al. A community assessment to inform a multilevel intervention to reduce cardiovascular disease risk and risk disparities in a rural community. Fam Community Health. Apr 2013;36(2):135-146.
21. Huff J. Lenoir County 2011 Community Health Assessment. Kinston, NC2011.
22. Halladay JR, Donahue KE, Hinderliter AL, et al. The Heart Healthy Lenoir project--an intervention to reduce disparities in hypertension control: study protocol. BMC Health Serv Res. 2013;13:441.
23. Keyserling TC, Samuel Hodge CD, Jilcott SB, et al. Randomized trial of a clinic-based, community-supported, lifestyle intervention to improve physical activity and diet: The North Carolina enhanced WISEWOMAN project. Prev Med. 2008;46(6):499-510. 24. Samuel-Hodge CD, Johnston LF, Gizlice Z, et al. Randomized trial of a behavioral
weight loss intervention for low-income women: The Weight Wise Program. Obesity (Silver Spring). 2009;17(10):1891-1899.
25. Kraschnewski JL, Keyserling TC, Bangdiwala SI, et al. Optimized probability sampling of study sites to improve generalizability in a multisite intervention trial. Prev Chronic Dis. Jan 2010;7(1):A10.
26. Samuel-Hodge CD, Garcia BA, Johnston LF, et al. Translation of a behavioral weight loss intervention for mid-life, low-income women in local health departments. Obesity (Silver Spring). Sep 2013;21(9):1764-1773.
27. Ammerman AS, Haines PS, DeVellis RF, et al. A brief dietary assessment to guide cholesterol reduction in low-income individuals: design and validation. J Am Diet Assoc. 1991;91(11):1385-1390.
28. Ammerman AS, DeVellis BM, Haines PS, et al. Nutrition education for cardiovascular disease prevention among low income populations: description and pilot evaluation of a physician-based model. Patient Educ Couns. 1992;19(1):5-18.
29. Jakobsen MU, O'Reilly EJ, Heitmann BL, et al. Major types of dietary fat and risk of coronary heart disease: a pooled analysis of 11 cohort studies. Am J Clin Nutr. May 2009;89(5):1425-1432.
31. Mozaffarian D, Micha R, Wallace S. Effects on coronary heart disease of increasing polyunsaturated fat in place of saturated fat: a systematic review and meta-analysis of randomized controlled trials. PLoS Med. Mar 2010;7(3):e1000252.
32. Oh K, Hu FB, Manson JE, Stampfer MJ, Willett WC. Dietary fat intake and risk of coronary heart disease in women: 20 years of follow-up of the nurses' health study. Am J Epidemiol. Apr 1 2005;161(7):672-679.
33. Siri-Tarino PW, Sun Q, Hu FB, Krauss RM. Meta-analysis of prospective cohort studies evaluating the association of saturated fat with cardiovascular disease. Am J Clin Nutr. Mar 2010;91(3):535-546.
34. Sofi F, Cesari F, Abbate R, Gensini GF, Casini A. Adherence to Mediterranean diet and health status: meta-analysis. BMJ. 2008;337:a1344.
35. Jilcott SB, Keyserling TC, Samuel-Hodge CD, Johnston LF, Gross MD, Ammerman AS. Validation of a brief dietary assessment to guide counseling for cardiovascular disease risk reduction in an underserved population. J Am Diet Assoc. 2007;107(2):246-255. 36. Block G, Gillespie C, Rosenbaum EH, Jenson C. A rapid food screener to assess fat and
fruit and vegetable intake. Am J Prev Med. 2000;18(4):284-288.
37. Kraschnewski JL, Gold AD, Gizlice Z, et al. Development and evaluation of a brief questionnaire to assess dietary fat quality in low-income overweight women in the southern United States. J Nutr Educ Behav. Jul-Aug 2013;45(4):355-361.
38. Giles-Corti B, Timperio A, Cutt H, et al. Development of a reliable measure of walking within and outside the local neighborhood: RESIDE's Neighborhood Physical Activity Questionnaire. Prev Med. 2006;42(6):455-459.
39. Jones SA, Evenson KR, Johnston LF, et al. Psychometric properties of the modified RESIDE physical activity questionnaire among low-income overweight women. J Sci Med Sport. Jan 1 2014;18(1):37-42.
40. Goode RW, Ye L, Sereika SM, et al. Socio-demographic, anthropometric, and
psychosocial predictors of attrition across behavioral weight-loss trials. Eating behaviors. Jan 2016;20:27-33.
41. Hollis JF, Gullion CM, Stevens VJ, et al. Weight loss during the intensive intervention phase of the weight-loss maintenance trial. Am J Prev Med. Aug 2008;35(2):118-126. 42. West DS, Elaine Prewitt T, Bursac Z, Felix HC. Weight loss of black, white, and
Hispanic men and women in the Diabetes Prevention Program. Obesity (Silver Spring). Jun 2008;16(6):1413-1420.
43. Artinian NT, Fletcher GF, Mozaffarian D, et al. Interventions to promote physical activity and dietary lifestyle changes for cardiovascular risk factor reduction in adults: a scientific statement from the American Heart Association. Circulation. Jul 27
2010;122(4):406-441.
Phase I: Lifestyle Program; n=291 Baseline Measures
n=339 (n=124)*
6 Month Measures n=249; 73% (n=93; 75%)
N
Phase II: Participants with BMI ≥ 25 kg/m2 offered
weight loss intervention; n=298
12 Month Measures n=253; 75% (n=98; 79%)
Phase III: Participants in weight loss program who lost ≥ 8 lbs offered RCT (randomized controlled trial) of Weight Loss Maintenance;
others continued with Maintenance of Lifestyle; n=285
RCT Weight Loss Maintenance n=27; 9%
Maintenance of Lifestyle n=258; 91%
24 Month Measures n=250; 74% (n=96; 77%) Intensive Maintenance
n=15; 56%
Standard Maintenance n=12; 44%
Fig. 1 Study overview
*Numbers in parentheses represent participants with diabetes and their respective follow-up rates at the end of each study phase.
Weight Loss Program n=138; 46%
Table 1. Baseline Characteristics: Overall, by Diabetes Status then by Race
Overall Diabetes No
Diabetes
Characteristics All Black White All Black White
n=339 n=124 n=89 n=34 n=215 n=130 n=83
Demographics
Age, mean (SE) 56 (0.6) 59 (0.9) 59 (1.1) 61 (1.7) 54 (0.8) 51 (1.1) 57 (1.2)
Female 260 (77) 93 (75) 70 (79) 22 (65) 167 (78) 111 (85) 54 (65)
Race
--Black 219 (65) 89 (72) 130 (60)
--White 117 (35) 34 (27) 83 (39)
Education, years
-- ≤ 8 (middle school or less) 16 (5) 7 (6) 4 (5) 3 (9) 9 (4) 7 (5) 2 (2)
-- 9-11 (some high school) 45 (13) 25 (20) 22 (25) 2 (6) 20 (9) 13 (10) 7 (8) -- 12 (high school graduate) 128 (38) 46 (37) 36 (40) 10 (29) 82 (38) 58 (45) 24 (29) -- 13-15 (some college) 79 (23) 24 (19) 16 (18) 8 (24) 55 (26) 29 (22) 25 (30) -- 16 (college graduate) 49 (14) 14 (11) 9 (10) 5 (15) 35 (16) 17 (13) 17 (21)
-- > 16 (graduate school) 22 (7) 8 (7) 2 (2) 6 (18) 14 (7) 6 (5) 8 (10)
Education: high school or less 189 (56) 78 (63) 62 (70) 15 (44) 111 (52) 78 (60) 33 (40) Marital status
-- Married or living with a partner 159 (47) 51 (41) 32 (36) 19 (56) 108 (50) 50 (39) 57 (69)
-- Other 180 (53) 73 (59) 57 (64) 15 (44) 107 (50) 80 (62) 26 (31)
Currently have health insurance 251 (74) 94 (76) 68 (76) 25 (74) 157 (73) 88 (68) 67 (81) Current employment
-- Working full-time 124 (37) 25 (20) 18 (20) 7 (21) 99 (46) 64 (49) 33 (40)
-- Working part-time 42 (12) 17 (14) 14 (16) 2 (6) 25 (12) 17 (13) 8 (10)
-- Do not work due to health reasons 69 (20) 38 (31) 26 (29) 12 (35) 31 (14) 17 (13) 14 (17)
-- Retired 53 (16) 26 (21) 18 (20) 8 (24) 27 (13) 8 (6) 19 (23)
-- Other 51 (15) 18 (15) 13 (15) 5 (15) 33 (15) 14 (19) 9 (11)
Annual household income
-- < $10,000 62 (20) 31 (29) 24 (32) 6 (18) 31 (14) 26 (22) 5 (7)
-- $10,000 to < $20,000 64 (21) 28 (26) 23 (31) 5 (15) 36 (17) 22 (19) 14 (18) -- $20,000 to < $40,000 84 (28) 29 (27) 20 (27) 9 (27) 55 (26) 40 (34) 14 (18) -- $40,000 to < $60,000 33 (11) 9 (8) 3 (4) 6 (18) 24 (11) 12 (10) 12 (16)
-- $60,000 to < $80,000 27 (9) 9 (8) 4 (5) 5 (15) 18 (8) 9 (8) 9 (12)
-- ≥ $80,000 34 (11) 2 (2) 0 (0) 2 (6) 32 (15) 10 (8) 22 (29)
CVD and risk factors for CVD
Known coronary heart disease 49 (14) 28 (23) 20 (23) 8 (24) 21 (10) 10 (8) 11 (13) Known cardiovascular disease 62 (18) 33 (27) 23 (26) 10 (29) 29 (13) 14 (11) 15 (18)
Hypertension 291 (86) 121 (98) 88 (99) 32 (94) 170 (79) 107 (82) 63 (76)
Cholesterol
-- High (≥240 mg/dL) 187 (56) 82 (67) 57 (65) 24 (71) 105 (49) 53 (42) 52 (63) -- Borderline (200-239 mg/dL) 46 (14) 8 (7) 7 (8) 1 (3) 38 (18) 26 (21) 11 (13) -- Desirable (<200 mg/dL) 102 (30) 33 (27) 24 (27) 9 (27) 69 (32) 48 (38) 20 (24)
Diabetes 124 (37)
Current cigarette smoker 54 (16) 21 (17) 17 (19) 4 (12) 33 (15) 20 (15) 13 (16) Packs of cigarettes smoked per day,
mean (SE) for current smokers
0.7 (0.1) 0.6 (0.1) 0.6 (0.1) 0.8 (0.2) 0.7 (0.1) 0.6 (0.1) 0.9 (0.2)
Lifestyle*
DRA total score 27.8 (0.3) 28.5 (0.5) 28.3 (0.6) 28.9 (0.7) 27.4 (0.4) 27.2 (0.5) 27.7 (0.7) Fat quality screener score 15.5 (0.2) 15.5 (0.2) 15.4 (0.3) 15.7 (0.3) 15.4 (0.2) 15.3 (0.2) 15.7 (0.4) Fruit and vegetable servings per day 3.4 (0.1) 3.7 (0.2) 3.8 (0.2) 3.3 (0.3) 3.3 (0.1) 3.1 (0.2) 3.5 (0.2) Walking time (min/wk) 91 (11.3) 67 (12.8) 68 (15.6) 54 (20.5) 105 (16.1) 122 (24.9) 80 (14.3) Activity time (min/wk) 149 (14.0) 112 (18.1) 112 (20.5) 99 (36.0) 171 (19.3) 176 (27.1) 161 (26.3)
Physiologic*
Weight, kg 98 (1.4) 103 (2.2) 103 (2.4) 104 (4.7) 95 (1.7) 99 (2.3) 90 (2.5)
BMI 36 (0.5) 38 (0.8) 38 (0.9) 38 (1.6) 35 (0.7) 37 (0.9) 32 (0.9)
Systolic blood pressure, mmHg 135 (1.2) 136 (2.0) 138 (2.4) 131 (3.6) 134 (1.5) 136 (2.1) 133 (2.2) Diastolic blood pressure, mmHg 82 (0.7) 81 (1.1) 82 (1.4) 78 (1.9) 83 (0.8) 84 (1.1) 81 (1.2) Hemoglobin A1c, % 6.6 (0.1) 7.9 (0.2) 8.0 (0.2) 7.6 (0.3) 5.8 (0.0) 5.8 (0.0) 5.7 (0.0) Total cholesterol, mg/dL 193 (2.3) 188 (4.1) 188 (5.0) 187 (7.2) 196 (2.7) 193 (3.2) 200 (4.8) HDL cholesterol, mg/dL 54 (0.8) 51 (1.4) 55 (1.6) 43 (2.1) 56 (1.0) 58 (1.3) 53 (1.6)
Table 2. Change in Lifestyle Outcomes from Baseline to 6, 12, and 24 months
Phase 1 Phase 2 Phase 3
Outcome Baseline to 6 months Baseline to 12 months Baseline to 24 months
n Mean, 95% CI n Mean, 95% CI n Mean, 95% CI
Dietary
DRA total score 235 4.35 (3.68, 5.02)a 227 3.28 (2.54, 4.02)a 226 2.95 (2.28, 3.61)a Diabetes (all) 86 4.19 (3.05, 5.33)a 86 3.04 (1.84, 4.24)a 84 2.03 (0.98, 3.09)b --Black 60 4.41 (2.88, 5.94)a 63 3.80 (2.30, 5.31)a 62 2.46 (1.20, 3.72)b --White 25 4.00 (2.63, 5.37)a 22 1.09 (-0.57, 2.75) 21 0.71 (-1.29, 2.72) No diabetes (all) 149 4.43 (3.61, 5.26)a 141 3.42 (2.48, 4.37)a 142 3.49 (2.65, 4.32)a --Black 95 4.72 (3.70, 5.74)a 93 4.14 (3.01, 5.26)a 96 3.34 (2.25, 4.42)a --White 52 3.93 (2.47, 5.39)a 47 2.02 (0.31, 3.74)d 45 3.74 (2.48, 5.00)a Fat quality screener
score
229 1.39 (0.13, 1.75)a 225 0.97 (0.62, 1.32)a 224 0.66 (0.27, 1.05)b Diabetes (all) 84 1.32 (0.67, 1.98)a 85 1.21 (0.64, 1.78)a 83 0.34 (-0.29, 0.96) --Black 58 1.19 (0.36, 2.02)c 62 1.50 (0.77, 2.23)a 61 0.39 (-0.34, 1.12) --White 25 1.56 (0.43, 2.69)c 22 0.41 (-0.34, 1.15) 21 0.14 (-1.19, 1.48) No diabetes (all) 145 1.43 (1.00, 1.86)a 140 0.83 (0.39, 1.27)b 141 0.84 (0.35, 1.34)b --Black 92 1.51 (0.98, 2.05)a 92 1.07 (0.55, 1.58)a 95 0.84 (0.28, 1.40)c --White 51 1.24 (0.50, 1.97)c 47 0.40 (-0.43, 1.24) 45 0.87 (-0.14, 1.87) Fruit and vegetable
servings per day
249 0.29 (0.06, 0.51)d 253 0.54 (0.28, 0.80)a 250 0.38 (0.16, 0.61)b Diabetes (all) 93 -0.06 (-0.50, 0.38) 98 0.18 (-0.30, 0.66) 96 0.05 (-0.35, 0.45) --Black 67 -0.14 (-0.72, 0.45) 75 0.22 (-0.38, 0.83) 74 0.06 (-0.44, 0.55) --White 25 0.13 (-0.38, 0.65) 22 -0.03 (-0.64, 0.57) 21 0.05 (-0.63, 0.73) No diabetes (all) 156 0.49 (0.25, 0.74)a 155 0.76 (0.47, 1.05)a 154 0.59 (0.33, 0.86)a --Black 101 0.51 (0.21, 0.82)c 103 0.76 (0.38, 1.14)a 103 0.56 (0.21, 0.90)c --White 53 0.45 (0.02, 0.88)d 51 0.76 (0.33, 1.20)b 50 0.64 (0.23, 1.06)c Summary score for
drinks, desserts, snacks
236 1.10 (0.85, 1.34)a 229 1.34 (1.07, 1.61)a 228 1.08 (0.82, 1.33)a
Physical Activity
Walking time, min/wk
249 64.17 (19.23, 109.12)c 253 70.75 (28.36, 113.15)c 250 21.76 (-12.72, 56.23) Diabetes (all) 93 100.69 (16.90, 184.47)d 98 126.00 (57.57, 194.43)b 96 61.90 (10.71, 113.08)d --Black 67 119.31 (17.52, 221.11)d 75 135.77 (51.72, 219.83)c 74 74.91 (12.52, 137.29)d --White 25 70.80 (-81.24, 222.84) 22 116.59 (14.15, 219.04)d 21 38.05 (-36.18, 112.27) No diabetes (all) 156 42.40 (-8.78, 93.59) 155 35.82 (-17.44, 89.08) 154 -3.27 (-48.79, 42.26) --Black 101 28.81 (-44.88, 102.50) 103 18.70 (-53.49, 90.88) 103 -17.26 (-81.99, 47.47) --White 53 63.11 (7.89, 118.33)d 51 67.57 (-3.24, 138.38) 50 21.90 (-21.87, 65.67) Activity time,
min/wk
249 96.76 (35.65, 157.87)c 253 83.03 (30.21, 135.85)c 250 48.09 (-7.12, 103.29) Diabetes (all) 93 120.25 (19.24, 221.26)d 98 108.51 (28.95, 188.07)c 96 61.67 (-8.09, 131.42) --Black 67 135.72 (16.81, 254.62)d 75 127.32 (32.04, 222.60)c 74 88.80 (2.76, 174.83)d --White 25 105.60 (-94.27, 305.47) 22 74.32 (-63.00, 211.64) 21 -4.81 (-90.53, 80.91) No diabetes (all) 156 82.76 (6.10, 159.41)d 155 66.92 (-2.97, 136.81) 154 39.62 (-38.70, 117.95) --Black 101 85.89 (-17.24, 189.03) 103 36.97 (-41.94, 115.88) 103 28.27 (-75.52, 132.06) --White 53 79.34 (-32.89, 191.57) 51 125.18 (-15.11, 265.46) 50 57.80 (-55.44, 171.04)
Table 3. Change in Physiologic Outcomes from Baseline to 6, 12, and 24 months
Phase 1 Phase 2 Phase 3
Baseline to 6 months Baseline to 12 months Baseline to 24 months
Outcome n Mean, 95% CI n Mean, 95% CI n Mean, 95% CI
Systolic BP, mmHg 249 -6.39 (-8.69, -4.09)a 251 -6.15 (-8.99, -3.31)a 250 -7.25 (-9.93, -4.57)a Diabetes (all) 93 -7.14 (-11.28, -2.99)b 97 -5.75 (-10.93, -0.57)d 96 -7.44 (-11.92, -2.97)c --Black 67 -8.58 (-13.93, -3.22)c 74 -6.39 (-12.69, -0.08)d 74 -9.29 (-14.57, -4.02)b --White 25 -3.83 (-9.63, 1.98) 22 -4.11 (-13.19, 4.96) 21 -0.39 (-8.73, 7.95) No diabetes (all) 156 -5.94 (-8.65, -3.24)a 154 -6.40 (-9.68, -3.11)b 154 -7.13 (-10.47, -3.79)a --Black 101 -5.56 (-8.91, -2.21)c 102 -7.34 (-11.58, -3.10)b 103 -7.85 (-12.22, -3.49)b --White 53 -6.45 (-11.26, -1.65)c 51 -4.31 (-9.46, 0.84) 50 -5.60 (-10.66, -0.54)d Diastolic BP, mmHg 249 -3.73 (-4.93, -2.53)a 251 -4.98 (-6.38, -3.57)a 250 -6.72 (-8.29, -5.15)a Diabetes (all) 93 -4.36 (-6.40, -2.32)a 97 -5.61 (-8.19, -3.02)a 96 -7.18 (-10.10, -4.26)a --Black 67 -4.63 (-7.17, -2.10)b 74 -5.77 (-8.81, -2.72)b 74 -8.18 (-11.70, -4.66)a --White 25 -4.12 (-7.57, -0.67)d 22 -4.72 (-10.00, 0.56) 21 -3.33 (-8.30, 1.65) No diabetes (all) 156 -3.35 (-4.82, -1.89)a 154 -4.58 (-6.19, -2.98)a 154 -6.44 (-8.21, -4.66)a --Black 101 -2.82 (-4.76, -0.87)c 102 -4.81 (-6.95, -2.68)a 103 -6.47 (-8.91, -4.03)a --White 53 -4.29 (-6.51, -2.07)b 51 -3.92 (-6.22, -1.63)b 50 -6.33 (-8.53, -4.14)a Weight, kg 248 -0.71 (-1.17, -0.26)c 250 -1.72 (-2.47, -0.96)a 247 -1.63 (-2.51, -0.75)b Diabetes (all) 92 -1.24 (-2.10, -0.38)c 96 -1.53 (-2.89, -0.17)d 93 -3.67 (-5.19, -2.14)a --Black 66 -1.13 (-1.96, -0.29)c 73 -1.03 (-2.45, 0.39) 71 -3.07 (-4.61, -1.52)b --White 25 -1.64 (-3.95, 0.67) 22 -3.26 (-6.90, 0.38) 21 -5.53 (-9.85, -1.21)d No diabetes (all) 156 -0.40 (-0.91, 0.11) 154 -1.83 (-2.71, -0.95)a 154 -0.40 (-1.42, 0.62) --Black 101 -0.67 (-1.37, 0.04) 102 -2.23 (-3.37, -1.08)b 103 -0.94 (-2.24, 0.35) --White 53 0.17 (-0.48, 0.81) 51 -0.96 (-2.29, 0.37) 50 0.86 (-0.76, 2.48)
≥5% weight loss, % 248 9.27 (5.64, 12.91) 250 23.20 (17.93, 28.47) 247 23.08 (17.79, 28.37) Diabetes (all) 92 10.87 (4.47, 17.27) 96 20.83 (12.65, 29.01) 93 34.41 (24.69, 44.13) --Black 66 12.12 (4.10, 20.15) 73 19.18 (9.98, 28.38) 71 32.39 (21.30, 43.49) --White 25 8.00 (0.00, 18.84) 22 27.27 (8.32, 46.23) 21 38.10 (16.93, 59.26) No diabetes (all) 156 8.33 (3.97, 12.70) 154 24.68 (17.82, 31.53) 154 16.23 (10.37, 22.10) --Black 101 11.88 (5.50, 18.26) 102 26.47 (17.81, 35.13) 103 18.45 (10.87, 26.02) --White 53 1.89 (0.00, 5.59) 51 19.61 (8.59, 30.63) 50 10.00 (1.59, 18.41)
HgA1c, % 217 0.01 (-0.09, 0.12) 220 -0.07 (-0.20, 0.06) Diabetes (all) 80 -0.11 (-0.38, 0.17) 84 -0.30 (-0.63, 0.02) --Black 60 -0.10 (-0.45, 0.25) 66 -0.33 (-0.72, 0.06) --White 19 -0.20 (-0.60, 0.20) 17 -0.28 (-0.85, 0.28) No diabetes (all) 137 0.08 (0.04, 0.11)a 136 0.07 (0.01, 0.13)d --Black 87 0.10 (0.05, 0.14)a 88 0.08 (0.01, 0.16)d --White 48 0.05 (0.00, 0.10) 47 0.05 (-0.03, 0.13)
Literature Review: Does a Mediterranean Diet Reduce Cardiovascular Disease?
Introduction
Cardiovascular disease (CVD) is the leading cause of mortality in the United States1 and
worldwide,2 and is therefore a major public health concern. Although there are numerous factors
that contribute to the incidence of CVD, diet has been long recognized as a modifiable risk
factor. From a public health perspective, prevention of CVD is the ideal approach to reduce
deaths and nonfatal events such as myocardial infarctions (MI) and cerebrovascular accidents
(CVA), or strokes. Prevention is also crucial to curbing the unsustainable associated health care
costs for interventions including hospitalizations, procedures, medications, and long-term care
for debility after non-fatal CVD events.
CVD is particularly prevalent in the Southeastern United States,3 much of which is aptly named
the “stroke belt.” Overall diet quality is poor in the stroke belt;4,5
access to healthy foods is a real
problem in rural communities; and residents are more likely to be of low socioeconomic status,
obese, sedentary, and African American. All of these are risk factors for CVD. Diet quality is a
modifiable risk factor that contributes to obesity and diabetes which are stronger risk factors for
CVD. Prior studies have shown that lifestyle interventions can be effective in achieving weight
loss and improving intermediate outcomes but few have demonstrated a reduction in
cardiovascular events.6,7
Historically, dietary recommendations including those from national organizations such as the
diet.8 However, randomized controlled trials studying the effects of a low-fat diet on
cardiovascular health have failed to show reduced CVD events.6,7,9 In fact, there is concern that
promoting a low-fat diet may contribute to increased consumption of carbohydrates that may
ultimately worsen rates of obesity and diabetes, and may increase the risk of CVD.10
Some studies have promoted a Mediterranean diet. Mediterranean diets have common features –
an emphasis on vegetables, fruits, beans, nuts, seeds, breads, unrefined grains, and olive oil;
inclusion of fish and wine; and minimal intake of meats and full-fat dairy products.11 The olive
oil, nuts, and fatty fish would not be recommended as part of a strictly low-fat dietary pattern.
Despite this, studies evaluating a Mediterranean-based diet seem to be the most promising in
terms of reducing CVD,12 hence the question, “Does a Mediterranean diet reduce cardiovascular
disease?”
Methods
Search Strategy
An electronic search of PubMed and Google Scholar were used to identify relevant studies.
PubMed was searched using the MeSH terms “Mediterranean diet” and “cardiovascular
diseases.” The search was supplemented by reviewing references from identified articles and
reviews.
Article Selection
Selected articles were limited to those published in English, involving human subjects, and with
(including randomized controlled trials and comparative studies). Titles and abstracts were
reviewed to confirm relevance to the question. Specifically, studies needed to use a traditional
Mediterranean diet and evaluate CVD outcomes (including cardiovascular death, MI, or CVA).
Studies that assessed intermediate outcomes only (e.g. laboratory markers, blood pressure, lipid
profiles, etc) were excluded. Studies that used a modified Mediterranean diet were excluded.
Titles that were clearly not relevant were excluded (e.g. looking at cancer outcomes in pts with
high cardiovascular risk instead of cardiovascular outcomes). If the relevance was unclear,
abstracts were reviewed more thoroughly. To narrow the search further, only articles that were
published after 2006 underwent full text review for this limited literature review. Articles that
included a traditional Mediterranean diet and identified at least one cardiovascular outcome
(including cardiac mortality, MI, CVA, congestive heart failure (CHF)) published after 2006
underwent full text review. If multiple studies were published by the same author group using
the same data set from the same study or trial, only the main cardiovascular results paper was
used instead of looking at smaller articles with more segmented samples and outcomes.
Data Abstraction and Evaluation
Articles were read for analytical consideration of the quality of findings, including strengths and
limitations by a single author (GGRE) to assess internal and external validity. Considerations
included study design (e.g. randomized controlled trials were considered more favorable than
observational studies), confounders, bias, effect magnitude and precision, as well as clarity about
the definition of a “traditional Mediterranean diet.” The traditional Mediterranean diet consists
fish, poultry, and low-fat dairy; and low intake of red meat, processed meats, and sweets. Wine
is consumed in moderation with meals.
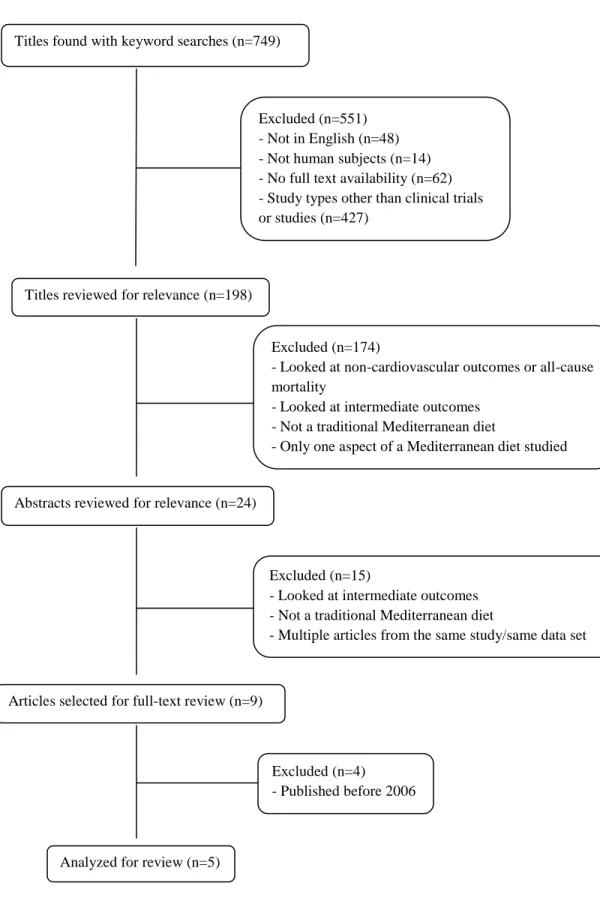
Results
The search strategy yielded 749 results using both “Mediterranean diet” and “cardiovascular
diseases.” The results were filtered for language, human subjects, full text availability, and
clinical studies or trials yielding 198 articles. Title review for relevance narrowed the search to
24 articles and abstract review narrowed it further to 9 articles. Only 5 of those were published
after 2006 and therefore underwent full text review. These five articles were deemed to have
acceptable study design and unique data. The process by which the literature search was
performed is summarized in Figure 1.
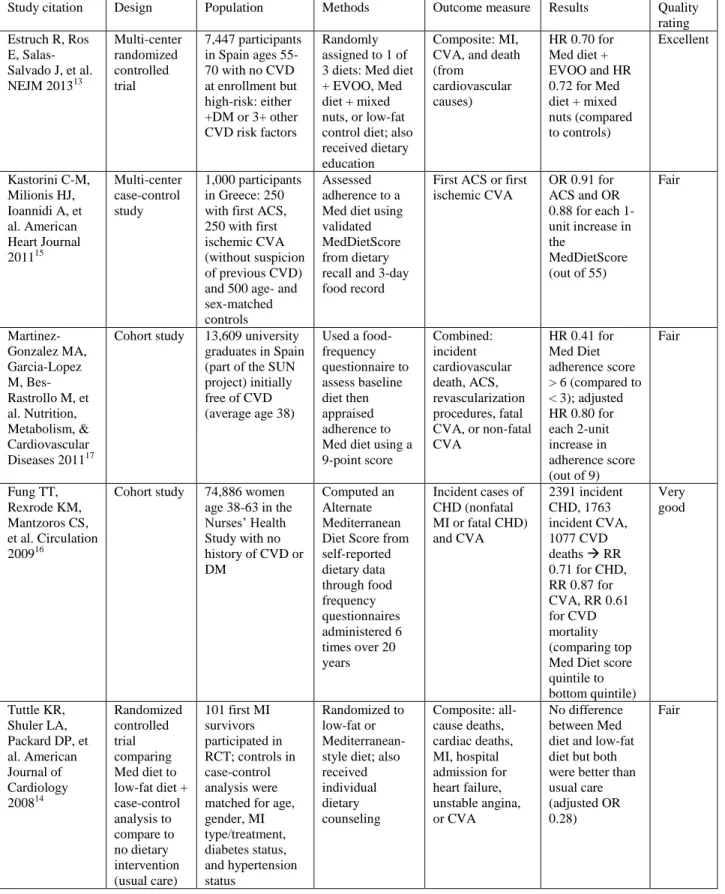
Of the five articles chosen for review, two were randomized controlled trials (RCT) that
compared a Mediterranean diet to a low-fat diet.13,14 The PREDIMED trial was a very
well-designed large RCT.13 The other RCT also included a no dietary intervention control group
however that comparison used an embedded case-control format.14 One other article was also a
case-control study.15 The final two studies were retrospective analyses of large cohort studies:
the Nurses’ Health Study16
and the Seguimiento Universidad de Navarra (SUN) project.17
Overall quality of the studies was fair due to mostly retrospective study designs, measurement
bias, and poor external validity. Many of the studies did have large sample sizes. There were
well-defined outcomes and the direction of the findings was consistent across studies with
similar magnitude though specific outcomes measures were different across studies. Authorship,
Analysis
The first article by Estruch et al.13 was a randomized controlled trial, PREDIMED, with over
7,000 study participants that compared a Mediterranean diet supplemented with either 4
tablespoons of extra virgin olive oil per day or 30 grams of nuts per day to a control lower-fat
diet to see if the intervention diets improved cardiovascular outcomes compared to the control
diet with a composite endpoint of MI, CVA, and cardiovascular mortality. As a randomized
controlled trial, it has a much stronger study design than any of the other articles and still has a
large, respectable sample size. It is different from some of the other studies in that it does not
have a “no intervention” or no recommendation dietary control group. All study participants
were recommended to adhere to some dietary pattern. This study was also notable for the
magnitude of the effect. In fact, the study was stopped early because of the magnitude of the
findings.
PREDIMED enrolled participants who were deemed to be at high CVD risk by the presence of
either diabetes or at least three other cardiovascular risk factors (including smoking,
hypertension, elevated LDL levels, low HDL levels, overweight or obesity, and a family history
of premature coronary heart disease). Participants were older on average than the other studies
with an age range of 55-70. It was also a primary prevention study so participants did not have
CVD at baseline (which differs from the other RCT).
The study found that intervention arms had a 30% reduced risk of CVD compared to controls.
fact, the Mediterranean dietary intervention used in this study was calorie unrestricted and
actually encouraged the use of high-fat supplemental extra virgin olive oil (EVOO) and nuts in
the two intervention arms, respectively. Yet, even with these higher fat intervention diets, the
magnitude of the findings was significant. Other strengths are that the RCT study design
suggests a causal role for a Mediterranean diet in cardiovascular disease prevention and
eliminates confounding.
A limitation of the study is that the findings may not be generalizable to individuals who do not
have a high baseline cardiovascular risk profile, although the diet may reduce CVD risk across
different baseline risks. Also, the study demonstrated efficacy of both intervention arms with
supplemental EVOO and nuts; however, it’s unclear how effective the diet is in a real-world
situation where individuals are not given free EVOO and nuts to consume. Observed rates of
cardiovascular events were lower than expected so the study was not powered to assess the
individual components of the primary composite outcome. Finally, because the study was
performed in Spain where many may eat a Mediterranean diet at baseline, the between-group
differences were modest aside from the supplemental EVOO and nuts which suggests that those
may be responsible for the observed benefits rather than providing evidence that the
Mediterranean diet as a whole was responsible for the observed outcomes.
The second article by Kastorini et al.15 was a multi-center case-control study that enrolled 250
participants each with first acute coronary syndrome or ischemic stroke with 500 age- and
sex-matched controls. Their study looked at the association between adherence to a Mediterranean
included in this review included strokes in their measured outcomes, this study was notable for
focusing on the association between adherence to a Mediterranean diet and stroke specifically;
therefore, odds ratios were calculated separately for stroke incidence.
It was a multi-center study that enrolled consecutive individuals with first time MI or ischemic
stroke without suspicion of previous CVD and 1:1 matched controls. They had relatively few
exclusion criteria which were comorbid chronic neoplasm, chronic inflammatory disease, and
recent dietary changes. ACS cases were younger and more likely to be male than CVA cases.
Controls had higher baseline MedDietScores, were more physically active, and less likely to
smoke. They also had lower prevalence of diabetes, hypertension, and family history of CVD.
After controlling for potential confounders, the study authors found a 0.91 and 0.88 odds of
developing ACS and ischemic CVA, respectively, for each 1-unit increase in MedDietScore (out
of 55) which assesses adherence to a Mediterranean diet.
Limitations of this study include its retrospective design and inability to control for all potential
confounders. Dietary reporting is subject to recall bias. Additionally, the diet log was recorded
during the first 3 days of hospitalization which may not represent a typical diet for those
participants. Furthermore, people with disease will tend to over-report unhealthy dietary habits.
The study is subject to survivor bias. Finally, bias may have been introduced for stroke patients
who could not communicate well and required a surrogate to answer study questions for them.
The third article by Martinez-Gonzalez et al.17 was a cohort study that used data from the
association between Mediterranean diet adherence and incident cardiovascular disease (including
cardiovascular death, acute coronary syndrome (ACS), revascularization procedures, and fatal or
non-fatal CVA). Notable considerations about this study were that the study population was
much younger than other studies because it was drawn from a cohort of university graduates;
therefore despite the large cohort size, there were relatively few incident cases.
Mean age of study participants was 38. Participants with baseline prevalent CVD were
excluded. Median follow-up was 4.9 years and there were 100 cases of incident CVD. Higher
adherence scores were associated with increased physical activity profiles but also with risk
factors for CVD: being an ex-smoker or having diabetes, hypertension, dyslipidemia, or a family
history of coronary disease at baseline. Multiple multi-variable-adjusted models all showed an
inverse association between Mediterranean diet adherence and incident CVD. A 2-point
increment in Mediterranean diet score (out of 9) was associated with a 20% reduction in risk of
CVD and 26% reduction in incidence of coronary heart disease.
Limitations include the small number of incident events. It’s also unclear how participants all
being university graduates would affect its generalizability. This study was inconsistent with
some of the other literature in several ways. They found cereal associated with increased CVD
risk however their diet score does not differentiate between whole grain and refined cereals.
Additionally, their principal component analysis yielded two vectors, one of which they called
the “post hoc Mediterranean pattern” as it correlated with the consumption of vegetables, fruits,
fish, poultry, low-fat dairy, whole grains, nuts, olive oil, and legumes; interestingly, this dietary
The fourth article by Fung et al.16 was also a cohort study. This study used data from Nurses’
Health Study with almost 75,000 women that evaluated the association between a Mediterranean
diet adherence score and incident coronary heart disease and stroke. This study was notable for
the fact that they were able to assess dietary adherence at multiple time points over a 6-year
period which may make it more reliable. They were also able to follow participants over a much
longer period of time (up to 20 years) and they had high follow-up rates despite the long duration
of the study.
Participants in the Nurses’ Health Study were women age 30 to 55 years at the time of
enrollment in the United States. During up to 20 years of follow-up, they ascertained 2391 cases
of coronary heart disease (CHD) and 1763 cases of stroke. At baseline, women with higher
Mediterranean diet adherence scores (aMed score) exercised more and were less likely to be
smokers; they consumed more calories and fiber but less saturated fat. After adjusting for
potential confounders, they found that women in the top quintile of aMed score had a relative
risk (RR) of 0.71 compared to those in the bottom quintile. A similar inverse association was
observed for strokes with RR 0.87 for top quintile compared to bottom quintile. Associations
were stronger for fatal events.
Limitations include residual confounding as it is an observational study and lack of
generalizability to men since the study only enrolled women. High follow-up rates reduced the
probability of selection bias; repeated dietary assessments over time reduce the risk of