ABSTRACT
LINDA D. MICHAELS. A Study of Particle Bounce in
Inertial Impaction Samplers. (Under the direction
of Dr. Madhav B. Ranade.)Environmental and industrial hygiene samples of fine airborne
particles are commonly collected in inertial impaction-based devices.
In an ideal form these devices aerodynamically separate particles
according to their size. It has been known for some time that solid
particles with high Stokes numbers are capable of rebounding from
impactor substrates and, consequently, distorting the particle size
information obtainable from inertial impactors. However, the phenomenon
of particle bounce is poorly understood, and little is known about how
particle materials and substrates can affect the amount of particle
bounce.In this experiment, a method was developed for the measurement of
particle bounce from substrates of three different materials. The
particle materials were also varied. The relative bounce of particles
over a range of Stokes numbers was compared to literature reported
results of similar experiments and to values predicted by a tentative
theory of particle capture by surfaces. Experimental results showed
good agreement with values expected on the basis of theory. Glass beads
showed unexpectedly high collection efficiencies at small Stokes numbers
il
AKNOWLEDGMENTS
I would like to take this opportunity to thank all those who have
helped in so many ways during this project:
My advisor. Dr. M. B. Ranade, for his ideas, enthusiasm, and wise
guidance in this project.
Fred Schwartz and Daryl Smith for construction of the apparatus
used in the study.
Andy Viner for his amazing patience and good humor in dealing with
the student-computer interface.
My co-workers at the Research Triangle Institute for their ideas,
support, encouragement, and many informative discussions—Chloe Smith,
Doug VanOsdell, Dr. David Ensor, and Ed Kashdan.
The Research Triangle Institute for their generous support during
parts of this work and for the use of their equipment and facilities.
IIX
TABLE OF CONTENTS
Page
Abstract... 1
Acknowledgments... 11
List of Tables... Iv List of Figures... v
Nomenclature... vil 1.0 Introduction ... 1
2.0 Literature Survey... 4
2.1 Review of Theory... 4
2.1.1 Inertlal Impactors ... 5
2.1.2 Particle Capture by Surfaces... 10
2.2 Review of Experimental Literature ... 15
3.0 Experimental Methods ... 35
3.1 Pilot Study... 35
3.2 Methods... 36
3.2.1 Impactor Design... 39
3.2.2 Particle Generation... 41
3.2.3 Particle Detection ... 43
4.0 Results and Discussion... 47
4.1 Estimation of Error... 47
4.2 Collection Efficiencies ... 47
5.0 Conclusions and Recommendations... 64
References... 66
Appendix A... 68
iv
LIST OF TABLES
Table Page
2-1 Summary Review of Pertinent Literature Reported
Experiments... 17
2—2 Mohs Scale of Hardness for Selected Materials ... 31
2-3 Comparison of Literature Reported Values for
Coefficient of Restitution and Critical Rebound
Velocity... 34 3-1 Particle Generation Methods ... 44
4-1 Experimental Results, Collection Efficiency,
Adhesion Probability... 54
4-2 Comparison of Microscopy and OPC Results
LIST OF FIGURES
Figure Page
2-1 Impaction velocities for round impactor at
Re = 3000 and S/W = 1/2... 7
2-2 Particle trajectories In round impactor... 8
2-3 Velocity profiles at the jet exit plane of the
round Impactor... 9
2-4 Efficiency curves for a round Impactor at
S/W = 1/2 and five Reynolds numbers... 11
2-5 Effect of Reynolds number on /STK for a round
impactor at S/W = 1/2... 12
2-6 The theoretical dependence of critical rebound
velocity on particle diameter for silica spheres
colliding with a rigid quartz surface... 14
3-1 Experimental configuration using vibrating
orifice aerosol generator... 37
3-2 Experimental configuration using Timbrell glass
bead generator... 38
3-3 Theoretical characteristic curve of experimental
Impactor... 40
3-4 Impactor design... 42
3-5 Glass bead generator based on the design of
Timbrell et al... 45
4-1 Comparison of calibration curves for the experimental
impactor generated with oleic acid-uranine particles on a Fyrex collector and glass beads on an oleic acid-soaked glass frit, with the theoretical
collection efficiency curve... 48
4-2 Ammonium fluorescein and oleic acid collection
efficiencies on three collector materials... 50
4-3 Glass bead collection efficiencies on four
collector materials... 52
4-4 Collection efficiencies of glass beads, ammonium
fluorescein and oleic acid on a stainless steel
vx
LIST OF FIGURES (continued)
Figure Page
4-5 Collection efficiencies of glass beads,
ammonium fluorescein and oleic acid on a
Pyrex collector... 59
4-6 Collection efficiencies of glass beads, ammonium fluorescein, and oleic acid on a Teflon
collector... 60
4-7 Adhesion energy vs. energy at impactor for ammonium
fluorescein particles on stainless steel, Pyrex,
and Teflon collectors ... 61
4-8 Comparison of adhesion probability from this study
with those of other Investigators... 63
A-1 5000 Series and water sedimented glass beads ... 70
A-2 Particle bounce testing using Impactor ... 71
A-3
B-1 Solid particle generator output in wlndtunnel
vii
NOMENCLATURE
A Bradley-Hamaker constant
B^ Bouncing fraction
C Cunningham slip correction
C Collision efficiency
d Particle diameter
dcf^ Particle diameter collected with 50-percent efficiency
D. Jet diameter
3
e Co-efficient of restitution
E, Energy of a particle due to van der Waals attraction
E Energy of a particle on rebounding from a surface
h Adhesion probabilityKE Kinetic energy of a particle incident to a collector
KE Kinetic energy of a particle on rebounding from a surface
K Bulk mechanical propertym Mass of a particle
N Number of particles colliding with an substrate as a ratio to
the number of particles in the challenge air stream
n Number of replicate samples
OPC Optical Particle Counter
PSL Polystyrene latex
R Estimate of ri based on n number of replicates
Rej Jet Reynolds number
S Vertical distance from the exit plane of the jet to
the collector surface
Stk Stokes number
vStk^ The square root of Stokes number corresponding to a collec¬
VlXl
NOMENCLATURE (continued)
U Average jet velocity at its exit
V. Incident velocity normal to a collector V* Critical rebound velocity
V Velocity of a particle on rebound from a surface
W Diameter of the jet for a round Impactor and width of a
rectangular jet
^ Critical approach parameter
z Equilibrium distance of a sphere from a plate or cylinder,
usually estimated at 4.0 x 10 ^ ym
p , Density of air
A STUDY OF PARTICLE BOUNCE
IN INERTIAL IMPACTION-BASED SAMPLERS
by
Linda D. Michaels
1.0 INTRODUCTION
Inertial aerosol impactors are instruments currently in common
useage in the fields of industrial hygiene and air pollution monitor¬
ing. Airborne particles are drawn through a narrow nozzle, while an
obstacle, generally a plate, partially obstructs the air flow at some
distance following its exit from the jet. Particles having less
inertia are able to follow the air stream as it passes around the
obstruction, while those particles with greater inertia, unable to
follow the air stream, impact onto the obstacle. Particles small
enough to pass the impaction plate can be quantified downstream, by
collection on a filter, for subsequent gravimetric analysis, as is most
common, or by some other means. Aerodynamic size segregation of
particles can be controlled by following well established impactor
design criteria (Marple and Willeke, 1976).
Early experimenters with impaction devices noted that large solid
particles were capable of bouncing off the impaction surface, (Owens,
1922; May, 1945). These large particles become re-entrained in the
alrstream and are carried over onto the filter or other type of
collector. As a result of particle bounce and carry over, impactors do
not show equivalent collection efficiencies for liquid and solid
particles of the same aerodynamic diameter. Several studies report
that impactor substrate loading affects the fraction of particles that
rebound from the collector. Incoming particles impact onto accumulated
particles and rebound back into the air stream, suggesting that parti¬
cle bounce is closely related to the hardness and surface structure of
the particle material and to that of the surface it impacts on.
A variety of methods have been devised to limit or to prevent
particle bounce. Owens (1922) designed a humidifying chamber in his
impactor to moisten the dust particles prior to their collision with
the impaction plate. More commonly, the impaction surface has been
covered with a thin layer of viscous material (May, 1945; Davles et
al., 1951; Rao and Whitby, 1978). The addition of a viscous layer has
not been entirely satisfactory. The thickness of the layer, the type
of fluid used, and the particle loading on the viscous layer play an
uncertain role in the reduction of particle bounce from the treated
impactor surface at some specific operating conditions (Hamilton et
al., 1951; Davies et al., 1951; Fuchs, 1978). When it was recognized
that bouncing can occur at sufficiently large velocities even from
greased surfaces, Hu (1971) used an ultraflne fibrous filter as an
impaction substrate to reduce bouncing. However, the filter substrate
adversely alters the shape of the efficiency curve (Willeke and
McFeters, 1975). Moving-plate impactors have also been designed pri¬
marily to prevent particle bounce from previously deposited material,
(May, 1956; Goetz, 1969; Lundgren, 1967).
It has been the common wisdom that particle bounce in impactors
occurs primarily at high particle velocities or when the aerosol being
sampled contains very large particles. However, Dahneke (1975) reports
that particle bounce can occur at impact velocities as low as a few
centimeters per second for particles of 5 to 10 \m in diameter, while
latex spheres and 70-percent bounce-off for 0.22-jjm polystyrene latex
spheres.
It is clear from this discussion that the ideal Inertlal impaction
device is not currently available. Efforts to substantially eliminate
bounce in convenient field use devices have only been partially
successful. In addition, the mechanism of particle bounce is poorly
understood, and experimental particle bounce data reported in the
literature is based on the use of a variety of different test aerosols
and collector surfaces with unknown relative bounce characteristics.It is the objective of this report to: (1) study the effect of
(a) varying particle materials and (b) varying collector materials on
the distribution of particle adhesion probabilities in an Impactor;
(2) compare the results of these experiments to the theory of particle
capture proposed by Dahneke (1971); (3) compare the data collected from
this study with that reported in the literature for similar experi¬
ments; and (4) develop a rudimentary scale of relative bounce for (a)
particle materials and (b) collector materials, based on these results
and those reported in the literature.
A single stage round jet impactor designed to have a cutpoint of
5 pm was built for the study. Removable collection substrates of
pyrex, polished Teflon® and polished stainless steel were used in the
2.0 LITERATURE SURVEY
2.1 Review of Theory
The mechanism of aerosol size segregation in an impactor can be
seen as a two stage process. First, the particle must be transported
to the impaction plate. This aerodjmamic separation step Is considered
to be well understood. Marple (1970) has developed a model of fluid
flow in an Impactor which has been successful in predicting the perfor¬
mance of real Impactors. At the second stage, the particle must adhere
to the collection surface. This requires the collision to be suffi¬
ciently inelastic to dissipate any kinetic energy the particle might
have in excess of that energy necessary to attract the particle to the
surface. In practice, solid particles impinging on dry hard surfaces
do rebound. This phenomenon is relatively poorly understood. Dahneke
(1971) has advanced a simple one-dimensional theory to describe the
capture of particles by surfaces based on an energy balance analysis.
However, no satisfactory confirmation of the theory is currently
available. A number of investigators have provided partial experi¬
mental support for the theory and are reviewed in Section 2.2 of this
report.
Collision efficiency, C , as used in this discussion refers to the
ratio of particles colliding with the collection surface to the number
of particles in the challenge air stream.
number of particles colliding with collector
number of particles in the challenge air
Adhesion or sticking probability, h, refers to the ratio of parti¬
cles adhering to the collection surface on collision, to the number of
particles in the challenge air stream.
Ti, collection efficiency, is equal to C x h, and
_____number of particles adhering to the plate
number of particles in the challenge air stream
When all the particles colliding with the plate are collected,
h = 1, and the collection efficiency and collision efficiency curves
are the same. Calibration of an impactor is designed to determine
collision efficiency, relying on the operating assumption that all
particles colliding with the collector are captured. Consequently, an
impactor calibration curve is often referred to as a collection effi¬
ciency curve. This is the case with the theoretical collection effi¬
ciency curve in Figure 1-1.
2.1.1 Inertial Impactors
The efficiency of an impactor is defined by its deposition curve
(assuming no bouncing), showing the dependence of the fraction of
particles collected on their aerodynamic diameter.
Efficiency depends on mean flow velocity in the impactor nozzle,
U, and the nozzle width as well as particle aerodynamic diameter. If
particle motion is in the Stokes region, then efficiency is a univalent
function of the Stokes number.p d^ U C
where p is the particle density, d is the particle diameter, C is the
Cunningham slip factor, u is the viscosity of the medium, and D. is the
jet diameter. The /Stk is proportional to the particle diameter and is
generally plotted against collection efficiency. In Impactor designs
where gas flow is rapidly accelerated through a contracting nozzle,
particle velocity may be considerably less than that of the gas and its
motion may be occurlng outside of the Stokes region. Under these
conditions, the efficiency curve for the impactor is no longer a
univalent function of Stk. A summary number often used to identify an
impactor characteristic is the location corresponding to n = 0.5, also
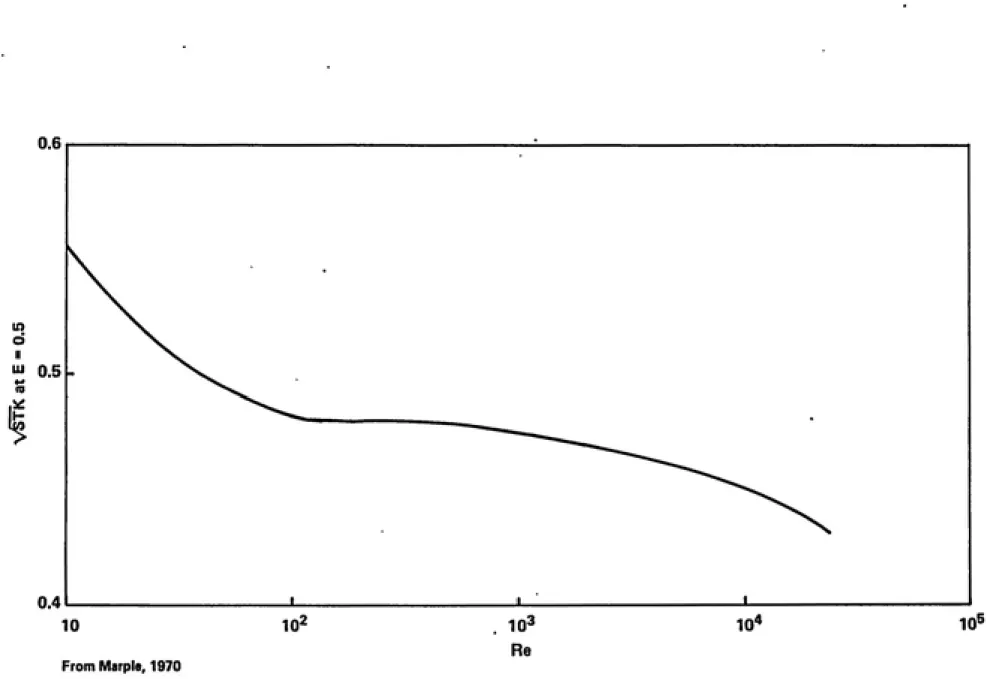
The shape of the characteristic, or efficiency curve. Is specific
to an impactor system and depends, to a degree, on the geometry of the
Impactor and on the jet Reynolds number. Rej.
p . D. U^
Rej =-ail-J_i. (2)
where p Is the density of air. The degree of dependence on these
factors was Investigated by Marple (1970, 1974).
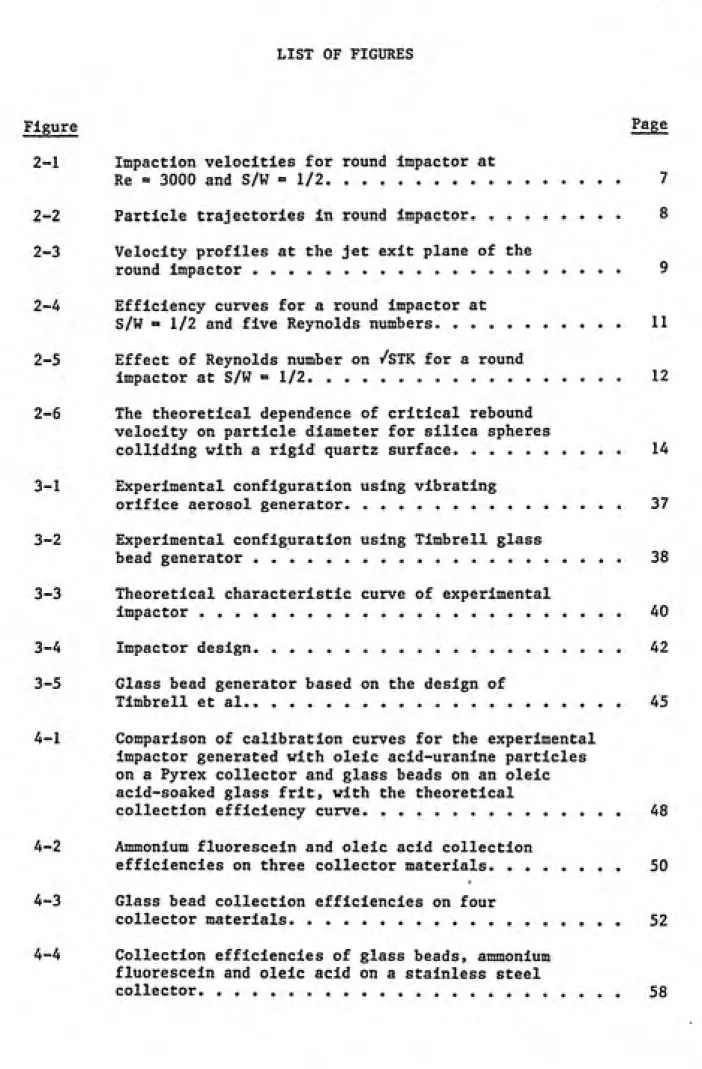
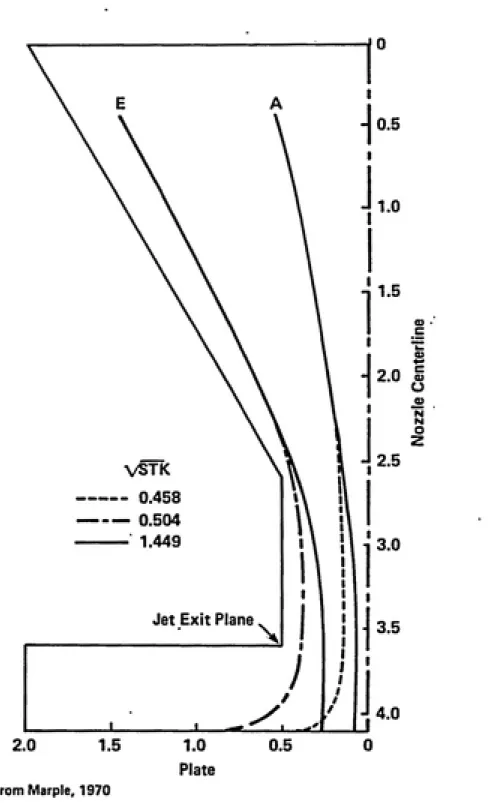
Marple modeled the flow fields In an Impactor with the aid of a
computer by solving the Navler-Stoke differential equations of
motion for several model Impactors. This technique allowed the calcu¬
lation of the vertical and horizontal components of velocity at the
point of Impact with the collection surface. With velocity expressed
as the ratio of particle velocity to average Jet velocity, V /U,
Figure 2-1 shows the horizontal and radial components of velocity for
particles entering the Impactor at point A, near the jet axis
(0.553 X D.) and E, some distance from the jet axis (1.464 ^ D.).
Figure 2-2 shows the particle trajectories for particles entering the
impactor at the same two points. It can be seen from these two figures
that at small Stk values, the vertical velocity component is very small
and that the particles traveling with these low velocities are collid¬
ing with the plate at very small angles.
This model is of particular relevance to the question of particle
bounce in impactors. Several studies have reported the onset of
bouncing points from uncoated surfaces at very small impact velocities.
From Figure 2-1 it can be seen that V., velocity normal to the plate at
the point of Impact, rises rapidly over the range V /U = 0 to 0.2. The
range of /Stk covered in this rapid velocity increase corresponds to
.8
.7
.6 ^ >
.5
u>
Q)
-<
U 4
o 0) >
c .3
o
4-*
u
a .2
.1
-0^
Starting Point
vertical
Component
Horizontal
Component
.8 1.0
From Marple, 1970
1.2
v§Tk
1.4 1.6 1.8 2.0 2.2
VSTK
0.458 -— 0.504 1.449
Jet Exit Plane
From Marple, 1970
$i
Re 25,000
From Marpte and Liu, 1978
Figure 2-3. Velocity profiles at the jet exit plane of the round impactor.
10
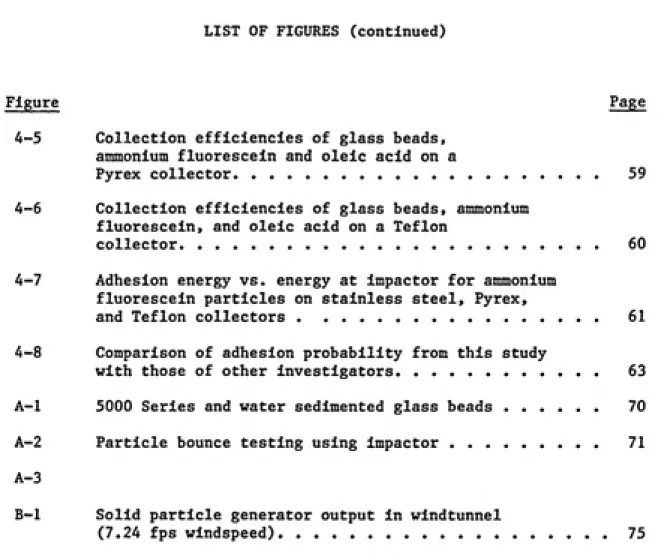
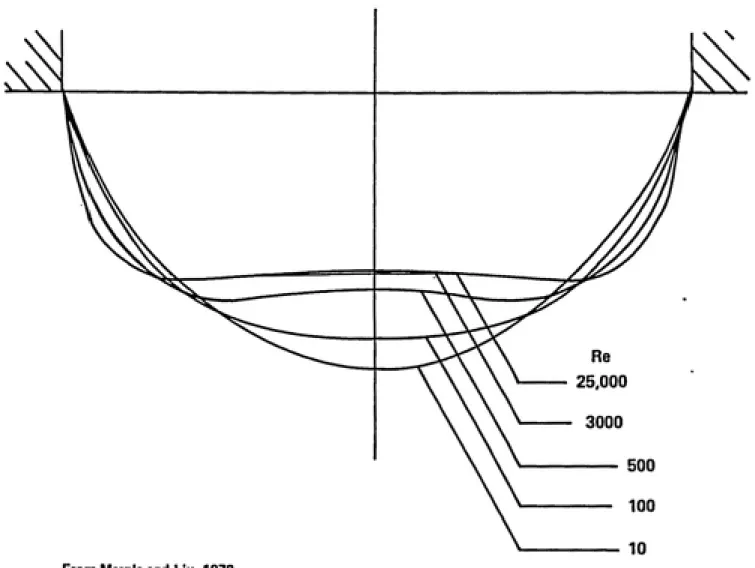
at the jet exit and Figure 2-4 showing collection efficiency curves at
various Rej's.
For most practical applications, it is desirable to eliminate
particle bounce in the range of /Stk up to twice the /Stk , or twice
the cutpoint particle diameter. From Figure 2-4, twice an average
/Stk is equal to /Stk of about 0.9.
Using the relation for the critical approach parameter, \li:
p ^ 1/2
Tp = V» d( -^
ͣ
n z p
o
1/2
(3)
and rearranging it in terms of particles Stokes and Rej:
/p \l/2 / 3 y \/V.\/Stk Rej \ 1/2
Bering (1984) substituted an average critical value for ^, as reported
by Cheng and Yeh (1979), of 0.03 cm2/s and solved for Rej with a /Stk =
0.9, V /U = 0.7, and C =1. She found that the Rej must be less than
9 to ensure particle capture at twice the cutpoint.
2.1.2 Particle Capture by Surfaces
Dahneke (1971) developed a simple one-dimensional model of parti¬
cle collision in which the collision is characterized in terms of the
energy of the particle-surface system. A particle approaches a flat
surface with a velocity normal to the surface, V , with kinetic energy
due to V , KE, = 1/2 m V.2 where m is the particle mass. The particle
is attracted to the surface under the Influence of van der Waals
potential, E , and, consequently, has a total energy of Impact at
collision of KE, + E . A fraction of this energy, e, the coefficient
of restitution, is conservatively stored in an elastic collision and is
regained on rebound. Kinetic energy at rebound from the surface is
therefore equal to e2(KE + E ). Part of this energy is used to escape
the van der Waals attraction or other attractive forces. When the
particle has rebounded beyond the Influence of the surface, it has the
Efficiency, E
o
3
3
o
«Q
c
ro
I
m
3 O
"<
n c < (D
o
e 3
a
3'
ͣ
o
01 o
CO
09 3
Q.
<
31
CD
•<
3
O
3 C 3
3
^ 0.5
H
From Marpto, 1970
Re
Figure 2-5. Effect of Reynolds number on V^TK for a round impactor at S/W » 1/2.
13
KE = e2(KE. + E.) - E . (5) r i i r
For simplification, E = E = E . When the particle energy is too low, it will be captured on the surface. With a high V , on the other hand, the particle will have sufficient energy to overcome the surface
attraction and will bounce. When KE = 0, particles will be captured.
KE > 0 will lead to particle rebound. A critical velocity, V* which
defines this limit between capture and bounce, is:
v* = r^iL^^"\ (6)
r 2E a_-e2)1 1/2
E, based on the Bradley-Hamaker theory can be calculated from:
^ 12z ^'^
where A is the Bradley-Hamaker constant for the sphere-surface combina¬ tion, d is the particle diameter, and z is the separation between the sphere and the flat. Values for z are generally considered to be
0.0004 X 10 ** cm. Values for A are frequently not known but vary
between lO"!^ and lO'^^ ergs (Dahneke, 1971).
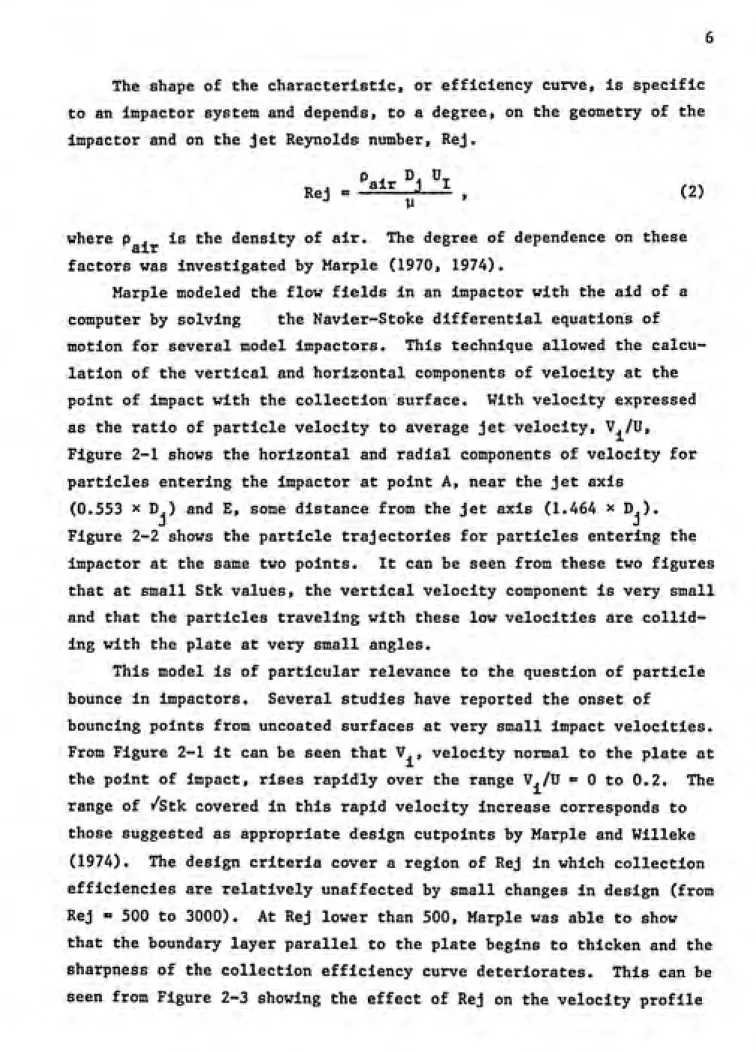
The dependence of V* on particle diameter can be evaluated from the expression:
= Tail
I IT Z
v.= 1--^
%'
1/2
/d . (8)
This relationship is plotted in Figure 2-6.
Several simplifying assumptions are necessary for this evaluation: 1. Viscous drag does not significantly influence particle
motion near the surface.
2. The particles are perfectly smooth nonrotating spheres. 3. The surfaces are perfectly smooth, solid, flat, or
cylindrical surfaces.
4. The particles approach the surface with normal or near
normal incidence.
Coefficients of restitution have been determined experimentally by
measuring particle velocity immediately prior to and following the
o 0) E u
>
lU
V
102
^
^
10.0 ^
"^
e = 0.99
e = 0.98
1.0
*
V
0.1 1 1
,"^
X ,
.01 0.1
From Dahneke, 1973
1.0
d,/im
10 10^
Figure 2-6. The theoretical dependence of critical rebound velocity on particle diameter
15
^'V'''(^
^\] a - e^). (9)
where e is the as3nnptotlc limit of V /V in the intermediate V range,
and V is the velocity of the particle after impact.
2.2 Review of Experimental Literature
Theoretical work concerning particle bounce has concentrated on prediction of a critical particle velocity above which particles will begin to rebound from an impaction surface. A portion of the experi¬ mental work reviewed here attempts to determine a critical velocity and compares the experimentally derived value to that predicted by theory. However, the theory does not provide any distribution of adhesion probabilities. In impactor and filter systems, the critical velocity appears to be so low that bouncing occurs, for all practical purposes, at the same point that collection begins. Consequently, a substantial body of experimental data consists of determinations of adhesion
probabilities of particles having velocities greater than the critical
velocity. Ultimately, it would be useful to be able to predict adhe¬
sion probabilities in a given sampler in order to apply a bounce
correction factor to collected data.
Both Dahneke (1973, 1974) and Paw (1983) devised experimental
systems to measure adhesion energy of particles traveling at a range of velocities.
Dahneke produced a beam of particles by expanding aerosol through
a capillary into a vacuum chamber. The particle beam was directed
vertically upward in a vacuum chamber. A deceleration chamber was incorporated into the system where particle beam velocity was con¬
trolled by regulating air pressure. Time of flight data for single
particles In the beam was collected as a particle passed through a pair
of focused HeNe laser beams. In this manner, particle velocity prior
to impact with the target and following Impact with the target was
measured. The coefficent of restitution and the ratio of rebound
16
targets of polished quartz, gold on glass, gold foil, and polystyrene. All coefficients of restitution were greater that 0.90, with the
exception of very thin gold foil for which the coefficent was 0.45.
Coefficients decreased with decreasing particle diameter. The PSL/PSL
combination showed the lowest coefficent at 0.90.
The shape of V /V. distributions versus incident velocity for microscopic particles measured over a range of velocities by Dahneke compares favorably with the better understood theory of bounce for
large steel balls. The Dahneke theoretical formulation of a simple
expression appears to give a good description of small uncharged
particle bounce.
Comparison of experimentally determined critical velocities to those expected from theory was disappointing. The theory predicted a value several orders of magnitude smaller than the experimental criti¬ cal velocities. Possible reasons for the discrepancy, suggested by the author, included the inapproprlateness of the Bradley-Hamaker expres¬ sion to account for the adhesion energy of small PSL spheres, failure to account for elastic flattening, surface effects due to the stabi¬ lizer dried on the particles, and contact charging.
Paw generated biological particles into a windtunnel using a simple fluidized bed technique. A cylindrical obstacle with a target material wrapped around it was placed in the tunnel normal to the flow.
Particle trajectories were photographed as the particle hit and re¬ bounded from the target surface. From examination of the negatives and comparison with objects of known size, data consisting of distances that particles bounced from the target, the number of particles imping¬ ing on the target in a given region of the photograph, and the number of particles bouncing from the target in the same region of the photo¬ graph—all as a function of wind speed—was collected. A Runge-Kutta computer program was formulated to convert the raw data to particle velocity normal to the target before and after impingement. From these velocities the coefficients of restitution were determined. Resultant values are listed in Table 2-1.
Plots of V /V versus impingement velocity for the biological
TABLE 2-1. SUMMARY REVIEW OF PERTINENT LITERATURE REPORTED EXPERIMENTS
Reference Dp Impactor Type Re Experimental Surface Velocity Particle Material Results Dahneke (1973) 1.27 vm target surface in
a vacuum
304 Stainless Steel-polished
Quartz polished
PSL Velocity above which
bouncing predominates:
-83 cm/s for stainless
steel;
-91 cm/s for polished
quartz
e " 0.960 on quartz; 2E 1-e2 1/2
-) using: V* "
(-m e"" gives a theoretical V* » 6,3 cm/s, * 2 orders of magnitude smaller than
experimental value.
Develops experimental procedure for measuring adhesion energy rather than adhesion force.
TABLE 2-1 (continue)
Reference Dp Impactor Type Re
Experimental Surface Velocity Particle Material Results
Loeffler (1974) 3 vm
5 ym
10 \m 5.85 vm
2.75 um 2.15 um
single fiber .63-2.51 Polyamlde fiber
Glass fiber
1.80 pm
1.25 vm
glass Lowest adhesion to harder
quartz glass fiber
paraffin Highest adhesion:
paraffin, quartz, glass Quartz are irregularly
shaped and It appears
shape enhances adhesion
more than hardness enhances rebound.
Small paraffin particles
appear to exhibit
partly elastic behavior Onset of bounce:
10 ym - 0.03 m/s glass
spheres on polyamlde
fiber
5 pm - 0.05 m/s
Theoretical and experi¬ mental critical veloci¬ ties compare favorably.
Electrostatic forces
appear to make a large contribution to the transport process as
the particles approach
the fiber.
(continue)
TABLE 2-1 (continue)
Reference Dp Impactor Type Re Experimental Surface Velocity Particle Material Results
Dahneke (1975) 0.50 pm PSL 0,81 urn PSL 1.27 pm PSL 1.27-.81 ym PSL
2,02 vm PVT
.51 lim silica
target in vacuum
polished quartz gold/glass polystyrene gold foil polished quartz Various to 300 m/s polystrene latex polyvlnyltoluene silica Measured experimental
coefficient of restitu¬ tions for various sized
particle materials on
various surfaces.
The general shape of the
curve of Vreflected/
Vlncldent showed good agreement with energy balance based on theory of larger steel ball
bounce.
Magnitude off by several orders of magnitude. Suggest adhesion energy
of PSL Is much greater than predicted by clas¬ sical theory.
Vcrltlcal for 1.27 pm PSL on quartz =» 120 cm/s. Vcrltlcal for 1 pm silica
on quartz * 10 cm/s.
Larger particles lost less energy In the
bounce than smaller
particles. (continue)
TABLE 2-1 (continue)
Reference Dp
Impactor Type Re Experimental Surface Velocity
Particle Material Results
Rao & Whltby
(1978)
1.1 lim
1.01 um .794 m .79 um .822 um
round Jet single stage Impactors
glass
oil and adhesive
coated glass
glass fiber filters Whatman filters
polystyrene latex Bounce significant from
all but oil-coated
surfaces.
Dry surfaces showed a
maximum collection
efficiency from 20-50Z
and then dropped off with Increasing parti¬ cle diameter.
Glass fiber filter reduc¬
ed bounce (over dry glass plate), but
alters collection effi¬
ciency characteristic. Loading study: on oiled
plate, as collected
layer Increased, col¬
lection efficiency In¬
creased; suggests a
wlcklng of oil accounts
for Increased effi¬ ciency.
Concludes: 1) stage
material significantly
Influences collection
efficiency; 2) theo¬ retical stage cutpolnts are not applicable in
general. Calibration
Is necessary.
(continue)
TABLE 2-1 (continue)
Reference Dp
Inpactor Type Re
Experimental Surface Velocity Particle Material
ResultsEsmen et al. 4.4 m
single jet single
(1978) 6.2 (removable) stage 8.8 impactor U.6 12.4 15.4
brass - ASTM B36
aluminum - ASTM B221 coated with carbon
black
solid uranine Calculates bouncing frac¬
tion by counting foot¬ prints left on carbon black by bounced parti¬ cles and particles retained on the impac¬
tion surface.
Impact energies calcu¬ lated using Marple's solution for impact
velocities.
Good correlation between
bouncing fraction vs.
impact energy.
Maximum adhesion energies
—8
aluminum: 0.477-10.0x10
ergs
—8 brass: 0.350-5.6x10 erg From experimental data;
A
Al rass
9.76x10•13 ergs
8.91xl0~'^ ergs
-8
Z = 4.26x10 ' cm;
showing good agreement
with Independently
established values. Brass bounder than
aluminum.
(continue)
TABLE 2-1 (continue)
Reference Dp
Impactor Type
Re Experimental Surface Velocity
Particle Material Results Cheng and Yeh 11.9 nmradial silt jet
(1979) 5.70 urn
3.40 m 2.02 um 1.01 m 0,822
(Sierra) - cascade 667-774 uncoated stainless polystyrene latex Uses various size PSL
spheres at a range of
/Stk.
Seml-emplrlcal method to
determine V*:
dp V*
(pm) /Stk (cm/s) VI/U
5.7 0.455 43,3 0.111
3.40 0.467 88.1 0.137
2.02 0.486 184 0.177
1.011 0.486 355 0.177 0.822 0,501 551 0.209 Bounce from uncoated
stainless steel plate begins at or slightly
above each stage's
cut-point.
Collection efficiency peaks at from 35-55!!;
and reaches a minimum at ii^tk « 0.6 going as low as 5%.
Wall loss studies show
bouncing Increases wall
losses by * 50% at /Stk
* 0.8 and * 14% at
smaller particle sizes.
TABLE 2-1 (continue)
Reference Dp Impactor Type Re
Experimental Surface Velocity Particle Material Results
Ellenbecker et al.
(1980)
Flyash: ctnd 0.14 pm
eg - 1.9
DOP: cmd
0.7 pm
ag - 2.05
stainless steel fiber filter - 310 stainless
steel
stainless steel fiber 1.0-8.0 m/s flyash DOP
Collection efficiency
the same for liquid and solid particles until * /stk of 1, where
maximum efficiency Is
reached.
Theoretical efficiency
and liquid particle ef¬
ficiency are In agree¬ ment. Increase In velo¬ city shows further de¬ crease In collection efficiency which Is most marked at high Stk
Plot of particle kinetic energy against adhesion probability shows good
correlation with high probability below <« 10" J and low probability above
« 10" J. Scatter of
points increased with Increasing kinetic
energy.
(continue)
TABLE 2-1 (continue)
Reference Dp Impactor Type Re
Experimental Surface Velocity Particle Material Results
Paw (1983) 20-40 urn covered wooden
cylinder In low speed wind tunnel
leaf sections: -American elm
-tulip poplar glass
Various to
* 5 m/s
lycopodlum spores ragweed pollen
glass beads
Experiment at 60% RH to
eliminate charging
effects.
Particles introduced
Iso-klnetlcally to wind tunnel wind speed.
Particle size distribu¬ tion for glass beads
not specified.
Found that all the parti¬
cle types rebounded
from surfaces at a
characteristic critical Impact speed regardless
of surface type.
Coefficient of restitu¬
tion determined:
Glass Lycopodlum Ragweed 0.825 0.636 0.514
average from all
surfaces.
Adhesion energy:
Glass: 7.29x10" erg; Lycopodlum: 2.78x10" erg Ragweed: 6.78xl0~ erg
Critical velocity: Glass: 0.28 m/s
Lycopodlum: 0.61 m/s Ragweed: 2.87 m/s.
Concludes: 1) critical
rebound speeds appear
to depend on particle
type and be relatively Independent of surface type; 2)
Bradley-Hamaker adhesion theory
estimates adhesion
energies at higher than experimentally derived
data by several orders of magnitude.
TABLE 2-1 (continue)
Reference Dp Impactor Type Re Experimental Surface Velocity Particle Material Results
Bering (1984) 1.8 pm Battelle - single round Jet per stage
Cascade
560-2200 oiled glass frit
dry glass
oiled filter
dry filter
potassium bromide
PSL
Oiled glass frit (Ace Type E) shows no bounce
and no loading effects.
Dry glass collection efficiency peaks * 60% at a /Stk * 4.5. Dry filter shows a peak
382 at a /Stk at 0.4. No interference with
chemical analysis with oleic acid-coated glass
frit.
26
surface structures of the spores and pollens. However, the general
shape of the curves resembled the Dahneke curves, supporting the
selection of Runge-Kutta modeling technique.
Coefficients of restitution calculated for the biological
particle/target combination were low, which is consistent with the
intuitive sense of rebound from a thin, soft leaf target. Dahneke also
found that thin gold foil showed very much reduced coefficient of
restitution compared to the gold on a rigid glass substrate target.
Pollen particles on a glass target had a low coefficient of restitu¬
tion. The ragweed pollen particles appear to be less prone to bounce
(compared to a similar but smooth particle) despite splney surface
protrusions which might be expected to contribute to particle bounce by
reducing the area on the particle surface in contact with the target's
surface.
Critical rebound velocities for all particle materials tested by
Paw were lower than the those reported by Dahneke. Paw used particles
of 20 to 40 ym diameter. Since critical velocity Is proportional to
the inverse of particle mass (Equation 6) larger particles would be
expected to have much lower critical rebound velocities than
micron-sized particles.Paw reported no significant difference in critical rebound veloc¬
ity for different target surfaces while very significant differences
were present in critical rebound velocities among the three particle
materials studied. This observation has not been supported by the work
of other investigators (Hlller and Loeffler, 1974; Rao and Whitby,
1978; Esmen et al., 1978; Bering, 1984).
Paw does not provide sufficient information to establish whether
heavy target loading conditions were present during the windtunnel
testing. However, when heavy loading of the target occurs, the target
surface becomes a layer of the particles. The particle-target material
interaction is replaced by a particle-particle layer interaction. Such
conditions may account for the apparent lack of difference between
27
surface (possibly due to wicklng of the oil used to enhance adhesion of
the loading layers of particles), while Reischl and John (1978) and
Bering (1984) found that particle loading decreased collection of a
substrate using PSL or potassium iodide particles. In the pilot study
report in Appendix A, collection efficiency of ragweed pollen particles
and 20-ym ammonium fluorescein particles on greased stainless steel
under heavy loading conditions were compared. When ammonium fluores¬
cein particles essentially impacted on ammonium fluorescein particles,
collection efficiency dropped rapidly approaching the level of bounce
found on bare stainless steel plates. Ragweed pollen collection
efficiency remained constant under heavy loading conditions and was
comparable to the collection efficiency obtained under normal loading
conditions with a greased collection substrate. Evidently, the pollen
particles collected themselves effectively, while the ammonium fluores¬
cein particles provided a very bouncy target surface for themselves.
Similar particle-particle collection characteristic differences may
account for differing observations concerning particle loading effects.
Paw's calculations of adhesion energies, using Bradley-Hamaker
theory, were reported to be high by comparison to the experimentally
measured adhesion force for the same particle surface-pairs by a factor
of 4 to 200 times, even after adjustment was made to account for the
larger z (as measured by scanning electron microscopy) of 1 ym.
Esmen et al. (1978) selected an Impactor system to examine the
relationship between theoretically and experimentally derived adhesion
energies. While the use of Impactors to this end are limited due to
the complexities Involved In the calculations of impact energies, Esmen
was able to show excellent experimental agreement with Dahneke's
theory.
Fraction of particles bouncing from an aluminum and a brass
substrate were determined by optical microscope counting of "foot¬
prints" left on a thin layer of carbon black on the Impaction surface
by particles which struck but failed to adhere to the plate. Impaction
energy of particles striking the surface was calculated using Marple's
28
the calculated impaction energy in the case of both substrate materi¬
als, with the harder brass showing lower impaction energy required for
a given bouncing fraction as would be expected.
By extrapolating the bouncing fraction back to 0, the maximum
energy of adhesion was determined for each particle size and substrate.
These values vary from .477 ^ 10~^ to 10 x 10 ^ ergs for aluminum and
0.350 X 10~^ to 5.60 ^ 10~^ ergs for brass. In order to verify experi¬
mental and theoretical agreement, values for particle bulk mechanical
property, Kp, Bradley-Hamaker constants. A, and separation distances
between particle and surface, z, were calculated from the experimental
data and compared with Independantly reported values. In addition, if
Dahneke's theory is consistent, values of A/z and ratios of diameter
and energy to their dimenslonless counterparts should be constant over
the experimental conditions. Reasonably good agreement was found in
all these tests of experimental agreement with theory. The experi¬
mentally determined values of for A were 9.76 x 10 ^^ ergs for alumi¬
num, 8.91 X 10~^^ ergs for brass, and for z, 4.26 x 10 ^ cm.
Ellenbecker et al. (1980) and Loeffler (1974) examined particle
bounce from fibers. Ellenbecker measured bounce of fly ash particles
from mats of stainless steel fibers in the 1- to 8-m/s particle veloc¬
ity range. When particle kinetic energy was plotted against adhesion
probabilities, a reasonably good correlation was seen with scatter
increasing as particle kinetic energy increased. Considering differ¬
ence in particle shape and impaction surface geometry, good agreement
was observed when compared to Esmen's data for bounce from a brass
plate.
Loeffler measured adhesion probabilities of glass, quartz, and
paraffin particles on polyamide and glass single fibers. From theory,
a plot of critical particle velocity versus particle diameter at
29
Cheng and Yeh (1979) used a semi-empirical method to predict the
onset of particle bounce in a Sierra radial slit jet impactor. The
collection efficiency of each impactor stage was measured with adhesive
coated stainless steel plates and PSL spheres. The procedure was then
repeated with uncoated steel plates over a range of particle /Stk from
0.3 to 0.8. Impact velocities at the stagnation point of the collec¬
tion surface were modeled over the range of /Stk using approximations
proposed by Mercer and Chow (1968) and Mercer and Stafford (1969).
Critical rebound velocities were calculated using Dahneke's theoretical
formulations. On the first stage, rebound occured at /Stk of 0.455,
which corresponded to a velocity of 43.3 cm/s. The highest critical
rebound velocity was 551 cm/s in the last stage. Cheng and Yeh found
that no critical rebound velocity, expressed in units of average jet
velocity, exceeded 0.209.
A general formulation of minimum impact velocity:
V^ d < 5 X 10"^ m^/s,
was advanced to limit the occurrence of bouncing to particles that are
larger than the stage cutpoint size.
In addition to determining a critical rebound velocity, the work
of Cheng and Yeh provides some insight into the adhesion probability
distribution for the impactor system. Adhesive coated stages were not
successful in completely eliminating bouncing. The collection effi¬
ciency on all coated stages never exceeded 89 percent, while liquid DOP
particle efficiencies reached near 100 percent on all impactor stages.
On all but the stage labeled No. 4, bouncing began at or slightly above
the stage cutpoint. In stage No. 4, with a cutpoint of 1.0 vm, collec¬
tion efficiency was reduced to approximately 35 percent at the
theoretical 50-percent collection efficiency point. All of the
collection efficiency curves for bare stainless steel plates had a
similar shape with a maximum collection efficiency occuring at a
slightly larger v'Stk than the cutpoint, with values ranging from
approximately 35 to 55 percent and dropping off rapidly to minimums of
from 5 to 25 percent at a /Stk of about 0.6.
30
Esmen, 1978; Ellenbecker et al., 1980; Bering, 1984). Collection effi¬
ciency curves collected in all the work reviewed follow the the "no
bounce" curve up to some point near the impactor cut point and then
drop sharply to a minimum. Hering (1984) reported the collection
efficiency of 1.8-)jm potassium bromide particles on both dry glass and
Teflon® filter impaction surfaces dropped to a minimum of near
0 percent at a /Stk of less than 0.8. Ellenbecker et al. (1980), cal¬
culating the single fiber collection efficiency from tests using a
stainless steel filters (not In an impactor), found the same minimum to
occur for fly ash particles sampled at a velocity of 8.0 m/s at close
to a /Stk of 100. However, for fly ash particles sampled at a velocity
of 1.5 m/s, even at /Stk greater than 100, the minimum collection
efficiency did not drop below 20 percent. Rao and Whitby (1978) found
the minimum to occur at /Stk close to 0.55 with an efficiency of about
25 percent for 1.10- and 1.011-ym PSL particles on uncoated glass. The
collection efficiency rose after this minimum was reached up to
approximately 30 percent at a /Stk of 0.65 where data collection ended.
Several investigators have examined the effect of impactor sur¬
faces on particle bounce. Rao and Whitby (1978) compared bounce
characteristics of PSL particles on oil coated glass, glass fiber
filters, Whatman filters, and bare glass. The untreated glass showed
extensive bounce, never exceeding a collection efficiency of
55 percent, while the oil coated glass appeared to have collection
characteristics approaching those of Marple's theoretical impactor.
The glass fiber filter reduced bounce somewhat; however, collection
efficiency did not exceed 75 percent. The Whatman filter showed
generally poor collection characteristics. Both the glass fiber and
bare glass impaction surfaces were more efficient than predicted on the
basis of impaction alone at /Stk below about 0.45. This latter point
tends to suggest other collection mechanisms are at work in the region
below the impactor cutpoint. Loeffler (1974) made a similar observa¬
tion with glass particles collected on glass filters and concluded that
electrostatic forces made a large contribution to the transport process
as the particles approach the filter. In a subsequent study, Loeffler
(1975) modeled single fiber collection efficiency taking into account
31
field. The resulting theoretical collection efficiency curves show
Increased efficiencies would be expected (as compared with the model
neglecting electrostatic force) at low /Stk, dipping to a minimum at
some point less than /Stk = 1. The model, including electrostatic
forces, then parallels the model which excludes the latter effect.
Investigation with charged particles, charged fibers, and real filters
supported the conclusion that electrostatic effects can modify colli¬
sion efficiency •
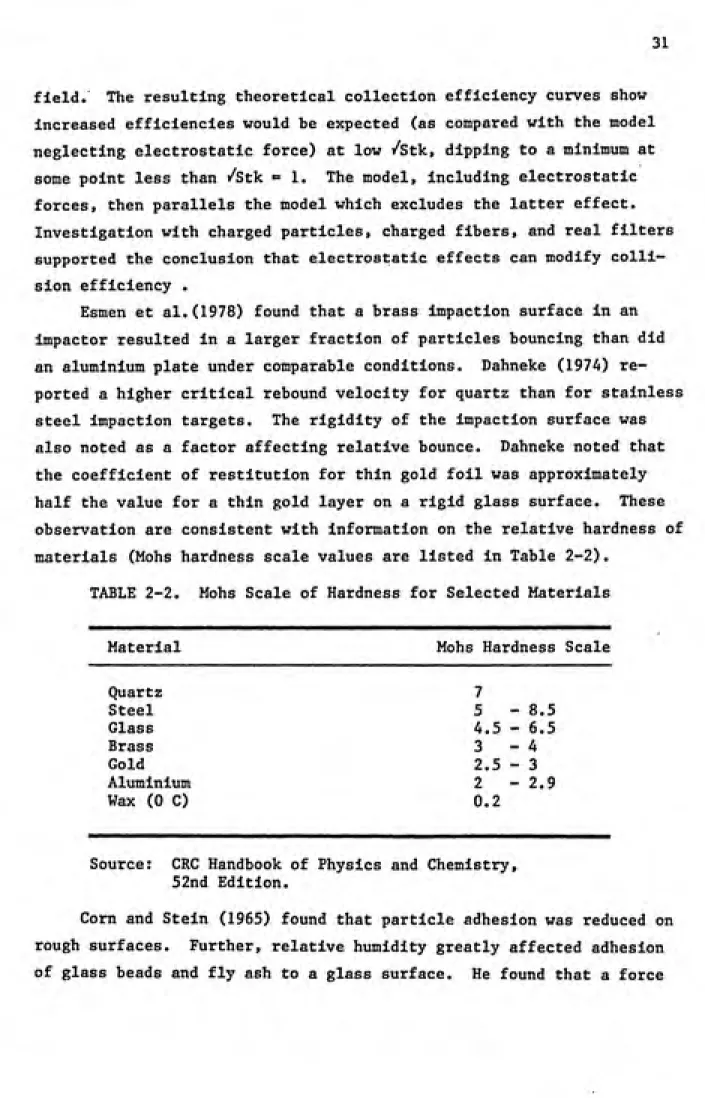
Esmen et al.(1978) found that a brass impaction surface in an
Impactor resulted in a larger fraction of particles bouncing than did
an aluminium plate under comparable conditions. Dahneke (1974) re¬
ported a higher critical rebound velocity for quartz than for stainless
steel impaction targets. The rigidity of the impaction surface was
also noted as a factor affecting relative bounce. Dahneke noted that
the coefficient of restitution for thin gold foil was approximately
half the value for a thin gold layer on a rigid glass surface. These
observation are consistent with information on the relative hardness of
materials (Mohs hardness scale values are listed in Table 2-2).
TABLE 2-2. Mohs Scale of Hardness for Selected Materials
Material Mohs Hardness Scale
Quartz 7
Steel 5-8.5
Glass 4.5 - 6.5
Brass 3 - 4
Gold 2.5 - 3
Aluminium 2 - 2.9
Wax (0 C) 0.2
Source: CRC Handbook of Physics and Chemistry,
52nd Edition.
32
of 0.66 dyne was required to remove 50 percent of adhering 37-pm
particles at a relative humidity of 35 percent, while at a relative
humidity of 75 percent, 0.96 dynes were required to remove the same
proportion of 37-pm particles.
Very little information has been collected on the relative
bounci-ness of particle materials. Loeffler (1974) observed that quartz
particles showed less bouncing than did smooth glass spheres even
though quartz is a harder material. This was attributed to a particle
shape effect. Irregular quartz particles would have a larger number of
contact points than the smooth glass spheres. Paraffin wax particles
were found to be somewhat bounder than might be expected, falling in
the same range of adhesion probabilities as did the quartz particles.
The wax spheres appear to exhibit a partly elastic behavior at the
microscopic size level. Loeffler verified this latter observation by
repeating impaction tests with a tacky fiber. Paraffin particle adhe¬
sion was greatly increased under these conditions. In the pilot study
reported in Appendix A, the collection efficiency of a stainless steel
Impaction plate with 20-pm particles of ammonium fluorescein, glass
beads, and ragweed pollen was compared. The particles were collected
with efficiencies of 38 percent, 52 percent and 78 percent, respec¬
tively. The same relative bounclness of ragweed pollen and glass beads
collected on a glass target was noted by Paw (1983).
Summary
A review of experimental literature shows general agreement on the
nature of solid particle bounce from impaction surfaces whether they be
fibers or plates. A variety of target and particle characteristics
have been reported to affect the fraction of particles bouncing in a
given system. In general, the properties of the surface that have been
shown to affect collection efficiency are surface hardness, particle
33
been attempted in the studies reviewed. Irregular particle shape was
reported to reduce particle bounce.Other particle material characteristics have also been reported to
affect the fraction of particles bouncing in all but one of the studies
reviewed.
Determination of critical rebound velocities was attempted in
fundamental studies, as well as semi-empirically in impactor systems
and with single fibers. Because of the range of experimental condi¬
tions involved, it is difficult to comment on overall agreement.
TABLE 2-3. COMPARISON OF LITERATURE REPORTED VALUES FOR COEFFICIENT OF RESTITUTION AND CRITICAL REBOUND VELOCITY
Reference
Particle Material Diameter (pm) Collector Material
V* (cm/s)
Experimental Theoretical
Dahneke (1971, 1973, 1975) Paw (1983) PSL Silica PSL PSL Silica PSL PSL PSL Glass Glass Loeffler (1978) Broom (1979)
Cheng & Yeh
(1979) Lycopodium Spores Ragweed Pollen Quartz Glass Wax Quartz Glass Glass PSL PSL PSL PSL 1.27 1.0 0.81 0.50 0.51 1.27 0.81 0.81 1.27 20-40 20-40 20-40 20-40 5 5 10 10 10 4.7 5.7 3.40 2.02 1.011 0.822 polished quartz polished quartz
0.960 120, 91
< 10
6.3
polished quartz polished quartz polished quartz gold on glass gold on glass
0.90 0.93 ft' 0.92 0.930 0.90 PSL 0.90 polished stainless steel
< 0.960 83
glass leaf 0.950 0.763-0.828 25 26-31 glass leaf 0.816 0.556-0.634 62 51-69
leaf 0.395-0.577 221-347
polyamide ^ 0.95 15
polyamlde * 0.95 5. 6
polyamide —
10
polyamide 0.82 8
polyamide 0.82 3
steel —
9.8
stainless steel ^ 0.95 43.3
35
3.0 EXPERIMENTAL METHODS
3.1 Pilot Study
A pilot study was undertaken to select appropriate methods and
experimental designs for the examination of particle bounce in inertial
impaction devices. A stainless steel and brass impactor (with a
removable stainless steel collector) was friction fitted to the inlet
probe of a Climet Model 208 light scattering Optical Particle Counter
(OPC). The OPC was modified to permit detection of particles larger
than 20 ym in diameter and to permit an interface with a Radio Shack
TRS-80 computer which was used to acquire and manipulate data. Parti¬
cle materials used in the study were glass beads, ragweed pollen, and
ammonium fluorescein. Details of the pilot study experiment are
contained in Appendix A.
Based on the findings of the pilot study, the following factors
were considered In the design of the final experiments: (1) The OPC
was a reasonable method of analyzing particle bounce information using
the above particle materials. Differences in the penetration of the
three materials were detectable with the OPC and were found to be
signicantly different from each other. (2) Particle loading on the
collector affects particle penetration through the impactor replacing
measurements of particle-collector effects with particle-particle
effects. To minimize uncertainty concerning the presence of loading
effects, the challenge concentration should be maintained at the
minimum necessary for reasonable detection. (3) The fluldized bed used
to generate glass beads in the pilot study was unable to provide a
constant aerosol concentration for any period in excess of 10 minutes.
This was due to the reduction in the load of beads available for
suspension in the bed over time. It was noted that the same generation
system delivered a constant concentration of ragweed pollen over a
36
of producing a constant concentration of glass beads over a period of
time in excess of one hour, would be necessary.
3.2 Methods
The collection efficiency of a given particle-material combination was determined in the current study with a Climet OPC. Monodisperse
ammonium fluorescein particles were generated using a TSI Model 3450 vibrating orifice aerosol generator. Glass beads were generated with a modified Timbrell asbestor generator (Timbrell et al., 1968). The
aerosol was passed through a 10-mCi Kr-85 source charge neutralizer (TSI Model 3054) before being sampled by the impactor. The optical OPC was located immediately downstream of the impactor. To reduce the concentration of particles in the sample, the aerosol was diluted with clean dry filtered air introduced through a porous tube diluter up¬ stream of the impactor. The experimental set-ups are diagrammed in
Figures 3-1 and 3-2.
The use of an OPC to evaluate particle penetration offers the advantages of near real-time data collection and short duration sam¬
pling periods. The short sample duration allows the acquisition of a large data base requiring no further laboratory analysis. In combina¬ tion with the addition of dilution air, short sampling periods prevent the buildup of sampled material on the substrate.
The "no bounce" case was determined by generating liquid oleic acid-uranine particles and counting the number of particles passing the various substrates. Since the oleic acid particles were generated as monodisperse aerosol, a second "no bounce case" was established for the polydisperse glass beads by adding an oleic acid soaked glass frit (Ace Glass, type E filter disc) collector to the randomized test series. Bering (1984) reported excellent particle capture characteristics for a
similar oiled glass frit, and she found no apparent particle buildup
Porous Tube Diluter
Dry Filtered
Air Kr-85
V.O.A.G.
Dilution Air
yy
Dispersion Air
Signal Frequency Generator Counter
^1.27 cm pipe
Impactor
O.P.C. M.C.A
Dry
Filtered v
Air \
Porous Tube Diluter
-I—I
Kr-85 Source
Dry Filtered Air
tb
Timbrell
Generator
1.27 cm pipe
Impactor
O.P.C M.C.A
Figure 3-2. Experimental configuration using Timbrel! glass bead generator.
39
The challenge concentration was determined by removing the impac¬
tion stage and counting the number of particles penetrating the unob¬
structed "shell" of the Impactor. Collection efficiencies were calcu¬
lated using the following formula:
n =
. number of particles penetrating impactor
number of particles penetrating "shell"
X 100
Bounce or rebound is defined as the difference between the collec¬
tion efficiency of liquid particles and the collection efficiency for a
given test aerosol having the same aerodynamic equivalent diameter as
the liquid particles.
The relative humidity of the sample air stream was monitored during each run and never exceeded 10 percent.
3.2.1 Impactor Design
Industrial hygiene and air pollution uses of inertlal impactors
usually require the separation of particles capable of penetrating into
the lung, from larger airborne particles. As a generalized case of
such a device, the impactor used in this experiment was designed to
have a 50-percent collection efficiency for particles having an aero¬
dynamic equivalent diameter of 5 pm.
The simplest possible configuration of an impactor was used to
allow the Isolation effects due to particle bounce from other factors
which might be peculiar to more complex Impactor designs. The experi¬
mental device was a single-stage Impactor with one round jet of 0.47 cm
in diameter, operated at a flow rate of 7100 cc/min, drawn by the OPC
pump. The jet velocity and Reynolds number were 682.1 cm/s and 2125,
respectively. The nozzle was constructed of brass tube; the main body
of the impactor was made of aluminum, and the impactor stage was made
of stainless steel. The design criteria recommended by Marple and
Wllleke (1976) were used. Figure 3-3 shows the theoretical character¬
40
.4 .5
Impactor Theoretical Parameters
1.0
Dj = 0.47 cm
S/Dj = 2.0
Vj =682cm/s
vSTRgo = 0.48
Rej = 2115.8
D50 = 5.0 nm
Q = 7100 cc/min
From Marple and Witleke, 1976
41
The nozzle of the impactor was 6.2 cm long beginning with a
7-degree externally tapered section. The internal diameter was 0.47 cm its entire length to the jet exit. All samples were drawn from the centerline of an open duct connected to the generation system (Fig¬ ure 3-1). The jet exit was 0.94 cm from the impaction surface, giving a jet-to-plate ratio of 2.
Figure 3-4 diagrams the impactor showing the removable stage.
Stainless steel and Teflon® substrates were polished to remove any
obvious surface imperfections. All substrates were washed in acetone and allowed to dry on a clean Kimwipe between samples.
3.2.2 Particle Generation
Monodisperse ammonium fluorescein and oleic acid-uranine particles were generated using a TSI Model 3450 Vibrating Orifice Aeorosol
Generator (VGAG). Particle diameter was determined from particle solution concentrations and VGAG operating parameters (Liu et al., 1974) and were verified by collecting a sample of the aerosol on a treated glass slide and measuring particle diameters with a traveling hair eyepiece calibrated against a stage micrometer. Correction for particle spread was applied to liquid particles according to the method described by Liu et al., (1972). Glass beads were separated with a
Donaldson Accucut aerodynamic particle separator (Majack Company) to
the desired size fraction. The glass bead feedstock was Potter Indus¬ tries (Hasbruck, New Jersey) 5000 Series glass beads. Operating
conditions selected for the operation of the Donaldson Accucut were designed to produce a fine size fraction consisting exclusively of particles less than 20 ym aerodynamic diameter (p glass 2.65 g/cc). A New Porton eyepiece graticule calibrated with a stage micrometer was used to size the fine fraction of the separated beads. A sample of glass beads was collected from the aerosol stream to check for evidence of glass bead breakage using an optical microscope. In addition, the Pyrex collector particle load was viewed under the microscope to assess particle distribution on the collector plate and the level of particle
0.47 cm
Collector
77777Z7,
.94 cm
1.85 cm Impaction
Stage
Stages O-rings
Pressure
Taps
A\\
-Cottaetor
Stage 1
Stage 2
Stage ^»~. Collector or Fiter
Inside Chamber Diameter -4.7 cm
Same i.d. at OPC inlet 0.317 cm
4>-N3
OPC Inlet
43
calculated to monitor particle loading. A summary of particle genera¬
tion methods is provided in Table 3-1.
For this experiment, a glass bead generator capable of delivering airborne beads at a constant concentration for a minimum period of two continuous hours without altering the size distribution of the powder was necessary. A variety of generation techniques were found to be
inadequate to this task including a fluidized bed and a brush-based generator. A system based on the asbestos generator described by Timbrell et al. (1968) was tested for compliance with the necessary performance criteria and met performance requirements in all tests. The Timbrell generator performance testing procedures and results are given in Appendix B. Figure 3-5 is a diagram of the glass bead
generator,
3.2.3 Particle Detection
Particles were detected with a Climet 210 Optical Particle Counter
in conjunction with a Climet 225 Multichannel Analyzer. Background counts were subtracted from challenge and sample counts. In the
channels of interest, the background levels accounted for an average of
less than 2 percent of challenge counts.
For ammonium fluorescein particles which are dark red-brown in
color, it was expected that excessive light absorption combined with fluorescence might pose difficulties in a light-scattering-based
detection system. In calibration of the OPC with monodisperse ammonium fluorescein particles using a Tracor Northern Model TN-1705 Pulse
Height Analyzer for signal analysis, considerable spread was noted in the signal voltage peak. In addition, the peak appeared in channels corresponding to about half the voltage expected, based on the PSL calibration curves for a lO-ym particle offered by the manufacturer. To ensure that the OPC count results could be reliably used, OPC counts were compared to fluorometry measurements of filter collected samples of the same aerosol.
TABLE 3-1. PARTICLE GENERATION METHODS
Particle Material Raw Feed
Bulk Density
(g/cc)
Diameter (\im)
Aerodynamic Physical Generator Operating Conditions Reference
Particle Diameter Verification
Oleic Acid
Uranlne
oleic acid and
uranlne dissolved in methanol 0.8935 7.0 10.0 3.2 5.3 7 10
TSI Model 3045 Dilution Air:
Vibrating Orifice Aerosol Generator 23000 cc/min Dispersion Air: 1500 cc/min Downstream Dilution
Air: 27336 cc/min
TSI Manual 1) VOAG parameters
Berglund &
Liu (1973)
2) Collection on 2X Nyebar coated
slides sized with
stage micrometer
traveling hair
eypiece; optical
microscope (Olan
et al.. 1982)
Aaaonlua Fluorescein Glass Beads fluorescein dissolved In O.IN NH.OH 4 Potter Industries Series 5000 glass beads 1.35 2.65 7.0 10.0 2.6 4.3 6.0 8.6
Soae as above Same as above
Polydlsperse Range 0.5-15 pm
cmad: 3 \im
Modified Tlmbrell
Vanderpool (1984)
Supply Air: Tlmbrell 40000 cc/min et al. Downstream Dilution (1968)
Air: 3000 cc/min
1) VOAG parameters
2) Collection on
glass slide sized with micrometer
calibrated travel¬
ing hair eyepiece 1) Donaldson Accucut,
Majack Co., with cutpoint < 20 urn aerodynamic dlam.
2) Optical microscopy using New Porton
graticule sizing;
minimum 100 field
or 100 particles 3) Cllmet CI-225 OPC
and Cllmet CI-210 Multichannel
Analyzer
Covered in detail in Appendix A.
45
Mixing
Chamber
Compressed Air in
Motor
/
ZS,
Particles in Carrier
Air Stream
Syringe Containing
Glass Beads
Syringe Pump
View 1: Generator in normal operating configuration.
Mixing
Blades
(Scraper)
Compressed Air \
\*- Particles
Syringe Pump Fed
Glass Bead Oalumn
View 2: Cross section of mixing chamber.
Mixing Blade (Scraper) Compressed
'Syringe Pump
Fed Glass BMds
View 3: Cut away of mixing chamber.
Figure 3-5. Glass bead generator based on the design of
46
Those were alternated with samples counted by the OPC with no filter in
place.
47
4.0 RESULTS AND DISCUSSION
4.1 Estimation of Error
Estimation of errors was calculated using a method developed by
Kashdan (1984), specifically for the comparison of impactor data.
Standard deviation of the collection efficiency ratio estimate, R* was
calculated with:
Std Dev (R) = R "l/ i ( (CV:N^)2 + (CV:sample)2 - ^ J , (lO)
where relative covariance, Cov, is calculated as:
. E N "Z sample
Cov = -^- Z N -sample--- , (11)
n-1 o "^ nand n is the number of replicate samples, N is the number of particles
penetrating the impactor when all collisions with the substrate result
in particle capture, and CV is the ratio of the standard deviation of
the replicates to their mean.
4.2 Collection Efficiencies