Daniel J. Pshock. Usability Heuristic Evaluation of 80 North Carolina Public Library Websites. A Master’s Paper for the M.S. in I.S. degree. April, 2016. 52 pages. Advisor: Ronald E. Bergquist
This study discusses the results of a heuristic evaluation of 80 public library websites in the state of North Carolina. Each public library website (PLW) was evaluated using a usability heuristic questionnaire, with questions covering criteria taken from human-computer interaction literature. Development of this questionnaire allowed a broad evaluation of 80 North Carolina PLWs to be conducted. The purpose of the study is to understand the extent to which PLWs in North Carolina meet basic usability heuristics. Developing a method of evaluation that can cover many PLWs of a specific locale allows librarians to use shared governance in future opportunities for investigation and
improvement of websites in North Carolina public libraries. Results show that North Carolina PLWs meet some usability heuristics but not others, and that most North Carolina PLWs are more usable than they are unusable.
Headings:
Usability
Heuristic evaluation
Public libraries
User experience
User-centered design
USABILITY HEURISTIC EVALUATION OF 80 NORTH CAROLINA PUBLIC LIBRARY WEBSITES
by
Daniel J. Pshock
A Master’s paper submitted to the faculty of the School of Information and Library Science of the University of North Carolina at Chapel Hill
in partial fulfillment of the requirements for the degree of Master of Science in
Information Science.
Chapel Hill, North Carolina
April 2016
Approved by
Table of Contents
1. INTRODUCTION ... 2
2. LITERATURE REVIEW ... 4
2.1 WHAT IS USABILITY? ... 4
2.2 HOW IS USABILITY MEASURED? ... 7
2.3 BROAD TESTING OF LIBRARY WEBSITES ... 13
2.4 EVALUATING PUBLIC LIBRARY WEBSITES (PLWS) IN NORTH CAROLINA ... 14
3. METHODS ... 16
3.1 PUBLIC LIBRARY WEBSITE QUESTIONNAIRE (PLWQ) ... 17
3.2 INTERPRETATION OF RESULTS ... 21
3.3 EVALUATING EACH PLW ... 22
3.4 EQUIPMENT USED ... 23
3.5 INTER-CODING ... 24
4. RESULTS ... 26
5. DISCUSSION ... 29
5.1 BASIC USABILITY OF PLWS IN NORTH CAROLINA ... 29
5.2 AVERAGE BASIC USABILITY SCORES OF PLWQ QUESTIONS ... 31
5.3 EFFECTIVENESS OF THE PLWQ IN PROVIDING CLEAR RESULTS ... 33
5.6 LIMITATIONS ... 35
5.4 FUTURE ACTIONS FROM NORTH CAROLINA LIBRARIANS ... 37
6. CONCLUSIONS ... 39
6.1 FUTURE WORK ... 39
6.2 CONCLUSION ... 39
BIBLIOGRAPHY ... 41
APPENDIX ... 48
PLWQ CRITERION SCORES ... 48
INTER-CODER CRITERION SCORES ... 50
FIGURE1. BASIC USABILITY SCORES FOR NORTH CAROLINA PLWS ... 27
FIGURE2. DISTRIBUTION OF UNIQUE BASIC USABILITY SCORES ACROSS ALL NORTH CAROLINA PLWS ... 28
FIGURE3. AVERAGE BASIC USABILITY SCORES FOR EVERY QUESTION ON THE PLWQ ... 28
1.
Introduction
Websites have been an important resource for libraries over the last two decades or so.
The first library websites began operation in the early 1990s. For example, when the first
web browser, Mosaic, was released in 1993, academic health science libraries began
building their own websites (Brower 2004). Since then, libraries have used websites to
meet library user needs. In a comparison of academic library websites from 2000 to 2010,
Aharony (2012) notes a large amount of change occurring in library websites as a
response to the Web’s overall growth, especially in terms of focusing more on the needs
of library users. Today, a website might be the first library resource a user comes into
contact with. Many users visit them more frequently than physical library locations
(Connell 2008), and library websites can serve as the public face for a library, its
services, and its staff (McGillis & Toms 2001). Users might also expect there to be
certain library functions available directly on a library’s website, e.g. reserving meeting
spaces or study rooms, renewing borrowed library materials, searching the library’s
catalog, etc. A library provides better service if it maintains a website that is usable,
accessible, and allows users to complete important tasks.
This study discusses the results of a heuristic evaluation of 80 public library websites in
the state of North Carolina. Each public library website (PLW) was evaluated using a
usability heuristic questionnaire, with questions covering criteria taken from
evaluation of 80 PLWs to be conducted in a relatively short amount of time. The purpose
of the study is to understand the extent to which public library websites in North Carolina
meet basic usability heuristics. Developing a method of evaluation that can cover many
public library websites creates opportunities for further investigation and improvement of
websites in North Carolina public libraries.
The overall state of usability of PLWs in North Carolina demonstrates to librarians what
actions, if any, should be taken to better meet the needs of users. Focusing on the locale
of North Carolina also means that librarians in this state can use shared governing bodies
and resources for any future investigations or improvements.
If public library websites are funded by the communities they serve through taxes, and if
these PLWs do not meet basic Web usability guidelines currently used, then those PLWs
provide a direct disservice to their community. The onus falls on librarians at all levels to
evaluate needs and adequately assess and design user-facing systems.
Results show that North Carolina PLWs meet some usability heuristics but not others,
2.
Literature Review
2.1 What is usability?
Usability can have many definitions. Previous attempts at defining it often include
multiple parts. In any case, the definition of usability and its importance on system design
is historically user-centered. Usability is defined simply as the extent to which a system
allows users to do what they want in a given environment. Definitions of usability
typically involve a user who is trying to accomplish some set of tasks in a specific
situation, and a system may be called usable if users can do so in an acceptable way. A
heavily-cited definition is the International Organization for Standardization 9241-11,
which defines usability as “the extent to which a product can be used by specified users
to achieve specified goals with effectiveness, efficiency and satisfaction in a specified
context of use” (ISO/TC 1998, “Definitions”). Gould and Lewis (1985) established three
principles of designing for usability early on in a project:
• Establish an early focus on users
• Empirically and continuously test designs, prototypes, and products early in the
project’s lifespan
User needs then can be better addressed if they are taken into account first, and testing
and iterating on designs can aid in this. For Shackel (1991) and Chapnis (1991) the basis
of usability is ease of use and effectiveness of a system for a set of users carrying out
specific tasks in specific environments. Furthermore, these concepts of effectiveness, ease
of use, or acceptability should be left up to those people dealing with the end product –
the users. It is up to users – not developers or designers – to determine when a system is
easy to use (Dumas & Redish 1999), and the levels of experience and knowledge or
individual or cultural differences between users often have significant impact on how
easy a product is to use for a given person (Jordan 1998). A system or product then can
be described as “usable” if one does not need to be an expert to use it. Steve Krug,
usability consultant and author of Don’t Make Me Think, has a definition of usability that
especially focuses on this:
[Something is usable if] a person of average (or even below average) ability and experience can figure out how to use the thing to accomplish something without it being more trouble than it’s worth (Krug 2014, p. 9).
Jakob Nielsen is a highly cited figure in the field of human-computer interaction,
particularly in usability. In defining usability, Nielsen (1993) takes a stratified approach,
not using one definition to define the concept, instead pointing to five different
components of a system that inform how usable it is:
• Learnability (how quickly can users learn the system?)
• Efficiency (how productive can users be with the system?)
• Errors (how many errors are users committing?)
• Satisfaction (how subjectively pleasant is the system to use?)
Nielsen states that the two most important factors for usability are the tasks of the user
and their individual characteristics (Nielsen 1993). In Interaction Design: Beyond
Human-Computer Interaction, Rogers, Sharpe, and Preece (2011) add components of
safety (is the system safe to use?) and utility (to what extent does the system provide the
right functionality?) to this list, again stating that user needs, tasks, and characteristics are
the most important qualities to consider when developing usable systems. Other
components of usability can include guessability (how well can a user perform a new task
for the first time?)and system potential (what is the maximum level of performance
theoretically possible with the system?) (Jordan 1998). The discipline of creating systems
that are usable and accessible is defined as user-centered design (Rubin 1994), which
stands as a philosophy of putting users first during development.
Why is usability important? For one, usability can make organizations money.
Manufacturing plants with unusable machinery cannot produce as much output as those
plants with more usable equipment (Jordan 1998). Nielsen (1993) provides several case
studies of companies saving hundreds of thousands of dollars from usability engineering
methods, but does note that these savings are not immediate and require time after
development to accrue. Companies that design and manufacture usable products can also
it were unusable (Dumas & Redish 1999; Jordan 1998), and reduce costs in internal
products, support, training, and maintenance (Duman & Redish 1999).
For libraries, usability is especially important considering the proliferation of information
available on the Web. The large amount of information available on the Web re-positions
the librarian profession to enter the realm of Web development and design (Norlin &
Winters 2002); as the information landscape changes, libraries can continue to meet the
needs of users via simple, intuitive experiences (Schmidt & Etches 2012). In the same
way that libraries have traditionally served as intermediaries for print materials, so they
are able to do for the expanding Web. The library website itself can be this intermediary
providing information directly to users (Davidsen & Yankee 2004). With so much
information out there, the library website can and should aid users in finding materials
with usable systems (Garlock 1999). Otherwise, if a library website cannot provide
information to a user easily and effectively, the user may go looking elsewhere (George
2008).
2.2 How is usability measured?
It’s hard to measure usability and do it well
BUT IT CAN BE DONE (Chapanis 1991, p. 395).
As a concept with many definitions, there are many ways to measure and evaluate a
system’s usability. Discussions of the usability of a system are often concurrent with
design principles deal with testing, evaluation, and iteration (1985). Products or systems
that are methodically evaluated can meet user needs to a higher degree than those that are
not. Evaluating usability is important for designers in order to measure the success of
their work, important for manufacturers and salespeople to compare products to
competition, and important to customers in order to make smart buying decisions
(Chapanis 1991). Evaluating usability, however, is no simple task. Methods of evaluating
usability differ in their purpose and scope, and the goals of usability testing depend on the
methods being used as well (Nielsen & Mack 1994). Krug (2014) notes the complexity of
design and that “there is no ‘right’ answer to most usability questions” (p. 7), justifying
the need for many different methods for evaluating usability.
Measuring usability need not involve finished products necessarily. Whitefield, Wilson,
and Dowell (1991) give two separate dimensions for evaluating user interfaces – are your
users and systems real or representational? That is, are you using actual users with actual
systems, or are you using simulations or prototypes? While using real users and real
systems seems like the best choice, it may not always be feasible (Nielsen 1993).
Sometimes real users are difficult or impractical to get and expert reviewers have to take
their place, or sometimes prototypes of a potential system are tested in lieu of a finished
product (Nielsen 1993). Also, while there are empirical usability evaluation methods that
require some kind of participant, different usability evaluation methods can be
One of the stronger empirical method of usability evaluation can go by several different
names. This method involves users completing specific tasks using an interface while
saying what they are thinking to a moderator. It has been referred to as think-aloud or
user protocols (Nielsen 1993; Jordan 1998; Covey 2002), user testing (Nielsen 2012),
task-based testing (Kirkwood 2008a), or simply usability testing (George 2008; Lehman
2008a; Rogers, Sharpe, & Preece 2011; Schmidt & Etches 2012). Tasks are defined
ahead of time depending on the goals of the test. Users work with a moderator who walks
them through the test and encourages the user to speak. This style of usability testing can
get a lot of useful information out of only a few participants (Jordan 1998) – five
participants is the recommended minimum (Nielsen 2000). However, asking users to
think out loud while trying to complete a task, especially a complex one, can affect the
results by bringing an element of unnaturalness to the overall evaluation (Nielsen 1993,
Jordan 1998). Furthermore, while some conflate usability testing with think-aloud
protocols, other methods of usability testing may not ask participants to talk out loud.
Other empirical methods can include surveys or questionnaires (Jordan 1998; George
2008; Lehman 2008b), focus groups (Jordan 1998; Schmidt & Etches 2012), or simply
observing users in the field (Nielsen 1993; Jordan 1998).
Heuristic evaluation is a common non-empirical method of usability evaluation (Nielsen
1993; Nielsen 1994a; Dumas & Redish 1999; Rogers, Sharpe, & Preece 2011). Heuristics
are sets of broad principles, guidelines, or standards that are accepted by subject experts
a system without involving participants. In an analysis of 249 usability problems from 11
other experiments, Nielsen (1994b) developed a set of usability heuristics; the revised
heuristics are listed below (Nielsen 1995a):
Visibility of system status Recognition over recall
Match between system and real world Flexibility and efficiency of use
User control and freedom Aesthetic and minimalist design
Consistency and standards Users recognize, diagnose, and recover from errors
Error prevention Help and documentation
Other heuristics have been developed that somewhat align with Nielsen’s set. A set of
cognitive design principles was developed by Gerhardt-Powals (1996, p. 192-193):
Automate unwanted workload Group data consistently and meaningfully
Reduce uncertainty Limit data driven tasks
Fuse data Include only needed information
Present new information with
interpretation aids Provide multiple codings of data
Weinschenk & Barker compiled work from multiple authors to construct a noticeably
larger list, the “20 Laws of Interface Design” (2000, p. 184-185)
1. User Control 11. Technical Clarity
2. Human Limitations 12. Flexibility
3. Modal Integrity 13. Fulfillment
4. Accommodation 14. Cultural Propriety
5. Linguistic Clarity 15. Suitable Tempo
6. Aesthetic Integrity 16. Consistency
7. Simplicity 17. User Support
8. Predictability 18. Precision
9. Interpretation 19. Forgiveness
10. Accuracy 20. Responsiveness
Libraries may even develop their own internal heuristics for evaluation. Kirkwood
(2008b) presents heuristics from the University of Virginia Web Usability Team that
were adapted from Nielsen and organized into logical groups (p. 9-10).
Heuristic evaluation was developed by Nielsen and Mohlich (1990) as a way of
evaluators lack the expertise for formal evaluation. Guided by a set of heuristic standards,
a reviewer (or team of reviewers) evaluates a system based on how well the interface
follows the heuristic values established. Heuristic evaluation is typically conducted with
each evaluator reviewing an interface alone, then all reviewers comparing results and
aggregating an overall evaluation (Nielsen 1994a). In principle, there may be a single
reviewer conducting a heuristic evaluation, but adding one or more reviewers has been
found to drastically increase the number of problems found with minimal additional costs
(Nielsen 1993; Nielsen 1994a). It was found that a team of three to five reviewers guided
by a set of heuristics could identify 40% to 90% of usability problems on an interface
(Nielsen & Mohlich 1990).
Heuristic evaluation is a cheaper method of evaluation that can be conducted more
quickly than other methods, or when there is limited access to users (Wilson 2014). Tan,
Liu, and Bishu found that heuristic evaluation is useful for defining specific types of
problems compared to usability testing:
“Heuristic evaluation tends to cover more high-level structural problems and likely to address some of the root causes of these problems… while user testing is solely dependent on the pre-defined scenarios” (2009, p. 626).
Heuristic evaluations can also be competitive or comparative, where multiple sites that
are similar in function or theme are evaluated at once and compared for overall usability
2.3 Broad testing of library websites
There are many examples of usability testing and research conducted on single library
websites or products for individual universities, institutions, or vendors. There have also
been studies examining the Web practices of libraries. The results on these have been
mixed: Connell (2008) found that a minority of surveyed academic libraries from
randomly-selected institutions – 44% to 46.8% – had conducted usability testing, while
Chen, Germain, and Yang (2009) found that 85% of surveyed academic libraries had
conducted usability testing. Of the libraries conducting usability testing in the latter
study, Chen et al. found that heuristic evaluation (45%) and think-aloud (80%) were both
said to have been conducted (Table 12).
There have been a small number of broader evaluations of library websites as a similar
group of systems. Solomon (2005) used a checklist of 61 usability guidelines to evaluate
a total of 211 websites for public libraries in Ohio. Important features such as privacy
policies and site searches were missing from these sites, and a total of 35 (17%) Ohio
public library websites scored 80% higher or better, representing an overall lack in
usability. A review of 111 academic library websites distinguished common design
patterns, such as columns by category and four equally divided sections with sidebars, as
well as major content elements among sites, among them searching by format, website
A-Z, or contact us pages (Liu 2008).
A large heuristic evaluation of 1,469 academic and public library websites across the
evaluated based on the Library Website Checklist (LWUC) that was created for the study,
comprising of 67 questions meant to evaluate the design and usability of library website
and divided into 5 sections —site information, recommended site features, content,
feature placement, and recommended architecture and usability factors. The researchers
also gathered 1,266 responses from a widely-circulated library website survey to
academic and public librarians in the US. The study found that most academic and public
library websites were clean and uncluttered, and that most of these websites contained
consistently similar types of content. Library websites were often maintained by
librarians as part of their job (50%), and usability was not a regular part of library website
design (72%). Websites were selected randomly from a sample of libraries from each
state and the District of Columbia – 1 rural public library, 1 urban public library, 1
private university, and 1 public university.
2.4 Evaluating public library websites (PLWs) in North Carolina
Review of the relevant literature exposes a gap in the evaluation of public library
websites. Few studies exist that examine the usability of public library websites
specifically, and fewer do so on a large scale using heuristic evaluation or any other
usability evaluation method. There is certainly no study doing broad usability evaluation
of public library websites in the specific locale of North Carolina. The study by Chow et
al. (2014) represents a very small sample size of the total public library websites that can
The State Library of North Carolina lists 80 public library websites on its own website
(Public libraries in North Carolina), meaning that this previous heuristic evaluation
accounts for 2 of the at least 80 (2.5%) North Carolina public library websites. The State
Library listing of public library websites will be used as the canonical source for a
heuristic evaluation of public library websites in North Carolina. Focusing an evaluation
on a specific jurisdictional area can provide a clearer picture of the state of public library
website usability for a small, more easily definable set of systems, as well as serve as a
launch pad for adjustments and further research to enhance the usability of public library
3.
Methods
Heuristic evaluation is typically conducted by evaluators examining a site for extended
periods of time – one to two hours – while comparing the site’s design and use to what is
recommended by a set of heuristic guidelines. The output of this kind of heuristic
analysis is a list of usability problems with references to which usability principles were
violated in the opinion of the evaluator (Nielsen 1995b).
To ensure that a broad evaluation of many PLWs could be conducted in a short span of
time, this heuristic evaluation was operationalized in the form of a questionnaire
developed from a set of well-cited heuristics for system usability. This questionnaire was
created to make the heuristic evaluation of 80 websites go much faster than a normal
heuristic evaluation of that size, and to produce results that could reflect the extent to
which basic usability heuristics are followed by the set of evaluated websites.
The Public Library Website Questionnaire (PLWQ) was developed for this study to serve
as the questionnaire for evaluation. The PLWQ is made up of simple yes/no style
questions that ask if a specific website meets a certain criterion. These criteria are based
Collected data are the responses to these questions (criterion scores) as they pertain to
each PLW in North Carolina. The responses to each question were coded using an ordinal
scale indicating the extent to which the website meets a criterion.
0 = The website does not meet the criterion
0.5 = The website meets the criterion only partially and/or further
evaluation is needed
1 = The website meets the criterion
The set of heuristics for system usability that were used to create the PLWQ come from
Nielsen (1995a).
3.1 Public Library Website Questionnaire (PLWQ)
The Public Library Website Questionnaire (PLWQ) is a list of 12 questions based on
Nielsen’s 10 usability heuristics (1995a) created for this study. Several drafts of the
PLWQ were created before settling on the final version below. Questions were re-worked
until a relative “balance” of accounting for each of the 10 usability equally was achieved.
The final list of PLWQ questions used for this study are as follows:
1. Does the system provide appropriate feedback on the user's location within the
system?
2. Does the system use familiar language?
4. Does the system provide a clear way to return from a vendor site?
5. Does the system follow platform conventions?
6. Does the system use layouts that are consistent and organized?
7. Does the system indicate clear functional elements (e.g. links)?
8. Does the system provide direct links to common library tasks?
9. Does the system avoid overburdening the user with information?
10. Does the system make library account login apparent?
11. Does the system make library contact information prominent?
12. Does the system provide information on library policy?
A relative balance of representation of usability heuristics is reflected in this list as each
usability heuristic is accounted for twice within these 12 questions. For each question
from the PLWQ, the following rationales and explanations are given.
Location feedback: The system should provide information about where the user is currently located, either within the navigation or on the page. This criterion reflects
visibility of system status.
Familiar language: The system should avoid made-up terms, e.g. Book-A-Rama, as well as specialized or opaque language. Familiar language matches user expectations and
prevents errors created by lack of clarity. This criterion reflects match between system
Home link: The system should provide fail-safe “emergency exits” as well as ways to backtrack to maintain a sense of control and method of recovery for users. This criterion
reflects user control and freedom as well as users recognize, diagnose, and recover from
errors.
Vendor return: The system should provide a clear method to return to the library’s website from the library vendor site to maintain a sense of control for users. This criterion
reflects user control and freedom.
Platform conventions: The system should follow the basic conventions of modern desktop website design and not attempt to “reinvent the wheel.” This means websites
should not be too outdated nor too innovative to be obvious to use. This criterion reflects
consistency and standards.
Consistent layout: The system should be consistent in how content is displayed, and
content should be displayed logically. This criterion reflects consistency and standards as
well as aesthetic and minimalist design.
Functional elements: The system should make functional elements appear different from others so users can recognize potential actions. This prevents errors such as accidental
selection of unwanted options and provides input on interactivity status. This criterion
Common tasks: The system should provide links to common tasks for returning users to
recognize in some way. This criterion reflects flexibility and efficiency or use as well as
recognition over recall.
Overburdening users: If the system contains irrelevant or superfluous elements, the user
can experience overload. This criterion reflects aesthetic and minimalist design.
Apparent login: The system should allow direct access to library accounts for renewals, fees, etc. This is useful for returning library users and matches expectations for library
websites to provide such a service. This criterion reflects flexibility and efficiency of use
as well as match between the system and the real world.
Prominent contact: The system should provide contact information of librarians as this is the most direct form of help possible. If the user becomes lost or confused contact
information will be a last-resort recovery option. This criterion reflects help and
documentation as well as users recognize, diagnose, and recover from errors.
Library policies: The system should inform users on library policy, operations, etc. to
document usage rules and answer common questions. This criterion reflects help and
3.2 Interpretation of results
The arithmetic mean of the 12 criterion scores for each question on the PLWQ was used
to generate the basic usability score for each PLW. This usability score was used to
determine the basic usability for each PLW in North Carolina. Importantly, this is not a
measure of attractiveness or if the site is ultimately “good,” but a measure of how well
the lowest standards for quality are met. The ordinal scale used in this study was designed
to output scores that could be used to predict the overall usability of a PLW by rating its
basic usability. This score can be used to determine the extent to which a PLW meets
basic usability heuristics. That is, if a PLW’s basic usability score is higher, it can be
predicted that a human evaluator would be able to determine that the site successfully
meets most usability heuristics upon further inspection. So then, the closer that a PLW’s
general usability score is to 1, the more likely it is that the site meets basic usability
guidelines as recommended by previous literature. The closer a score is to 0, the more
likely it is that the PLW fails to meet usability heuristics – it could be predicated that a
human evaluator would find more problems by conducting a deeper analysis of that
PLW.
After each general usability score for each PLW in North Carolina was determined, the
arithmetic mean of all 80 scores of all PLWs was calculated to determine the basic
usability score of 80 public library websites in North Carolina. Using this metric, the
extent to which PLWs in North Carolina meet basic usability guidelines can be discussed
The PLWQ was written to be as binary as possible. That is, for each question, a clear
answer of “yes” (1) or “no” (0) is possible. Aiming for binary scores was done to limit
the amount of ambiguity in PLWQ results. If a PLW only meets a question criterion
partially, or if more investigation would be needed to determine if a criterion has been
met, an answer of 0.5 is most appropriate. However, a majority of 0.5 scores pulls
evaluation of PLWs into ambiguity. The PLWQ was written and phrased precisely to
avoid this ambiguity and produce as clear results as possible while also allowing for
ambiguity when needed.
The distribution of criterion scores was used to determine if the PLWQ produced
ambiguous results. The mode criterion score from each evaluation was also used. Lack of
ambiguity as a result of 0.5 scores can be determined based on basic usability scores as
well. Any basic usability score with a 0.25 deviation from 0.5 is guaranteed a majority of
binary response, i.e. basic usability scores that are ≤0.250 or ≥0.750 are guaranteed to
have majority binary responses. Scores between 0.250 and 0.750 may have majority
binary responses but could also have majority 0.5 responses. For these, mode criterion
score is useful.
3.3 Evaluating each PLW
PLWs were evaluated in February 2016. A random set of 8 PLWs was evaluated first on
February 5, 2016 to prepare for inter-coding of results (see 3.5 Inter-coding). After
inter-coding was completed, the remaining 72 PLWs were evaluated in a random order from
Lo ca tio n fe ed ba ck Fa m ili ar la ng ua ge Ho me lin k Ve nd or re tu rn Pl atf or m co nv en tio ns Co ns ist en t la yo ut Func tiona l el em en ts Co m m on ta sk s Ov er bu rd en in g us er Ap pa re nt lo gin Pr om ine nt co
ntact Librar
y pol ic ie s AVG Da te
Iredell 0.5 1 1 1 1 1 1 1 1 1 1 1 0.958 5-Feb
Caswell 0.5 1 0.5 0.5 1 1 1 1 1 0.5 1 1 0.833 24-Feb
Randolph 1 1 1 0 1 0.5 1 0.5 0.5 0 0.5 0.5 0.625 21-Feb
Columbus 0 1 1 0 0 1 1 0.5 1 0 1 0.5 0.583 28-Feb
Each PLW was loaded and inspected for as long as it took to adequately answer every
question on the PLWQ. Evaluation time varied between PLWs. Total combined
evaluation time of all 80 PLWs listed on the North Carolina State Library website was
roughly 6 hours.
Not every single public library website in North Carolina was evaluated. Only those 80
PLWs listed on the North Carolina State Library website’s page on public library systems
in North Carolina (State Library of North Carolina) as of February 2016 were evaluated
for this study.
3.4 Equipment used
PLWs were loaded using the same Web browser on the same operating system. Using the
list of questions on the PLWQ, numbers were given as answers to each question
representing the extent to which the website met the question’s criteria according to the
ordinal scale previously discussed (1, 0.5, or 0).
Technical operations were important to consider. The usability of a given website can
on a larger desktop computer screen using a mouse but unusable on a smaller mobile
smartphone screen where the user must pinch and tap with their fingers.
Because this research question is concerned with “basic” usability guidelines in regard to
North Carolina PLWs, the most basic computer set-up for websites possible was used.
For computer set-ups, “basic” describes what is the most common or the most expected.
For operating systems of desktop personal computers (PCs), Windows 7 is the most basic
choice across users. Since June 2012 Windows 7 has had over 50% of global market
share on desktop PCs, and, in June 2015, the top competitor was Windows 8.1 with about
16% of global market share (StatCounter). From this it is safe to say that Windows 7 is an
appropriate operating system to assess basic usability of PLWs on personal computers.
As of July 2015, StatCounter reports that Google Chrome has the top market share in the
United States for web browsers with 38.6%, with Internet Explorer trailing with 24.32%
(Leading web browsers in the United States). Based on this, each PLW was evaluated on
a Windows 7 machine with Google Chrome using default settings.
3.5 Inter-coding
A separate impartial coder was used using a randomly-generated sample of 8 (10%)
PLWs to ensure the reliability of data collected. This coder had intermediate knowledge
of and experience with usability evaluation for the web, and received no personal or
The coder was presented with the PLWQ and give written instructions for answering
each question for the 8 websites using the 0-0.5-1 scale. Inter-coding took place on
February 17, 2016. The appendix of this document includes the list of responses from this
coder.
The original basic usability score of the entire sample was 0.685, while the coder’s basic
usability score was 0.792, resulting in a deviation of 0.107. The maximum deviation
between basic usability scores for individual PLWs was 0.250 for the McDowell and
Randolph systems.
Questions 5 and 8 from the PLWQ were noted specifically as being subject to
interpretation as compared to other questions by the coder. The low amount of deviation
of results provided enough reliability for the original scores to proceed with the
4.
Results
A total of 80 scores were generated using the PLWQ by calculating the arithmetic mean
of criterion scores for the 12 PLWQ questions, each being either 0, 0.5, or 1. These 80
scores were averaged using arithmetic mean to create a basic usability score for public
library websites in North Carolina. This evaluation resulted in a basic usability score of
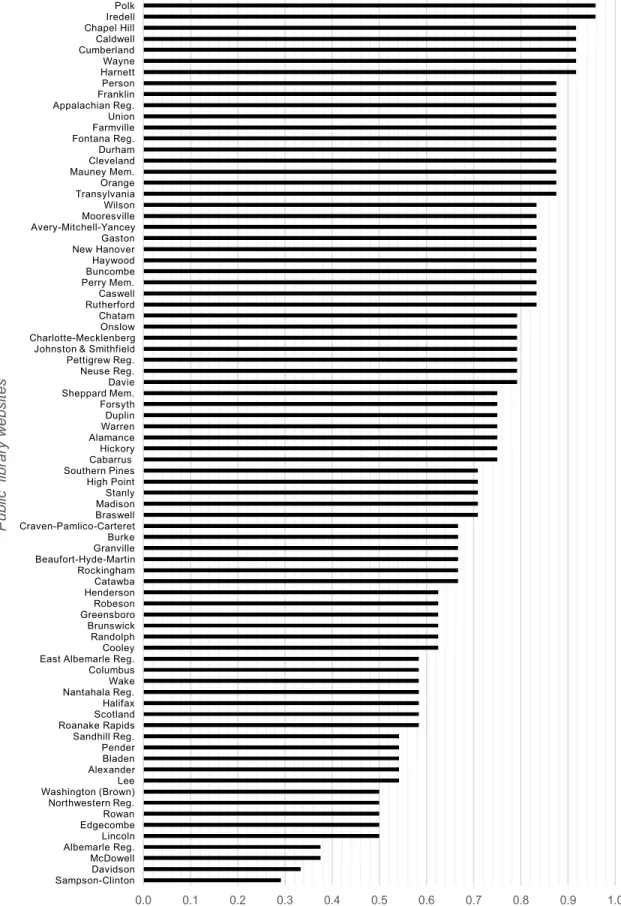
0.715 for North Carolina PLWs. Figure 1 shows basic usability scores for each North Carolina PLW evaluated.
Basic usability scores for PLWs ranged from 0.292 (Sampson-Clinton) to 0.958 (both
Polk and Iredell). For each question on the PLWQ, basic usability scores ranged from
0.469 (Does the system provide a clear way to return from a vendor site?) to 0.931 (Does
the system indicate clear functional elements (e.g. links)?). Figure 2 shows the average
basic usability scores for each question on the PLWQ.
Use of an ordinal scale resulted in a limited set of scores being possible, of which the
mode was 0.875 and the median was 0.750. In total, 15 unique scores for PLWs appeared
in results. Figure 3 shows the distribution of unique scores across all PLWs.
A full record of results, including individual criterion scores and basic usability scores for
0.0 0.1 0.2 0.3 0.4 0.5 0.6 0.7 0.8 0.9 1.0
Sampson-ClintonDavidson McDowell Albemarle Reg.Lincoln EdgecombeRowan Northwestern Reg. Washington (Brown)Lee AlexanderBladen Pender Sandhill Reg. Roanake RapidsScotland Halifax Nantahala Reg.Wake Columbus East Albemarle Reg.Cooley Randolph Brunswick GreensboroRobeson HendersonCatawba Rockingham Beaufort-Hyde-MartinGranville Burke Craven-Pamlico-Carteret BraswellMadison Stanly High Point Southern PinesCabarrus Hickory AlamanceWarren Duplin Forsyth Sheppard Mem.Davie Neuse Reg. Pettigrew Reg. Johnston & Smithfield Charlotte-MecklenbergOnslow Chatam RutherfordCaswell Perry Mem.Buncombe Haywood New HanoverGaston Avery-Mitchell-YanceyMooresville Wilson TransylvaniaOrange Mauney Mem.Cleveland Durham Fontana Reg.Farmville Union Appalachian Reg.Franklin Person HarnettWayne Cumberland Caldwell Chapel HillIredell Polk
Basic usability score
P ub lic li br ar y w eb si te s
Figure 2. Distribution of unique basic usability scores across all North Carolina PLWs
Figure 3. Average basic usability scores for every question on the PLWQ
0 2 4 6 8 10 12
0.292 0.333 0.375 0.500 0.542 0.583 0.625 0.667 0.708 0.750 0.792 0.833 0.875 0.917 0.958
Number of occurences
U n iq u e sco re s
Distribution of unique basic usability scores for NC PLWs
0.469 0.538 0.606 0.625 0.656 0.725 0.744 0.750 0.813 0.844 0.881 0.931
0.0 0.1 0.2 0.3 0.4 0.5 0.6 0.7 0.8 0.9 1.0
Vendor return Location feedback Common tasks Overburdening user Apparent login Familiar language Library policies Platform conventions Consistent layout Prominent contact Home link Functional elements
Average basic usability score
Average basic usability score for every question on PLWQ
A
ve
rage
0.
5.
Discussion
5.1 Basic usability of PLWs in North Carolina
Based on a score of 0.715, basic usability of public library websites in North Carolina
follows some, if not most, usability heuristics established in previous literature. A score
closer to 0.5 would have indicated that basic usability only meets heuristics partially and
more evaluation would be needed to make any claims about the extent North Carolina
PLWs meet usability heuristics. A score over 0.75 would have indicated that most
usability heuristics are met. The basic usability score for North Carolina PLWs rests
between 0.5 and 0.75, but is considerably closer to 0.75. Thus, most North Carolina
PLWs are more usable than unusable. A score of 0.715 indicates that North Carolina
PLWs meet some usability heuristics effectively, but not others. The basic usability is
generally acceptable based on the score, although a clearer understanding of the basic
usability of North Carolina PLWs likely requires more robust evaluation to indicate more
specific problem areas.
No PLW effectively met every criterion from the PLWQ. The highest ranking PLWs,
Polk and Iredell, received scores of 0.5 for Familiar language and Location feedback,
respectively. Even with a high score, a PLW can have usability problems that might
As shown in Figures 1 and 2, a majority of PLWs (42 or 53%) had basic usability scores
at or above 0.75, i.e. they were closer to 1 than to 0.5. These PLWs clearly met the
majority of PLWQ criteria and therefore a majority of usability heuristics based on this
study.
There were 29 (36.25%) PLWs with basic usability scores between 0.5 and 0.75. These
PLWs met some criteria while others were met partially or needed further evaluation to
determine their compliance with usability heuristics. The usability problems of these
PLWs may range in severity, but they are more usable and unusable.
There were 5 (6.25%) PLWs with basic usability scores of 0.5. Evaluation of these sites
is not possible based on these scores, as the site most criteria partially or there is more
evaluation needed to determine if criteria has been met.
A total of 4 (5%) PLWs had basic usability scores below 0.5. These were
Sampson-Clinton (0.292), Davidson (0.333), Albemarle (0.375), and McDowell (0.375). These
PLWs likely have usability problems that should be addressed to ensure that user needs
are met. No PLW scored below 0.25, meaning that no PLW had a basic usability score
closer to 0 than 0.5.
The basic usability of public library websites in North Carolina meets more industry
guidelines than it fails to meet, as indicated by a basic usability score of 0.715. The state
improvements that can be made, especially to those sites scoring lower than 0.5. Most
North Carolina PLWs are more usable than unusable.
5.2 Average basic usability scores of PLWQ questions
As shown in Figure 3, there were 5 PLWQ questions (42%) that averaged at least 0.75,
and thus leaned more toward a score of 1. These included Does the system provide
consistent links to home/top-level pages?, Does the system follow platform conventions?,
Does the system use layouts that are consistent and organized?, Does the system indicate
clear functional elements?, and Does the system make library contact information
prominent?. The majority of PLWs evaluated fully met these criteria.
Half of PLWQ questions (6 or 50%) had averages between 0.5 and 0.75, indicating that
PLWs met criteria, but perhaps only partially.
The PLWQ question Does the system provide a clear way to return from a vendor site?
was the only question that fell below the 0.5 threshold. Many North Carolina public
library websites did not offer a clear way to return to the site after navigating to a specific
library service provided by a vendor, and this criterion most negatively effected North
Carolina PLW usability.
These results suggest that most PLWQ criteria were met generally, but that
improvements can be made to each North Carolina PLW on at least one criteria, and that
criteria was met with critical failure from North Carolina PLWs, but opportunities for
improvement and/or further evaluation are revealed by these basic usability scores of
PLWQ questions.
Each PLWQ question accounted for multiple usability heuristics, and each usability
heuristic was reflected twice in the 12 PLWQ questions. By taking an average of every
basic usability score that reflects a given heuristic, the extent to which individual Nielsen
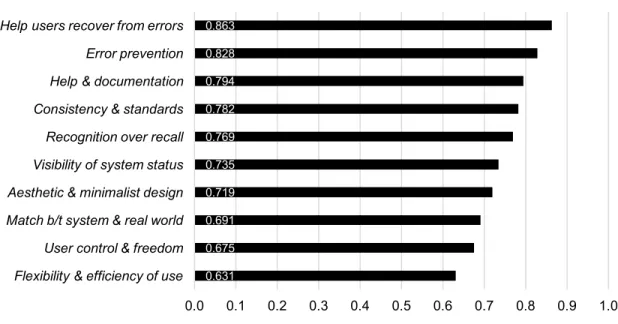
usability heuristics are respected by North Carolina PLWs can be determined. Figure 4
shows the average basic usability score for each of Nielsen’s 10 usability heuristics
(1995a).
Figure 4. Average basic usability scores for Nielsen’s 10 usability heuristics
0.631 0.675 0.691 0.719 0.735 0.769 0.782 0.794 0.828 0.863
0.0 0.1 0.2 0.3 0.4 0.5 0.6 0.7 0.8 0.9 1.0 Flexibility & efficiency of use
User control & freedom Match b/t system & real world Aesthetic & minimalist design Visibility of system status Recognition over recall Consistency & standards Help & documentation Error prevention Help users recover from errors
Average basic usability score
Each heuristic had two basic usability scores that were averaged, e.g. help users recover
from errors took 0.881 from PLWQ questions Home link and 0.844 from Prominent contact, averaged to make 0.863 as shown in Figure 4.
However, some PLWQ basic usability scores had more influence, as PLWQ questions
accounted for one to three heuristics. For example, the 0.744 score for Library policies
accounted for 1 heuristic – help & documentation – while the 0.963 score for Functional
elements accounted for three heuristics – recognition over recall, error prevention, and
visibility of system status – and had more influence on Figure 4 scores than other PLWQ
questions.
A more balanced heuristic questionnaire could ensure an equal amount of influence in
calculations like this one. Nevertheless, results from this study suggest that North
Carolina PLWs respect usability heuristics for the most part, but, similarly to PLWQ
criteria scores, opportunities for improvements and/or further evaluation are revealed by
these scores.
5.3 Effectiveness of the PLWQ in providing clear results
The effectiveness of the PLWQ is dependent on having non-ambiguous binary criterion
scores that can be used to predict the basic usability of PLWs, i.e. there should not be a
majority of 0.5 scores, as these would indicate only partial compliance and a need for
responses are clear indicators of heuristic compliance or noncompliance, i.e. 1 or 0,
respectively.
Figure 5. Distribution of criterion scores from PLWQ results
Figure 5 shows the distribution of criterion scores from PLWQ results. Indeed, most
scores were binary. The majority of responses were 1, while 0 and 0.5 had similar, much
smaller distributions. There were 177 (18% of the total 960 criterion scores) scores of 0.5
and 185 (19%) scores of 0. The majority of 1 scores (62%) indicates that the PLWQ used
in this study contained criteria that most PLWs were able to meet.
A total of 42 (52.5%) of basic usability scores were ≥0.750, meaning those scores are
guaranteed to have majority criterion scores of 1 and were not effected by ambiguous 0.5
scores. Looking at mode criterion scores furthers this: 70 PLWs (87.5%) had mode
185 177 598
0 100 200 300 400 500 600
0 0.5 1
O
ccu
re
n
ce
s
Criterion score
criterion scores of 1, while 8 (10%) had mode criterion scores of 0. There were 2 PLWs
(2.5%) had mode criterion scores of 0.5– Pender and Beaufort-Hyde-Martin – indicating
that evaluation of these PLWs is too ambiguous to make claims about basic usability;
more evaluation is needed on them.
The mode criterion score for all twelve PLWQ questions was either 1 or 0. There were 11
questions (91.6%) with a mode score of 1, and 1 question (8.3%), Vendor return, with a
mode score of 0. No PLWQ question had a mode score of 0.5.
Given each of these points about criterion scores, it does not seem that the PLWQ used
for this study produced ambiguous results for the most part. The PLWQ was mostly
effective in providing clear enough results to make claims about the basic usability of
North Carolina PLWs based on the PLWQ created for this study.
5.6 Limitations
This study produced some unusable results. There were a total of seven PLWs where
results must be thrown out. Of these, five are unusable because basic usability scores
were 0.500, and thus no claims can be made on the extent these PLWs meet usability
heuristics, as a score of 0.5 means criteria are met partially and/or further evaluation is
needed. These were Lincoln, Edgecombe, Rowan, Northwestern Regional, and
Washington (Brown). There were two PLWs with basic usability scores above 0.500, but
with mode criterion scores of 0.5, again indicating that no claims can be made on the
(8.8%) PLWs are only usable in determining what individual criteria are met or not met
from the PLWQ, i.e. which PLWQ questions received a 1 or 0.
The PLWQ used in this study is not diagnostic. It cannot point to specific usability
problems on a site. It can only reflect the extent that a PLW meets a given criterion in the
opinion of the evaluator, since heuristic evaluation is, by definition, subjective (Nielsen
1994b). For a more diagnostic report of usability problems, an individual usability
evaluation (such as think-aloud testing) is more suitable. Librarians can use the criterion
scores from PLWQ results to get a sense of how well a PLW meets certain criteria, but
this again only reflects the evaluator’s opinion and does not provide the salient feedback
that user-centered testing can provide.
The PLWQ used in this study did not consider severity of different criteria. Some criteria
may have more of an impact on the basic usability than others. The PLWQ used for this
study is not able to capture difference in severity, as all criteria are weighed as having the
exact same impact on usability. The PLWQ for this study also was not completely
balanced, as some PLWQ questions accounted for more heuristics than others and thus
carried more weight in the usability evaluation.
A usability questionnaire for broad testing could incorporate more heuristics than just
those from Nielsen. Usability questionnaires can also be more balanced so that heuristics
are evenly distributed across questions, and so questions are perhaps given different
likely due to limited time and manpower available for the study, as fixing these limits
would likely result in longer questionnaires and therefore longer evaluation and analysis
time.
5.4 Future actions from North Carolina librarians
Further evaluation of individual North Carolina PLWs would point to specific usability
problems and be more diagnostic than evaluation with the PLWQ. This study provides a
handy list of which North Carolina PLWs are most in need of individual usability
evaluation, i.e. those PLWs with low basic usability scores. North Carolina librarians
should use PLWQ results as a message of how dire usability evaluation is for their
website as of this study.
There may be top-level decision-making that can aid in enhancing usability across PLWs.
For example, a state-created Web template that follows basic usability heuristics and is
customizable would give public librarians an option for their website that might prove
more useful than vendor-created options or even in-house options for Web management.
Such a template would ensure that all North Carolina public library websites have a
functional, usable design that meets bare minimum guidelines for usability.
Usability and user-centered design are not historically concepts found in the public
library sector. PLWs that markedly lower scores might have been designed by librarians
should be given; librarians are likely in need of training of Web management in general.
This study opens up the opportunity for more librarians to get involved with
user-centered design work, or perhaps the opportunity for more usability/user experience
6.
Conclusions
6.1 Future work
Future studies include conducting the same evaluation on the PLWs in North Carolina
not covered by this study as well as the same evaluation on another state or large locale.
The method of using a questionnaire for broad usability heuristic evaluation can also be
furthered and possibly improved. Conducting more standard heuristic evaluations on
many sites and comparing outcomes to that those of a broad heuristic questionnaire
would investigate how well heuristic questionnaires match insights gained from more
time-consuming methods of heuristic evaluation. Furthermore, conducting a think-aloud
usability test and comparing outcomes to that of a heuristic questionnaire would
investigate which usability problems heuristic questionnaires can reflect and which they
cannot. Finally, development and comparison of different usability heuristic
questionnaires would investigate effectiveness of questions and phrasing in finding
usability problems.
6.2 Conclusion
This study contributes to the small amount of literature on usability of public library
websites as well as literature on the usability of PLWs of a specific locale. This study fills
the previous gap formed by the lack of research on broad usability evaluation of North
would take to individually evaluate the same amount of sites using other methods. This
study and its results act as a launch pad for future work, especially in regard to enhancing
the usability of North Carolina public library websites, but also in usability evaluation of
for locale PLWs or in non-library websites and products.
The PLWQ was successful in providing clear results that can be used for effective
usability evaluation, for the most part. Of the 80 PLWs evaluated, 91.2% of results are
usable in determining how well a PLW meets criteria for usability heuristics. Most of the
twelve PLWQ questions (7 or 58.33%) fell between 0.25 and 0.75, and thus did not
provide as clear answers in how well North Carolina PLWs meet basic usability
heuristics than the other five questions. Reworking of future usability heuristic
questionnaires should aim for stronger binary results.
In general, North Carolina PLWs meet usability heuristics to a reasonable extent. The
lack of a clear return path to a PLW from a vendor-created site had the most negative
impact on North Carolina PLW usability. PLWs ranged in the extent that they met
PLWQ criteria and thus usability heuristics, and no PLW ultimately met all criteria
completely, as the highest basic usability score was 0.958. Some PLWs fell below the 0.5
threshold and are in more need of improvement and/or further evaluation than others. No
North Carolina PLW basic usability score fell below 0.25. Most North Carolina PLWs
Bibliography
Aharony, N. (2012). An analysis of american academic libraries' websites: 2000-‐2010.
The Electronic Library, 30(6), 764-776. doi:10.1108/02640471211282091
Brower, S. M. (2004). Academic health sciences library website navigation: An analysis
of forty-one websites and their navigation tools. Journal of the Medical Library
Association, 92(4), 412-420.
Chapanis, A. (1991). Evaluating usability. In B. Shackel, & S. J. Richardson (Eds.),
Human factors for informatics usability (pp. 359-395). Cambridge: Cambridge
University Press.
Chen, Y., Germain, C. A., & Yang, H. (2009). An exploration into the practices of library
web usability in ARL academic libraries. Journal of the American Society for
Information Science and Technology, 60(5), 953-968. doi:10.1002/asi.21032
Chow, A., Bridges, M., & Commander, P. (2014). The website design and usability of
US academic and public libraries findings from a nationwide study. Reference & User
Connell, R. S. (2008). Survey of web developers in academic libraries. The Journal of
Academic Librarianship, 34(2), 121; 121-129; 129.
Covey, D. T. (2002). Usage and usability assessment : Library practices and concerns.
Washington, D.C.: Digital Library Federation, Council on Library and Information
Resources.
Davidsen, S. & Yankee E., (2004). Web site design with the patron in min : A
step-by-step guide for libraries. Chicago: American Library Association.
Garlock, K. L. & Piontek S. (1999). Designing web interfaces to library services and
resources. Chicago: American Library Association.
Gerhardt-Powals, J. (1996). Cognitive engineering principles for enhancing
human-computer performance. International Journal of Human-Computer Interaction, 8(2), 189.
George, C. A. (2008). User-centred library websites: Usability evaluation methods.
Oxford: Chandos.
Gould, J. D., & Lewis, C. (1985). Designing for usability: Key principles and what
ISO/TC. (1998). Ergonomic requirements for office work with visual display terminals
(VDTs) — Part 11: Guidance on usability. Retrieved September 19, 2015, from
https://www.iso.org/obp/ui/#iso:std:iso:9241:-11:ed-1:v1:en
Jordan, P. W. (1998). An introduction to usability. London; Bristol, Pa.: Taylor &
Francis.
Kirkwood Jr., H. P. (2008a). Usability case study: Purdue university libraries. In T.
Lehman, & T. Nikkel (Eds.), Making library web sites usable : A LITA guide (pp.
107-111). New York: Neal-Schuman Publishers.
Kirkwood Jr., H. P. (2008b). Heuristics. In T. Lehman, & T. Nikkel (Eds.), Making
library web sites usable : A LITA guide (pp. 7-18). New York: Neal-Schuman Publishers.
Krug, S. (2014). Don't make me think, revisited: A common sense approach to web
usability. Berkeley, Calif.: New Riders.
Lehman, T. (2008a). Usability testing. In T. Lehman, & T. Nikkel (Eds.), Making library
web sites usable : A LITA guide (pp. 53-60). New York: Neal-Schuman Publishers.
Lehman, T. (2008b). Surveys. In T. Lehman, & T. Nikkel (Eds.), Making library web
Liu, S. (2008). Engaging users: The future of academic library web sites. College &
Research Libraries, 69(1), 6-27. doi:10.5860/crl.69.1.6
McGillis, L., & Toms, E. G. (2001). Usability of the academic library web site:
Implications for design. College & Research Libraries, 62(4), 355-367.
doi:10.5860/crl.62.4.355
Nielsen, J. (1993). Usability engineering. Cambridge, MA: Academic Press, Inc.
Nielsen, J. (1994a). Heuristic evaluation. In J. Nielsen, & R. L. Mack (Eds.), Usability
inspection methods (pp. 25-62). New York: John Wiley & Sons.
Nielsen, J. (1994b). Enhancing the explanatory power of usability heuristics. Boston,
Massachusetts, USA: ACM.
Nielsen, J. (1995a). 10 usability heuristics for user interface design. Retrieved September
30, 2015, from http://www.nngroup.com/articles/ten-usability-heuristics/
Nielsen, J. (1995b). How to conduct a heuristic evaluation. Retrieved September 30,
2015, from http://www.nngroup.com/articles/how-to-conduct-a-heuristic-evaluation/
Nielsen, J. (2000). Why you only need to test with 5 users. Retrieved August 17, 2015,
Nielsen, J. (2012). Usability 101: Introduction to usability. Retrieved September 21,
2015, from http://www.nngroup.com/articles/usability-101-introduction-to-usability/
Nielsen, J., & Mack, R. L. (1994). Executive summary. In J. Nielsen, & R. L. Mack
(Eds.), Usability inspection methods (pp. 1-23). New York: John Wiley & Sons.
Nielsen, J., & Molich, R. (1990). Heuristic evaluation of user interfaces. Seattle,
Washington, USA: ACM.
Norlin, E. & Winters C. (2002). Usability testing for library web sites: A hands-on guide.
Chicago: American Library Association.
Rogers, Y., Sharp, H., & Preece, J. (2011). Interaction design: Beyond human-computer
interaction (3rd ed.). Chichester, West Sussex: Wiley.
Rubin, J. (1994). Handbook of usability testing : How to plan, design, and conduct
effective tests. Wiley Pub.
Schmidt, A., & Etches, A. (2012). User experience (UX) design for libraries. Chicago:
Shackel, B. (1991). Usability -- context, framework, definition, design and evaluation. In
B. Shackel, & S. J. Richardson (Eds.), Human factors for informatics usability (pp.
21-37). Cambridge: Cambridge University Press.
Solomon, L. (2005). Swimming or sinking?: The state of web sites in Ohio’s public
libraries. Retrieved September 15, 2015, from
http://www.designforthelittleguy.com/study.pdf
StatCounter. (n.d.). Global market share held by operating systems Desktop PCs from
January 2012 to June 2015. In Statista - The Statistics Portal. Retrieved October 07,
2015, from
http://www.statista.com.libproxy.lib.unc.edu/statistics/218089/global-market-share-of-windows-7/.
StatCounter. (n.d.). Market share held by the leading web browsers in the United States
from January 2012 to July 2015. In Statista - The Statistics Portal. Retrieved October 08,
2015, from
http://www.statista.com/statistics/272697/market-share-held-by-web-browsers-in-the-united-states-since-2009/.
State Library of North Carolina. Public libraries in North Carolina. Retrieved September
22, 2015, from http://statelibrary.ncdcr.gov/ld/aboutlibraries/public.html
Tan, W., Liu, D., & Bishu, R. (2009). Web evaluation: Heuristic evaluation vs. user
Weinschenk, S., & Barker, D. T. (2000). Designing effective speech interfaces. New
York: J. Wiley.
Whitefield, A., Wilson, F., & Dowell, J. (1991). Evaluating interactive computer
systems: A framework for human factors evaluation. Behaviour & Information
Technology, 10(1), 65-79.
Wilson, C. (2014). User interface inspection methods: A user-centered design method.
Appendix
PLWQ criterion scores
Locat ion fe e d b a ck Fam iliar la n g u a g e Ho m e lin k Ve n d o r re tu rn Pl a tfo rm convent ions Co n sis te n t la yo u t Func tional el em ent s Co m m o n ta sk s Ov e rb u rd e n i ng user Ap p a re n t lo g in Pr o m in e n t cont act Li br ar y pol ici es AVG Da te
Iredell 0.5 1 1 1 1 1 1 1 1 1 1 1 0.958 5-
Feb
Polk 1 0.5 1 1 1 1 1 1 1 1 1 1 0.958 25-
Feb
Harnett 1 1 1 0.5 0.5 1 1 1 1 1 1 1 0.917 Feb 24-
Wayne 0.5 0.5 1 1 1 1 1 1 1 1 1 1 0.917 Feb 25-
Cumberland 0.5 1 1 1 1 1 1 1 0.5 1 1 1 0.917 27-
Feb
Caldwell 1 0 1 1 1 1 1 1 1 1 1 1 0.917 27-
Feb
Chapel Hill 0 1 1 1 1 1 1 1 1 1 1 1 0.917 27-
Feb
Transylvania 0 1 0.5 1 1 1 1 1 1 1 1 1 0.875 5-
Feb
Orange 0.5 1 0.5 0.5 1 1 1 1 1 1 1 1 0.875 Feb 21-
Mauney
Mem. 0.5 1 1 0 1 1 1 1 1 1 1 1 0.875 Feb 24-
Cleveland 1 1 1 0 1 1 1 1 1 1 1 0.5 0.875 Feb 24-
Durham 0.5 0.5 1 1 1 1 1 0.5 1 1 1 1 0.875 Feb 27-
Fontana
Reg. 0 1 1 1 1 1 1 1 0.5 1 1 1 0.875 Feb 27-
Farmville 1 0.5 1 0.5 1 1 1 0.5 1 1 1 1 0.875 27-
Feb
Union 0 0.5 1 1 1 1 1 1 1 1 1 1 0.875 27-
Feb Appalachian
Reg. 0 1 1 1 1 1 1 0.5 1 1 1 1 0.875 Feb 28-
Franklin 1 1 1 1 1 1 1 0.5 0 1 1 1 0.875 Feb 28-
Person 1 1 1 0 1 1 1 0.5 1 1 1 1 0.875 28-
Feb
Rutherford 1 1 1 0 1 1 1 1 0 1 1 1 0.833 21-
Feb
Caswell 0.5 1 0.5 0.5 1 1 1 1 1 0.5 1 1 0.833 24-
Feb
Perry Mem. 1 0.5 1 1 1 0.5 1 0 1 1 1 1 0.833 24-
Feb
Buncombe 1 0.5 1 1 1 1 1 0.5 1 1 1 0 0.833 Feb 25-
Haywood 1 1 1 1 0.5 0.5 1 1 0.5 1 1 0.5 0.833 Feb 27-
New
Hanover 0 1 1 0.5 0.5 1 1 1 1 1 1 1 0.833 Feb 27-
Gaston 0.5 1 1 0 1 1 1 0.5 1 1 1 1 0.833 Feb 27-
Avery- Mitchell-
Yancey 0 1 1 1 0.5 1 1 0.5 1 1 1 1 0.833
27- Feb
Mooresville 0.5 1 0.5 1 1 1 1 1 1 0.5 1 0.5 0.833 28-
Feb
Wilson 0 1 1 1 0.5 1 1 1 1 1 1 0.5 0.833 Feb 28-
Davie 0.5 1 0.5 0 1 1 1 1 0.5 1 1 1 0.792 5-
Feb
Neuse Reg. 1 0.5 1 0 1 1 1 1 1 0 1 1 0.792 21-
Feb Pettigrew