A Surface Low Energy Characterization Technique for
High Purity Germanium Detectors
Tom Caldwell, Dustin Combs, Zach Hainsel, Rachel Gray, Matt Green,
Reyco Henning, Samantha Pagan, Anna Reine
April 11, 2019
Abstract
The MAJORANADEMONSTRATOR is an array of natural and enriched P-type point contact germanium detectors located in the Sanford Underground Research Facility in Lead, South Dakota. Its primary goal is to search for the neutrinoless double-beta decay of the 76Ge isotope, which would produce an excess of events at the Q-value of 2039 keV. Extreme measures have been taken in the DEMONSTRATOR to reduce background in the region of interest and increase the sensitivity to this signal. Low detector thresholds allowed the collaboration to also develop a low energy program focused on light WIMP and axion searches. Low energy characterization of detectors is essential for these searches. Due to a high background of events at the surface of the Earth, low energy characterizations must typically be completed underground. This study explores a low energy characterization technique that could be performed at the surface of the Earth reliant on low energy Compton scattering events. A radioactive source along with a primary and a backing detector operated in coincidence were utilized for this technique. The results of this study qualitatively demonstrated the generation of a population of low energy events in the primary detector, which could be used for low energy characterizations. Overall, this study confirmed the potential of this method to be developed to perform surface low energy characterizations.
1
Background
1.1
Neutrinoless Double-Beta Decay
Many properties of neutrinos are unique, such as having the lowest mass of all funda-mental particles and being the only electrically neutral fermion [15]. Additionally, lepton number is the single quantum number to distinguish ν and ν. Lacking a gauge symmetry that requires lepton number conservation in neutrinos, it is possible—and even required in some Grand Unifying Theories—that lepton number is not conserved. The violation of lep-ton number conservation in neutrinos would enable ν and ν to be indistinguishable. The primary goal of an extensive search effort for a process known as neutrinoless double-beta decay (0νββ) is to investigate this possibility [15].
A related process—two neutrino double-beta decay—is allowed in the Standard Model and observed in many isotopes [15]. This decay follows the form [6]:
N(Z, A)→N(Z+ 2, A) + 2e−+ 2νe. (1)
In two neutrino double-beta decay, lepton number is conserved. Neutrinoless double-beta de-cay is a theorized process in which two beta dede-cays would occur without producing neutrinos. The equation for this decay follows [7]:
N(Z, A)→N(Z+ 2, A) + 2e−. (2)
Figure 1: Possible Feynman diagrams of two neutrino double-beta decay (left) and neutrinoless double-beta decay (right) [12].
potential reason for the observable excess of matter over antimatter in the universe [10]. Beyond discovering if neutrinos are majorana particles, the half-life of 0νββ decay could determine the absolute neutrino mass scale [11].
To observe this rare process, 0νββ experiments must achieve low backgrounds, obtain large exposures, and identify a clear signal to detect [15]. Though colliders can study lep-ton number violating processes that may underlie 0νββ, direct searches must be used to determine if the neutrino is a majorana particle without model dependence [12]. Isotopes of significant experimental interest, where neutrinoless double-beta decay is predicted to occur, include130Te, 136Xe, and76Ge [15]. Experiments such as SNO+, nEXO, and the MAJORANA
DEMONSTRATOR aim to search for 0νββ in these isotopes respectively [15] [12].
If it occurs, the primary obstacle to detecting 0νββ is its rarity in nature. The current limit on the half-life of neutrinoless double-beta decay for76Ge is 8.0×1025years [17]—many magnitudes above the age of the 13×109 year-old universe.
1.2
Bosonic Dark Matter Searches
In addition to the elusive neutrino, the nature of dark matter is another mystery of the uni-verse. Astronomical observation of galaxies, clusters, and the Cosmic Microwave Background radiation have led astronomers to theorize that the universe is composed of approximately 5 % matter, 27% dark matter, and 68% dark energy [19]. Measurements of the Cosmic Microwave Background and primordial isotopic abundances require that dark matter be non-baryonic. Dark matter must interact weakly with ordinary matter and be stable at cos-mological timescales, though its exact composition is still unknown [18]. Well-motivated dark matter candidates include new elementary particles: axions and weakly interacting massive particles (WIMPs) [18]. In addition to investigating question concerning neutrinos—by the nature of their low backgrounds and high energy resolutions at low energies—many 0νββ
experiments can search for dark matter.
Axions are dark matter candidates that also explain CP violation in the strong force [20] [18]. Axions are a generic feature in many string theories. This relies on an extremely weak coupling of axions to two photons—making the decay lifetime of an axion much longer than the age of the universe [18]. However, axions-photon conversion can occur in external electric or magnetic fields, which is the mechanism that many axion experiments utilize. ADMX is one leading experiment directly searching for axions [18] [21].
can also perform light WIMP searches.
2
The M
AJORANAD
EMONSTRATOR2.1
Background
Because of its germanium detector technology, the MAJORANADEMONSTRATORcan investigate
both neutrinoless double-beta decay and dark matter. The DEMONSTRATOR is primarily
searching for 0νββ in76Ge, and has an additional low energy program focused on axion and
WIMP searches.
The DEMONSTRATOR is an array of natural and enriched76Ge P-type point-contact
detec-tors located 4850 feet underground in the Sanford Underground Research Facility in Lead, South Dakota. In 76Ge, neutrinoless double-beta decay would produce an excess of events
at the Q-value of 2039 keV [8]. This signal is shown in Figure 2.
Figure 2: Signal of nuetrinoless double-beta decay at the summed Q-value for HPGe detectors [8].
In the DEMONSTRATOR, extreme fabrication and operation measures were taken to
re-duce background in the region of interest and increase the sensitivity of this signal. The DEMONSTRATOR achieved an energy resolution of 2.52 ± 0.08 keV at full width half
max-imum (FWHM) at 2039 keV. This is the best resolution of any neutrinoless double-beta decay experiment [28]. After analysis cuts, the background goal of the DEMONSTRATORis 2.5
counts/(FWHM t yr). A background of 11.9 ± 2.0 counts/(FWHM t yr) has been reached from current data [27]. While the DEMONSTRATOR is comprised of 44.1 kg of Ge detectors,
achievement of a low enough background is intended to justify scaling up the DEMONSTRATOR
to a tonne of germanium detectors. MAJORANA has merged with the GERDA experiment—
Figure 3: A diagram of the MAJORANADEMONSTRATOR [8]. The array of Ge detectors is
shown surrounded by an inner and outer copper shield as well as veto panels and a poly shield.
The MAJORANA DEMONSTRATOR uses P-Type point-contact detectors to achieve a high
energy resolution with low energy thresholds [28]. This geometry enables the use of pulse shape analysis, which can help identify interaction types and locations within the detector. The DEMONSTRATOR currently contains 44.1kg of 76Ge detectors with 29.7 kg of 88.1 ± .7%
enriched 76Ge crystals, and 14.4 kg of natural 76Ge crystals [28]. The geometry of the
natural and enriched detectors vary slightly. This difference is shown in Figure 4. The natural detectors have a larger P-Type Point contact and smaller passivated surface than the enriched detector. Especially with differences in geometry, characterization of detectors is vital. Due to a lack of low energy sources and techniques, characterization of low energy responses of the detector has proved to be a challenge.
Figure 4: The two types of P-type point contact detectors used in the DEMONSTRATOR.
The differences in geometry can be seen between the natural BEGe-style detectors and the enriched ORTEC-style detectors. The figure is drawn to an approximate scale [13].
2.2
The Low Energy Program
The Germanium detectors in the MAJORANA DEMONSTRATOR have low energy thresholds of
approximately 500 eV [9]. These low thresholds have allowed the development of the low-energy investigations using the DEMONSTRATOR. The low energy program will be able to search
for light WIMPs, solar axions, and Pauli Exclusion principle violating decays (PEPVs) [9]. In particular, the P-type point contact detectors have been shown to be useful tools for directly detecting light WIMPs—dark matter less than 10 GeV/c2 [9]. It is predicted that
3
Experimental Motivation
Due to its low energy program, the MAJORANA collaboration is especially interested in the
characterization of detectors at low energy for a variety of applications. Low energy char-acterizations must generally be performed deep underground to provide sufficient shielding from a high background of surface events. Low energy gamma sources cannot penetrate the dead layers of the germanium crystals or the cryostat. This makes external calibrations with low energy sources impossible. Internal activation sources are too rare and would be prob-lematic for backgrounds in characterizations. These factors make low energy calibrations— particularly at the surface of the Earth—difficult to perform.
This project aims to begin the development of a low energy characterization technique that can be performed at the surface of the Earth. This method uses a radioactive source and array of detectors to generate a population of low energy events. In addition to MAJORANA,
the LEGEND and COHERENT collaborations are also interested in detectors’ low energy responses and could utilize a related method for their characterizations [25].
Furthermore, this study will be informative to the analysis of the MAJORANAcollaboration.
Their current calibration method relies on the fundamental mechanism of low angle Compton scattering used in this characterization technique. This project will check the validity of this technique.
3.1
Theory of Compton Scattering
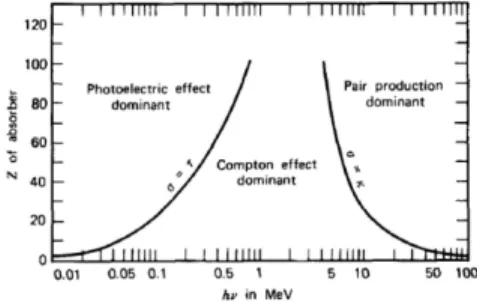
Gamma rays can interact with material due to a variety of mechanisms, and the dominant process depends on the atomic number of the absorber and the energy of the gamma ray [32]. Figure 5 displays this dependence. Compton scattering is the predominant interaction mechanism in 76Ge for absorbing gamma rays on the scale of .5 MeV to 1.5 MeV. This
energy range corresponds to the gamma rays produced by the 22Na source used in this
experiment [32].
Figure 5: The dominant mechanism by which gamma rays interact with an absorber is controlled by the atomic number of the absorber and the energy of the gamma ray. This
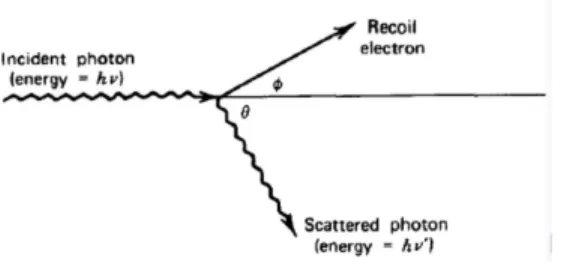
Figure 6: In Compton scattering an incident photon interacts with an electron in an absorber material. In this interaction, energy is transferred and the electron and scattered
photon continue traversing deflected paths. [32].
The energy transferred in Compton scattering is angle dependent, and all scattering angles are possible. This allows for a range of energies to be exchanged in the process. From relativistic kinematics, the energy lost by the scattered photon as a function of its scattering angle is expressed as [34]:
E0 = E 1 + mE
ec2(1−cosθ)
. (3)
This distribution is plotted in Figure 7. From this distribution, it is clear that small angle Compton scatters will produce low energy deposits in the scattering material.
Figure 7: The distribution of electron recoil energy in Compton scattering as a function of scattering angle [32].
The experimental configuration of this study is reliant on measuring low angle Compton scattering events through the coincidence of detectors. In these coincident cases, a gamma ray that scattered on an initial primary detector would maintain most of its energy and continue on a slightly deflected path towards a backing detector, where it would deposit its remaining energy. Thus, the sum of the coincident energies measured in both detectors would equal the energy of the original incident gamma ray.
4
Experimental Set up
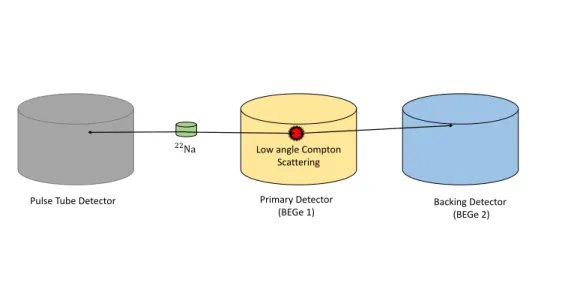
cryostat that was cooled with a pulse tube cooler. This detector was readout using custom MAJORANA front-end electronics. BEGe 1 was a commercial BEGe detector with a resistive
feedback pre-amp. BEGe 2 was the same as BEGe 1 but with a pulse-reset pre-amp.
Primary Detector
(BEGe 1) Backing Detector (BEGe 2) Pulse Tube Detector
22Na Low angle Compton
Scattering
Figure 8: The experimental setup showing the placement of the detectors and the radioactive source
The 22Na source used was 10µCi and two years old. The decay diagram of22Na is shown in Figure 10.
From this source, two 511 keV photons were produced from annihilation radiation after the positron emission of 22Na [32]. The covering on the source was assumed to be sufficient to stop all positrons and cause this annihilation radiation. Additionally, 22Na produces a
1274.5 keV gamma ray. The 511 keV and 1274.5 keV gamma rays acted as the signal for this technique.
In this setup, BEGe 1 was the primary detector to be characterized, and BEGe 2 acted as a backing detector. Signal gamma rays produced from the 22Na source would first hit
the primary detector, scatter a small angle via Compton scattering, and then be absorbed by the backing detector. Due to this mechanism, the coincidence events of the primary and backing detectors were expected to produce a signal of events whose energies summed to 511 keV and 1274.5 keV.
Pulse Tube Detector
Primary Detector
Backing Detector Source
Figure 9: A picture of the experimental set up at North Carolina State University.
5
Data Acquisition System
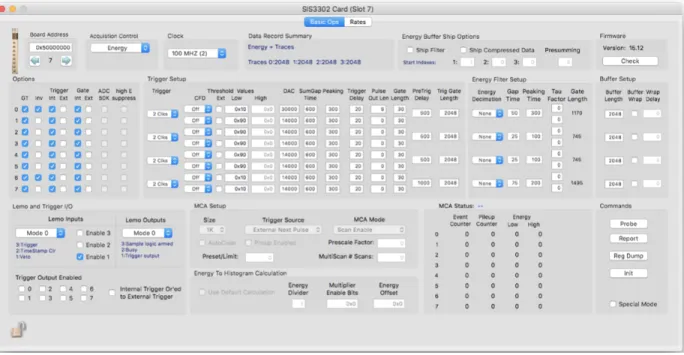
The data acquisition system (DAQ) was managed by the Object-Oriented Real-time Control and Acquisition software package (ORCA). The Struck Innovative System 3302 (SIS3302) Card was used to record data. A schematic of the setup is shown in Figure 11.
SIS3302 was last used for the MAJORANALow-background Broad Energy Germanium
De-tector at KURF [35]. The card is an eight-channel 16-bit 100-MHz digitizer, which connects to a VME backplane [35]. S1S3302 self-triggers from the onboard trapezoidal filter. Being performed unshielded and above ground, this experiment had a large amount of low energy noise. To reduce the amount of data being collected due to low energy noise, the trigger was set near 150 keV for the backing detector. This setting was low enough to allow the 511 keV coincidence to be seen, while allowing the data set to be a reasonable size for storage and processing. One of the trigger settings used are shown in Figure 13.
5.1
Data Description
Figure 10: The decay scheme of 22Na [36].
VME Crate
DAQ Computer with ORCA
SBC SIS3302 Chan 0
Chan 1
Chan 0
Pulse Tube Detector
BEGe 1
BEGe 2
Figure 11: Diagram of the DAQ System.
Figure 12: Picture of the DAQ System.
Figure 13: ORCA trigger settings used for the DAQ.
5.2
Built Data
5.3
Energy Calculation
A trapezoidal filter was used to calculate the energy of the signal in this experiment. This algorithm converted the ADC pulse of a signal to a trapezoid to calculate the energy, where the plateau height of the converted trapezoid was proportional to the amplitude of the original pulse. For this conversion, the plateau length of the original pulse along with the decay time—τ factor—had to be known [33]. These parameters were determined for each channel based on a sample of pulses recorded onboard in ORCA. This method was used because averaging techniques such as a trapezoid filter remove high-frequency noise and improve resolution [33].
5.4
Energy Calibration
The energy of each channel was calibrated using the 511 keV and 1274 keV peak of22Na for each channel. The calibrated energy spectrum of the primary and the backing detector are shown in Figures14and 15. A linear approximation was used to make these calibrations for each channel.
h1d
Entries 1.06149e+08
Mean 402.2
Std Dev 329
200 400 600 800 1000 1200 1400 1600 Energy [keV]
3
10
4
10
5
10
6
10
Counts
h1d
Entries 1.06149e+08
Mean 402.2
Std Dev 329
Calibrated Energy of the Primary Detector
h1d
Entries 6610089 Mean 391.8 Std Dev 297.1
200 400 600 800 1000 1200 1400 1600 1800 2000 Energy [keV] 1
10
2
10
3
10
4
10
5
10
Counts
h1d
Entries 6610089 Mean 391.8 Std Dev 297.1
Calibrated Energy of the Backing Detector
Figure 15: The calibrated energy spectrum for the backing detector. Peaks corresponding to the 511 keV and 1274 keV events are clearly seen.
6
Analysis and results
6.1
Anticipated Signal
The anticipated signals of this experiment were two lines with slopes of negative one and y-intercepts of 511 keV and 1274 keV when plotting the energy of coincident events be-tween the primary and backing detectors. Observing these coincidences would demonstrate the viability of this characterization technique based on low angle Compton scattering and recommend further development of this characterization technique.
6.2
Results
A plot of coincidence energy between the primary and backing detectors is shown in Figure
16. This graph shows the anticipated coincidence line corresponding to the 1274 keV decay and scattering event. A zoomed in plot shown in Figure 17 clearly displays the expected coincidence line corresponding to the 511 keV gamma decay.
Figure18 is a zoomed in version of Figure16, which shows the population of low energy events in the primary detector produced from the small angle Compton scatter of a 511 keV gamma ray. Figure 19 displays this population for the 1274 keV gamma ray. These figures qualitatively demonstrate that this technique produces a sample of low energy events in the primary detector that could be used for low energy characterizations.
200 400 600 800 1000 1200 1400 Backing Detector Energy [keV] 0 200 400 600 800 1000 1200 1400
Primary Detector Energy [keV]
h2d Entries 113679 Mean x 395.2 Mean y 349.5 Std Dev x 280.8 Std Dev y 323.1
0 0.5 1 1.5 2 2.5 3 3.5 4 h2d Entries 113679 Mean x 395.2 Mean y 349.5 Std Dev x 280.8 Std Dev y 323.1 Detector Energy Coincidence
Figure 16: The energy of coincident events between the primary and backing detectors. Lines corresponding to the 511 keV and 1274 keV are clearly displayed
100 200 300 400 500
Backing Detector Energy [keV] 0 100 200 300 400 500
Primary Detector Energy [keV]
h2d Entries 113679 Mean x 276.3 Mean y 232.9 Std Dev x 113.4 Std Dev y 163.6
0 0.5 1 1.5 2 2.5 3 3.5 4 h2d Entries 113679 Mean x 276.3 Mean y 232.9 Std Dev x 113.4 Std Dev y 163.6 Detector Energy Coincidence
Figure 17: A closer view of Figure 16. The coincident line corresponding to the 511 keV annihilation radiation is seen.
400 420 440 460 480 500 520 540 Backing Detector Energy [keV] 0 20 40 60 80 100 120 140 160
Primary Detector Energy [keV]
h2d Entries 113679 Mean x 475.1 Mean y 78.96 Std Dev x 43.71 Std Dev y 53.39
0 0.5 1 1.5 2 2.5 3 h2d Entries 113679 Mean x 475.1 Mean y 78.96 Std Dev x 43.71 Std Dev y 53.39 Detector Energy Coincidence
Figure 18: The population of low energy events in the primary detector produced by the small angle Compton scattering of 511 keV gamma rays
1200 1220 1240 1260 1280
Backing Detector Energy [keV] 0 20 40 60 80 100 120 140 160
Primary Detector Energy [keV]
h2d Entries 113679 Mean x 1243 Mean y 64.18 Std Dev x 27.25 Std Dev y 47.5
0 0.2 0.4 0.6 0.8 1 1.2 1.4 1.6 1.8 2 h2d Entries 113679 Mean x 1243 Mean y 64.18 Std Dev x 27.25 Std Dev y 47.5 Detector Energy Coincidence
Figure 19: The population of low energy events in the primary detector produced by the small angle Compton scattering of 1274 keV gamma rays
h1d
Entries 113693 Mean 762.8 Std Dev 391.6
400 600 800 1000 1200 1400 1600 1800 2000 Energy Sum [keV] 0
200 400 600 800 1000 1200 1400 1600 1800
Counts
h1d
Entries 113693 Mean 762.8 Std Dev 391.6
Energy Coincidence Sum
Figure 20: A histogram of the summed energy of coincident events between primary and backing detector. The peaks from the 511 keV and 1274 keV events are visible.
the signal rate. Incorporating data from the pulse tube detector would require a longer ex-posure time to produce a reasonable coincidence between the primary and backing detector. The discovery that a third detector is likely unnecessary is a further promising result for the technique.
7
Conclusion
This study aimed to investigate the technique of using a radioactive source along with the coincidence of a primary and a backing detector for low energy characterizations at the surface of the Earth. This method was designed to measures low angle Compton scattering events, where a small amount of energy would be deposited in the primary detector. In this particular set up, a 511 keV and a 1274 keV gamma ray were predicted to be observable using a22Na source. In coincident events between the primary and backing detectors, these
signals were seen. The identification of the expected signals successfully demonstrated the technique used to make calibrations by MAJORANA. Further, the results displayed that this
method generates a sample of low energy events that could be used for surface low energy characterizations. Determining the threshold of detectors is one application where a low energy sample could be used.
It was initially proposed that a third or fourth coincidence detector would be necessary to reduce the background in this configuration. The pulse tube detector was included in this study to provide a third coincidence. However, this investigation found that a sample of low energy events could be generated with a primary and backing detector without the use of any additional coincident detectors. Each additional detector would decrease the rate of events, so the discovery that additional coincidences are unneeded is advantageous to this technique.
Additional future modifications to this procedure could including placing the source in multiple different positions and adding physical shielding. By changing the location of the source, this method could be used to scan the germanium detectors uniformly. Installing shielding such as lead blocks around the set up may significantly reduce the background. These modifications could lead to further development of a broader approach for low energy surface characterization of high purity germanium detectors.
References
[1] F. L. Wilson, American Journal of Physics 36, 1150 (1968).
[2] C. L. Cowan, F. Reines, F. B. Harrison, H. W. Kruse, and A. D. Mcguire, Science 124, 103 (1956).
[3] Y. Ashie et al., Phys. Rev. Lett. 93 (2004) 101801.
[4] T. Araki et al., Phys. Rev. Lett. 94 (2005) 081801.
[5] S.N. Ahmed et al., Phys. Rev. Lett. 92 (2004) 181301.
[6] M. Goeppert-Mayer, Physical Review 48, 512 (1935).
[7] G. Racah, Il Nuovo Cimento 14, 322 (1937).
[8] C.E. Aalseth et al. (Majorana Collaboration) Phys. Rev. Lett. 120, 132502 (2018).
[9] N. Abgrall, et al., Advances in High Energy Physics 2014, 1 (2014).
[10] M. Fukugita and T. Yanagida, Physics Letters B 174, 45 (1986).
[11] J. D. Vergados, H. Ejiri, and F. imkovic, Reports on Progress in Physics 75, 106301 (2012).
[12] F. T. Avignone, S. R. Elliott, and J. Engel, Reviews of Modern Physics 80, 481 (2008).
[13] J. Gruszko, Ph.D. thesis, University of Washington, 2017.
[14] A. G. Schubert, Ph.D thesis, University of Washington, 2012.
[15] R. Henning, Reviews in Physics 1 (2016) 29-35.
[17] M. Agostini, et al., Physical Review Letters 120, (2018).
[18] L. Baudis, Annalen Der Physik 528, 74 (2015).
[19] P. Ade et al. arXiv:1502.01589 (2015).
[20] R. D. Peccei and H. R. Quinn, Phys. Rev. Lett. 38, 1440 (1977)
[21] G. Rybka, Phys. Dark Univ. 4, 1416 (2014).
[22] G. Bertone, D. Hooper, and J. Silk, Phys. Rept. 405, 279390 (2005).
[23] B. W. Lee and S. Weinberg, Physical Review Letters 39, 165 (1977).
[24] G. Gilmore, Wiley.com (2008).
[25] D. Akimov, et al, ArXiv:1509.08702 (2015).
[26] P. Finnerty, J. I. Collar, G. K. Giovanetti, R. Henning, M. G. Marino, A. G. Schubert, and J. F. Wilkerson, IEEE Nuclear Science Symposuim Medical Imaging Conference (2010).
[27] S. I. Alvis, ArXiv:1902.02299v1 (2019).
[28] C. E. Aalseth et al, Physical Review Letters 120, (2018).
[29] Giovanetti G K et al. 2012 J. Phys. Conf. Ser. 375 012014 12th International Conference on Topics in Astroparticle and Underground Physics, TAUP2011, presented by G. K. Giovanetti
[30] R. Creswick, F. A. Iii, H. Farach, J. Collar, A. Gattone, S. Nussinov, and K. Zioutas, Physics Letters B 427, 235 (1998).
[31] K. Vorren, Ph.D. thesis, University of North Carolina at Chapel Hill, 2017.
[32] Knoll, Glenn Frederick. Radiation Detection and Measurement. Wiley, 2000.
[33] V. T. Jordanov and G. F. Knoll, Nuclear Instruments and Methods in Physics Research Section A: Accelerators, Spectrometers, Detectors and Associated Equipment 345, 337 (1994).
[34] C. Wiseman and B. Zhu, MAJORANA Colloporation, Unidoc -2017-016 (unpublished).
[35] G. Giovanetti, Ph.D. thesis, University of North Carolina at Chapel Hill, 2015.
![Figure 1: Possible Feynman diagrams of two neutrino double-beta decay (left) and neutrinoless double-beta decay (right) [12].](https://thumb-us.123doks.com/thumbv2/123dok_us/8333184.2211275/2.918.261.640.610.796/figure-possible-feynman-diagrams-neutrino-double-neutrinoless-double.webp)
![Figure 2: Signal of nuetrinoless double-beta decay at the summed Q-value for HPGe detectors [8].](https://thumb-us.123doks.com/thumbv2/123dok_us/8333184.2211275/4.918.314.618.502.721/figure-signal-nuetrinoless-double-decay-summed-value-detectors.webp)
![Figure 3: A diagram of the M AJORANA D EMONSTRATOR [8]. The array of Ge detectors is shown surrounded by an inner and outer copper shield as well as veto panels and a poly](https://thumb-us.123doks.com/thumbv2/123dok_us/8333184.2211275/5.918.306.612.107.296/figure-diagram-ajorana-emonstrator-detectors-surrounded-copper-shield.webp)