1 / 16 SEPTEMBER 2009 / EDS INTERNAL
Jeff Lindskoog
EDS, An HP Company
1401 E. Hoffer St
Kokomo, IN 46902
USA
APPLYING FUNCTION POINTS
WITHIN A SOA ENVIRONMENT
3 / 16 SEPTEMBER 2009 / EDS INTERNAL APPLYING FUNCTION POINTS WITHIN A SOA ENVIRONMENT
Agenda
•What is Function Point Analysis?
•What is SOA?
•How to apply FPA to a SOA project?
•How to use the results?
5 / 16 SEPTEMBER 2009 / EDS INTERNAL APPLYING FUNCTION POINTS WITHIN A SOA ENVIRONMENT
What is Function Point Analysis?
• Function point analysis (FPA) is a standard method for measuring
software development and maintenance from the customer’s point of
view.
• This method utilizes internationally accepted counting rules in the
analysis of the software’s requirements and logical design in order to
quantify the functionality the software provides to the user.
• The functionality provided by a software application is evaluated by
analyzing the data and transactional components.
•
The data components, classified as Internal Interface Files and External
Interface Files, consist of the logical files that are maintained and/or read
during the processing of the software’s transactions.
•
The transactional components, classified as External Inputs, External
Outputs and External Inquiries, consist of the logical processes that read
and/or manipulate the software’s data.
• The end result is a consistent size measure that can be used in
estimating and comparative analysis.
What is Service-Oriented Architecture (SOA)?
• EDS, an HP Company, defines Service-Oriented Architecture (SOA) as
a conceptual business aligned architecture where business
functionality or application logic is made available as shared, reusable
services on an IT network.
• It is based on the concept of loosely coupled components that are
capable of interacting in standard and transparent ways regardless of
the platforms, vendors or technologies running the components.
• SOA enables information technology to be more responsive to the
demands of the business because flexible, standards-based
components can be developed, combined and deployed rapidly to
support business agility.
• SOA has become a critical enabler for companies to effectively
respond to challenging market dynamics and capitalize on new
business opportunities.
7 / 16 SEPTEMBER 2009 / EDS INTERNAL APPLYING FUNCTION POINTS WITHIN A SOA ENVIRONMENT
Example SOA Implementation
Infrastructure
Layer
Storage
Network
Hardware
Point
Solutions
Layer
Legacy Applications
COTS Packages
ERP’s
Enterprise
Integration
Layer
Processes (BPEL) Data (XSD) Services (WSDL) O/JDBCC/S WS/SOAP C/S E/JMSC/SMeta-Data
Repository
Transformations
(XSLT)
Business
Process
Layer
Operational
Real-Time
Data Stores
Right Time
Data Marts
&
Warehouses
BAM Analytics
BPM
Data Flows
Portal Integration
Framework
Business Rules
Engine
Presentation
Layer
Application flow
Infrastructure
Layer
Point
Solutions
Layer
Enterprise
Integration
Layer
Business
Process
Layer
Presentation
Layer
SOA Layers
9 / 16 SEPTEMBER 2009 / EDS INTERNAL APPLYING FUNCTION POINTS WITHIN A SOA ENVIRONMENT
The FPA Process
Determine
Type of
Count
Identify
Scope &
Application
Boundary
Count Data
Functions
Count
Transactional
Functions
Determine
Unadjusted
Function
Point Count
Determine
Value
Adjustment
Factor
Calculate
Adjusted
Function
Point Count
11 / 16 SEPTEMBER 2009 / EDS INTERNAL APPLYING FUNCTION POINTS WITHIN A SOA ENVIRONMENT
Count Purpose
What is the business question?
Overall Application Size
Size of a Project?
Count Type
Application
•
All functionality that is installed and available for use by the users is included,
regardless of where in the SOA implementation it resides.
Development
•
The functionality provided to the user within the scope of the project is
included.
Enhancement
•
Include the functionality that is maintained (added, changed or removed)
13 / 16 SEPTEMBER 2009 / EDS INTERNAL APPLYING FUNCTION POINTS WITHIN A SOA ENVIRONMENT
Scope and Boundary
Scope
•
The purpose for the count may necessitate multiple scopes and therefore
boundaries need to be identified on the project.
Boundary
•
There may be multiple boundaries in a particular count based on what is
included in the scope of the count and if necessitated by multiple scopes,
boundaries may overlap when unique counts are performed.
Infrastructure Layer
Point Solutions Layer
Enterprise Integration
Layer
Business Process Layer
Presentation Layer
SOA Layers
Infrastructure Layer
Boundary
(No Functionality)
Point Solutions Layer
Boundary
Integration Services
Layer
Boundary
Presentation Layer
Boundary
Layer
Boundaries
=
=
=
=
Installed
Application
Application
Boundary
=
Boundary Example
15 / 16 SEPTEMBER 2009 / EDS INTERNAL APPLYING FUNCTION POINTS WITHIN A SOA ENVIRONMENT
Users
•
When identifying the users in a SOA environment, an expanded
definition of what a “user” is needs to be employed.
– IFPUG defines a user as “Any person that specifies Functional User
Requirements and/or any person or thing that communicates or interacts
with the software at any time.”
•
Traditionally, a “user” is considered to be a person that is the business
end-user of the application.
•
Within a SOA environment, the definition of "user" needs to be
broadened to include other software components who, by their
interaction with the services contained within the various SOA layers,
define the requirements for the services.
Identifying the Users
• Each layer needs to be individually looked at from the perspective of
who or what is defining the requirements for the layer.
• For the Presentation Layer
•
The user is typically the end user and perhaps a business user that
manipulates the business rules within the layer. It is these users that drive
the behavior of the overall application, but specifically the Presentation
Layer as it is the user interface.
•
For the Integration Services Layer (Business Process/Enterprise
Integration Layers)
•
The user is not the end-user or business user of the application since they
have no direct contact and likely do not even realize the Integration Services
Layer exists, but rather, the “user” is the Presentation Layer.
17 / 16 SEPTEMBER 2009 / EDS INTERNAL APPLYING FUNCTION POINTS WITHIN A SOA ENVIRONMENT
Data Functions
The services executed within a SOA environment have a static data
structure.
What comes back from the service always has the same fields, in the
same format, in the same order, regardless of when or where it is
called.
The actual data returned is based on the parameters that are passed to
the service.
Point Solutions
Layer Boundary
Presentation Layer
Boundary
Integration Services
Layer Boundary
Get
Agents
Request
Sends:
Postal Code
Receives:
Agent Name
Addresses
Phone Numbers
Websites
Agents
Receives:
Agent Names
Agent
Names
Within
Postal Code
Sends:
Postal Code
Agent
Names &
Info
Within
Postal Code
Sends:
Postal Code
Receives:
Agent Name
Addresses
Phone Numbers
Websites
EIF
19 / 16 SEPTEMBER 2009 / EDS INTERNAL APPLYING FUNCTION POINTS WITHIN A SOA ENVIRONMENT
Counting Data Functions
1. To determine ILFs:
–
Look for actual updates to data within the boundary. There may or may
not be updates occurring within in the individual layers.
2. To determine the EIFs for the Presentation Layer:
–
Identify each unique component within the boundary of the Integration
Services Layer that is sending data back to the Presentation Layer.
3. To determine the EIFs for the Integration Services Layer:
–
Identify each unique component within the Point Solutions Layer boundary
that is sending data back to the Integration Services Layer.
4. Apply the IFPUG EIF rules to assess if these are valid EIFs.
–
If multiple components are returning the same data, perhaps sorted
differently or with minor additional fields, then count them as 1 EIF.
–
If the field differences are major, count the component as an additional EIF
An important concept to remember from one layer to the next is what
was considered an EIF may not be an ILF in another layer.
Data Function Complexity
For ILFs:
•
DETs and RETs can be analyzed by applying the IFPUG rules.
For EIFs:
•
For the Presentation Layer, DETs for the EIFs should be based on the fields
that cross the boundary from the Integration Services Layer or other Layers,
as appropriate.
•
For the Integration Services Layer, DETs for the EIFs should be based on the
fields that cross the boundary from the Point Solutions Layer.
EIF Hints
•
Analyze the services that are called by the Presentation or Integration
Services Layer to help identify the fields.
•
Look at the fields that are being returned and apply the IFPUG rules for
logical, non-repeating fields.
•
RETs are more complex to identify; analyzing the transactional functions in
conjunction with the data returned may provide additional information if
more than one RET exists.
21 / 16 SEPTEMBER 2009 / EDS INTERNAL APPLYING FUNCTION POINTS WITHIN A SOA ENVIRONMENT
Transactional Functions
When determining the transactional functions to be counted, it is
important to understand the boundary and user view for what is
included in the scope of the count.
While the services executed have a static data structure, the purpose for
calling the service determines the transactional elementary process
being performed.
Point Solutions
Layer Boundary
Presentation Layer
Boundary
Integration Services
Layer Boundary
Get
Agents
Request
Sends:
Postal Code
Receives:
Agent Name
Addresses
Phone Numbers
Websites
Agents
Receives:
Agent Names
Agent
Names
Within
Postal Code
Sends:
Postal Code
Agent
Names &
Info
Within
Postal Code
Sends:
Postal Code
Receives:
Agent Name
Addresses
Phone Numbers
Websites
EIF
23 / 16 SEPTEMBER 2009 / EDS INTERNAL APPLYING FUNCTION POINTS WITHIN A SOA ENVIRONMENT
Transactional Functions
For the Presentation Layer:
•
The transactional functions are the actual functionality being provided to the
end users.
•
Many of the transactions that would normally have been EIs should be
classified as either EQs or EOs because the request to update the data is being
sent outside the Presentation Layer’s boundary for processing.
For the Integration Services Layer:
•
The transactional functions are the actual functionality being provided to the
user, which for this layer is normally the Presentation Layer.
•
It is imperative to identify the components within the boundary of the
Integration Services Layer that are physically called by the Presentation Layer
since these are the functions being executed by the Presentation Layer “user”.
•
These most likely will reside in the Business Process Layer, but may be in
Transactional Functions – cont.
Hints:
•
Within a single function, several physical components might be executed. This
should be treated in the same manner as when several on-line forms make up
a single logical transaction.
•
Also, physical components are often executed in multiple functions. Each
function should account for the appropriate impact to their complexity (DETs
and FTRs) provided by all the components that make up the function.
•
There is also the likelihood that a single component might be called within one
or more functions as well as being called by itself. In these cases, count the
components as their own functions, since they are called by the Presentation
Layer, as well as including them in the complexity rating for the other functions
that call them
25 / 16 SEPTEMBER 2009 / EDS INTERNAL APPLYING FUNCTION POINTS WITHIN A SOA ENVIRONMENT
Integration Services Layer Boundary
Enterprise Integration Layer
Business Process Layer
Presentation Layer Boundary
Point Solutions Layer Boundary
Agents
Names and Agencies
Within Postal Code
Sends:
Postal Code
Sends:
Postal Code
Agencies
Sends:
Agent Names
Receives:
Agency Name
Address
Phone Numbers
Websites
Sends:
Postal Code
Receives:
Agent Name
Addresses
Phone Numbers
Websites
Sends:
Agent Names
Receives:
Agency Name
Address
Phone Numbers
Websites
Receives:
Agent Name
Addresses
Phone Numbers
Websites
Receives:
Agency Name
Agent Names
EIF
EIF
EQ
Receives:
Agent Names
Agent Names
Within Postal
Code
Sends:
Postal Code
EQ
Get Agent Names and Agencies
Within Postal Code
Get Agents
Request
Get
Agencies
Request
Transactional Function Complexity
For EI’s, EO’s and EQ’s:
•
For the Presentation Layer, DETs should be based on the fields that cross the
boundary from the user interface or the Integration Services Layer or other
Layers, as appropriate.
•
For the Integration Services Layer, DETs should be based on the fields that
cross the boundary from the Presentation Layer and the Point Solutions Layer.
•
FTRs are based on the data functions that were identified for the respective
layer.
Hints:
•
Analyze the services that are called by the Presentation and Integration
Services Layer to help identify the fields.
•
Look at the fields that are being sent and returned and apply the IFPUG rules
27 / 16 SEPTEMBER 2009 / EDS INTERNAL APPLYING FUNCTION POINTS WITHIN A SOA ENVIRONMENT
So, Ah, How should you use the Results?
• The FP value can be useful in estimating as well as determining the
magnitude of the work performed for each layer.
•
It is important to understand that the function point analysis results are
relevant only at the individual, segmented layer level.
•
The summation of the counts from all the segments will yield an inaccurate
and inflated overall project and/or application size.
• To obtain a true project and/or application size, a separate analysis
must be performed based solely on the boundary and user view for
the entire scope of work and/or application, not the individual layers.
•
This count should be inclusive of all the layers from Presentation thru Point
Solutions and represent the user view of the end-users and business users.
• When utilizing the FP size, at the layer level, in calculations with other
metrics, like effort, duration, defects, changes, etc. it is critical not to
aggregate values across
•
Any data analyzed in conjunction with a layer’s FP size should be collected,
So, Ah, Function Point Analysis CAN be used
•
Function Point Analysis can be applied in a Service-Oriented
Architecture environment.
•
Function point analysis sizes the functionality being provided to the
user, and an application in a SOA environment provides users
functionality.
•
By segmenting the layers within a SOA environment, it is possible to
determine a meaningful size of the work performed for each layer.
•
Care must be exercised NOT to sum the individual counts at the
29 / 16 SEPTEMBER 2009 / EDS INTERNAL APPLYING FUNCTION POINTS WITHIN A SOA ENVIRONMENT
Questions?
Contact Jeff Lindskoog
•
mailto:[email protected]
How to Apply Function Points within a SOA Environment
All application projects are made up of both functional and non-functional components. Function point analysis sizes the functionality being provided to the user and therefore can be used to size the functional components of any project. The difference with projects that build and enhance applications within the Service-Oriented Architecture (SOA) environment is the quantity of non-functional components. From the end users’ perspective, the functional requirements pertain only to the Presentation Layer, limiting function point analysis to this layer. This perception restricts the analysis, yielding a result that is not representative of the work involved in the entire project. It is possible to use function point analysis to determine a size that is respective to the work performed and the approach to doing so is outlined in this paper.
APPLYING FUNCTION POINTS WITHIN
A SOA ENVIRONMENT
EDS INTERNAL DOCUMENT
EDS and the EDS logo are registered trademarks of Hewlett Packard Inc. © 2009 HP. All rights reserved
TABLE OF CONTENTS (STYLE: TABLE OF CONTENTS HEADER)
INTRODUCTION ... 3
FUNCTION POINT ANALYSIS OVERVIEW... 3
What is a Function Point? ... 3
What do Function Points count? ... 4
SERVICE-ORIENTED ARCHITECTURE OVERVIEW ... 4
What is the SOA environment? ... 4
How does an application run in a SOA environment? ... 5
HOW TO APPLY FPA TO A PROJECT USING A SOA ENVIRONMENT ... 6
Purpose of the Function Point Analysis ... 6
Function Point Count Type ... 7
Determining the Analysis Scope and Boundaries ... 8
Determination of the Users ... 9
Data Functions ... 9
Complexity of Data Functions - DETS and RETS ... 12
Transactional Functions ... 12
Complexity of Transactional Functions - DETs and FTRs ... 14
UTILIZING THE FUNCTION POINT RESULTS ... 15
CONCLUSION ... 15
INTRODUCTION
Function point analysis (FPA) has been a standard sizing measure for application
development for over 20 years. The strengths of FPA lie in its ability to consistently
measure the functionality provided to the user regardless of the technology or languages
used. With the emergence of the Service-Oriented Architecture (SOA), the applicability of
FPA has begun to be debated. The resounding issue with utilizing FPA in the SOA
environment is the end user functionality is normally provided by only one layer or part of
the overall system. However, there is significant effort expended in meeting the
requirements for the other SOA layers that is typically not accounted for using function
point analysis. This leads to a belief that FPA is ineffective in sizing projects in the SOA
environment. This paper will outline an approach that enables function point analysis to
be an effective sizing measure within the SOA environment.
Function Point Analysis Overview
The Function Point Analysis Overview section provides a basic understanding of function point analysis. This is not meant to provide an in-depth review of the method. More information on function point analysis is available on the International Function Point Users Group web site, www.ifpug.org.
Function point analysis (FPA) is a standard method for measuring software development and maintenance from the customer’s point of view 1. This method utilizes internationally accepted counting rules in the analysis of the
software’s requirements and logical design in order to quantify the functionality the software provides to the user. Function point analysis follows a common procedure to determine the type of count, the count scope and boundary, the data and transactional functions, the value adjustment factor, and the overall adjusted and unadjusted function point size. The end result is a consistent size measure that can be used in estimating and comparative analysis.
What is a Function Point?
A function point (FP) is a unit of measure which represents the functional size of application software 2. Function
points measure the software from the user's point of view, independent of technology used. Much as building architects can use the number of rooms in a house or the total square footage as a basis for decisions, software architects and project managers can use function point analysis to help make decisions, forecasts, projections, or estimates about a system or application. This method was developed by Allan Albrecht of IBM, and placed in the public domain during the early 1980s. The International Function Point Users Group (IFPUG) owns the
EDS INTERNAL DOCUMENT
EDS and the EDS logo are registered trademarks of Hewlett Packard Inc. © 2009 HP. All rights reserved What do Function Points count?
The functionality provided by a software application is evaluated by analyzing the data and transactional components. The data components consist of the logical files that are maintained and/or read during the processing of the software’s transactions. These are classified as Internal Logical Files (ILF) and External Interface Files (EIF). The transactional components consist of the logical processes that read and/or manipulate the software’s data. These are classified as External Inputs (EI), External Outputs (EO) and External Inquiries (EQ). These five components are determined based on the elementary process or the smallest unit of activity that is meaningful to the user(s) 3. The components are classified as having low, average or high complexity
using rating matrices and assigned a point value. The sum of the point values for all five components make up the unadjusted function point size and is modified by a value adjustment factor that assesses the overall complexity of the software.
Service-Oriented Architecture Overview
The Service-Oriented Architecture Overview section provides a general understanding of the architecture and how the pieces interact but does not attempt to provide a thorough description of the architecture. Additional information on the architecture can be found in various industry publications. While a single implementation framework is discussed in this paper, it is not intended to imply that there is only one way to implement the architecture as there are many different implementations.
EDS, an hp company, defines Service-Oriented Architecture (SOA) as a conceptual business aligned architecture where business functionality or application logic is made available as shared, reusable services on an IT network. It is based on the concept of loosely coupled components that are capable of interacting in standard and
transparent ways regardless of the platforms, vendors or technologies running the components.
SOA enables information technology to be more responsive to the demands of the business because flexible, standards-based components can be developed, combined and deployed rapidly to support business agility. SOA has become a critical enabler for companies to effectively respond to challenging market dynamics and capitalize on new business opportunities.
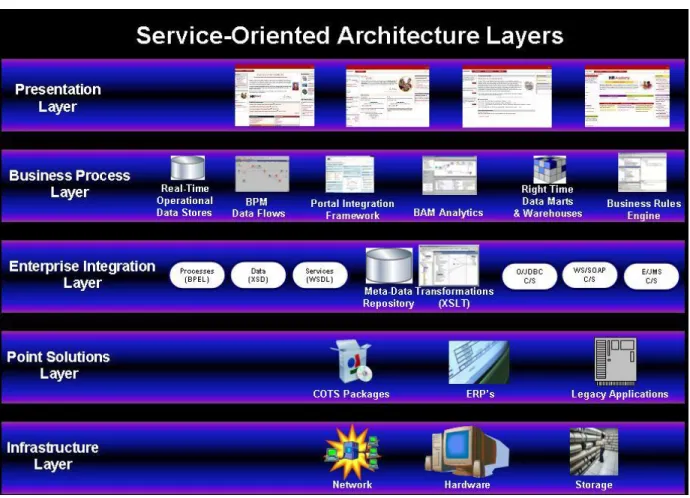
What is the SOA environment?
A SOA environment is typically made up of multiple layers that each play an important role in delivering functionality to the end users, Figure 1 is one example. From the bottom up, the Infrastructure Layer is the hardware, network and storage devices involved in supporting the overall environment. The Point Solutions Layer contains the data and processes which are grouped by application and are only accessible thru the application’s interface. The Enterprise Integration Layer contains the modules that access the processes and data contained in the Point Solutions Layer. While the Business Process Layer packages, enhances and controls the modules of the Enterprise Integration Layer. Finally, the Presentation Layer is where the end user interfaces with the
Figure 1: An EDS SOA Framework Example
How does an application run in a SOA environment?
In the SOA implementation depicted in Figure 1, the user initiates an action on the Presentation Layer. The result is a call to a service in the Business Process Layer which executes one or more Enterprise Integration Layer services. These Enterprise Integration Layer services access the Point Systems processes and data to perform the action initiated by the user. Data is then returned back up through the various layers to the Presentation Layer for presentation back to the user. There may be manipulation of the data in both directions, depending on the internal processing of called services.
What makes the SOA environment so flexible and appealing is the leveragability of the services. While a particular service may be called from multiple processes, the service should be the same regardless of which process is requesting it. This enables the developers to leverage services with consistent results.
EDS INTERNAL DOCUMENT
EDS and the EDS logo are registered trademarks of Hewlett Packard Inc. © 2009 HP. All rights reserved
How to apply FPA to a project using a SOA environment
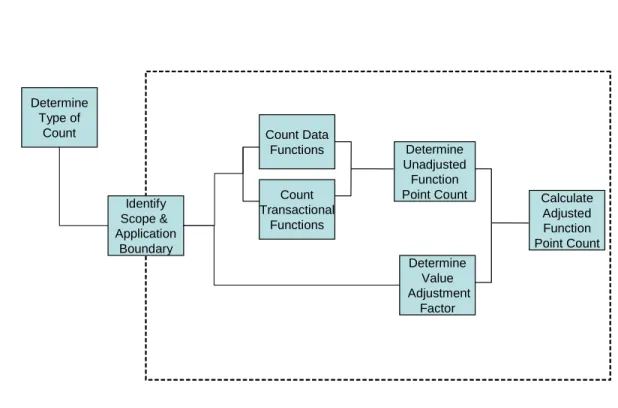
This section outlines how function point analysis can be applied to projects utilizing SOA. It is intended to provide general guidelines that should be followed to arrive at a useful function point size. For simplicity, the example framework in Figure 1 will be used in description of how FPA can be applied in SOA projects. While it is only one example of a SOA environment, the concepts described can be applied to other frameworks as well. The standard, repeatable process for conducting function point analysis, refer to Figure 2, should be followed when attempting to size projects with function points in a SOA environment. The key factor in applying FPA is the determination of the user and count boundary as these combine to provide the foundation for what can and cannot be counted. A conscious decision must be made as to who or what the user is and where the boundary lies, both of which are based on the underlying purpose of the count. Once the user and boundary are established, the remainder of the function point analysis process can be applied.
Figure 2: Function Point Analysis Process 4
Purpose of the Function Point Analysis
The purpose of function point analysis is to provide an answer to a business problem 5. This business problem
might be trying to understand the overall size of the application or trying to estimate the work involved in either the creation of an application or the enhancement of an existing application. The purpose is a major influence on where the boundary for the analysis is positioned. For a SOA project, this is a critical step as the analysis results may be used to help answer multiple business problems, indicating the possible need to conduct analysis based on multiple boundaries. Determine Type of Count Identify Scope & Application Boundary Count Data Functions Count Transactional Functions Determine Unadjusted Function Point Count Determine Value Adjustment Factor Calculate Adjusted Function Point Count
If the purpose of the analysis is to get an overall application size, then all the functionality that is provided to the end user should be included. This functionality is based on what is the smallest, meaningful activity to the end user. The inner workings of the SOA layers influence the complexity, but are not treated as separate functions since they are not typically meaningful activities to the end user. However, there may be services that are meaningful to the user that are not contained in the Presentation Layer, such as security. These must be included in the count as well.
If, instead, the purpose is to determine the size of the project, hence the work involved in building or extending the capabilities of the application, then only the functionality that is included in the scope of the project should be included. In these cases, it is important to understand how the project is segmenting the work. For example, if the purpose for the count is to obtain the size of the work and one sub-project has responsibility for the SOA Presentation Layer and another project has the SOA Business Process Layer, then there are likely two business problems that need to be answered. How big is the SOA Presentation Layer project and how big is the SOA Business Process Layer project.
Function Point Count Type
Determination of the count type is an important step in the function point analysis process. Per the IFPUG Counting Practices Manual, the type of the count can be application, development or enhancement 6. Application
counts include all the functions that are associated with the installed application 7. Development counts include
all functions provided to the user when the project is implemented as well as any conversion functions necessary to deliver a functioning application. Enhancement counts only include the functions that are added, deleted or changed during the project as well as any conversion functions. The count type defines which functions are considered to be included in the count and which are not. A key decision for a SOA project is the accurate determination of the count type, as components are often leveraged from previous projects.
If the count type is application, then all functionality that is installed and available for use by the users is included, regardless of where in the SOA implementation it resides. The nature of a SOA environment promotes a high degree of reusable components. When multiple applications reside in the same SOA environment, these reusable components are often included in multiple application counts. Note: it is important to consider if the functionality is recognizable before including it in the count. There may be functionality that is not user-recognizable or even used in the application being counted; this should not be included in the count.
If the count type is development, then the functionality provided to the user within the scope of the project is included. In a SOA environment, new functionality may include components previously existing in the environment as well as components introduced by the project. Even though the project did not create all the components, they should all be included in the count as they are all used in the delivery of the functionality. If the count type is enhancement, then the functionality that is maintained (added, changed or removed) within the scope of the project is included. In a SOA environment, this maintained functionality may include
components previously existing in the environment as well as components introduced by the project. Even if the project did not create all the components they should all be included in the count as they are all used in the delivery of the functionality. In the case of the deletion of functionality, the project may not physically remove all the physical components to logically delete the functionality; this should to be taken into consideration as well.
EDS INTERNAL DOCUMENT
EDS and the EDS logo are registered trademarks of Hewlett Packard Inc. © 2009 HP. All rights reserved Determining the Analysis Scope and Boundaries
The scope of the function point analysis, determined by the combination of the count type and purpose, identifies the functionality which will be included a particular function point count8. This is an all encompassing view of the
functionality, regardless of where it physically resides. The purpose for the count may necessitate multiple scopes and therefore boundaries need to be identified on the project. A singular purpose of sizing the application or sizing the work to build the layers of the application is different than a dual purpose of sizing the work to build the layers of the application as well as obtaining a size of the overall application when installed. Once the scope of the analysis is determined, application boundaries need to be considered. An application boundary defines the border between the software being measured and the user 9. The appropriate identification is crucial in utilizing
FPA in a SOA environment because it defines what functionality is considered to be internal and external to the software being analyzed. There may be multiple boundaries in a particular count based on what is included in the scope of the count and if necessitated by multiple scopes, boundaries may overlap when unique counts are performed.
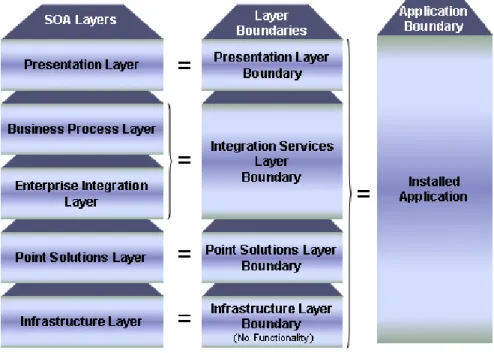
Within a SOA project, how the project is broken up into sub-groups or how the team is divided often gives a clue as to how the boundaries can be drawn. For the example SOA implementation used within this paper, it can be divided into 4 distinct boundaries, see Figure 3.
1. The Presentation Layer
2. The Integration Services Layer which is a combination of the Business Process and Enterprise Integration Layers. Note: This may not always be the case as the Business Process Layer and Enterprise Integration Layer can be separate boundaries.
3. The Point Solutions Layer 4. The Infrastructure Layer
Figure 3 also illustrates how the boundary would be established if the scope included a count of the installed application.
In most SOA projects, the Infrastructure Layer does not contain any functionality. Also, the functionality of the Point Solutions Layer is typically not impacted by the project, other than occasionally adding the necessary components to allow the Enterprise Layer to access the data and processes. If the Point Solutions are impacted, then these changes are normally included in the FPA done for the Integration Services Layer.
Determination of the Users
One significant difference when applying function point analysis in a SOA environment is the identification of the user. The user determines the viewpoint, termed user view, from which the functionality is counted and represents a formal description of the user’s business needs in the user’s language 10. The user also defines the
requirements for the business processes and/or groups of data. When identifying the users in a SOA
environment, an expanded definition of what a “user” is needs to be employed. IFPUG defines a user as “Any person that specifies Functional User Requirements and/or any person or thing that communicates or interacts with the software at any time.” 17 Traditionally, a “user” is considered to be a person that is the business
end-user of the application. Within a SOA environment, the definition of "end-user" needs to be broadened to include other software components who, by their interaction with the services contained within the various SOA layers, define the requirements for the services. While the application’s business end-users (people) may or may not recognize the individual components within the various SOA layers, they do benefit from the functionality they provide.
In order to identify the users for the various SOA layers, each layer needs to be individually looked at from the perspective of whom or what is defining the requirements for the layer. The boundary diagram is a useful aid in this identification; analyzing what is coming in through the boundary from where can lead to who the “users” are. For the Presentation Layer, the user is typically the end user and perhaps a business user that manipulates the business rules within the layer. It is these users that drive the behavior of the overall application, but specifically the Presentation Layer as it is the user interface.
For the Integration Services Layer (Business Process/Enterprise Integration Layers), the user is not the end-user or business user of the application since they have no direct contact and likely do not even realize the
Integration Services Layer exists, but rather, the “user” is the Presentation Layer. For it is the components in the Presentation Layer that define what processes and data are needed as well as driving the behavior of the Integration Services layer.
Depending on the customer and SOA implementation, sometimes the Integration Services Layer is user recognizable. In these cases, it would be appropriate to consider the Integration Services Layer as a separate, user recognizable application with a distinct boundary. If this is the case, the results of the Integration Services Layer can be aggregated with other counts as if multiple business applications were involved in the project. This determination of the “user” is a critical step as it not only determines how the requirements will be
specified, but it also validates the appropriateness of the boundaries; since in order for the boundary to be valid, a user must be identified. If no user can be found, then the boundaries need to be re-drawn.
Data Functions
Once the boundary, user, count type and purpose are defined, the functionality can be assessed, this starts with identifying the data functions. Data functions are defined as the functionality provided to the user to meet internal and external data requirements. Data functions are classified as either internal logical files (ILFs) or external interface files (EIFs) 11 and are counted as logical groupings of data. When determining the data
functions to be counted, it is important to understand the boundary and user view for what is included in the scope of the count. In a SOA environment, the user does not know or care where the data physically resides. What is important is that they reference the right data for the business process being executed. If the data is maintained (added, updated or deleted) within the boundary then it is considered an ILF, if, instead, it is only read or referenced, then it is considered an EIF.
EDS INTERNAL DOCUMENT
EDS and the EDS logo are registered trademarks of Hewlett Packard Inc. © 2009 HP. All rights reserved
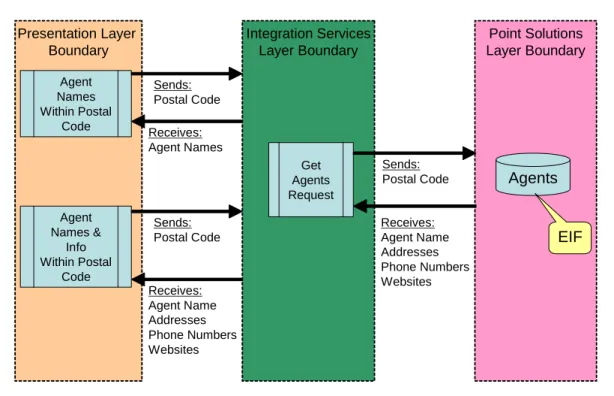
The services executed within a SOA environment have a static data structure. What comes back from the service always has the same fields, in the same format, in the same order, regardless of when or where it is called. The actual data returned is based on the parameters that are passed to the service. In Figure 4, the “Get Agents Request” service within the Integration Services Layer boundary is called by a function in the Presentation Layer to retrieve a list of agents within a postal code. The “Get Agents Request” service passes a postal code to the Point Solutions Layer; it receives, in turn, all the agents within the passed postal code, as well as their addresses, phone numbers, and websites. Since the Presentation Layer function only wanted the agents within the zip code, the “Get Agents Request” service pulls only the agent names from what is returned. If another Presentation Layer function is looking for the agents within a postal code as well as all their other information, it will call the same Integration Services Layer service, “Get Agents Request”, but this time it will pull off all the additional information that was received.
Figure 4: Data Example
For the Presentation Layer, it is critical to evaluate where the data is actually being maintained. There may be little to no data actually maintained within the Layer’s boundary. It is more likely that the Presentation Layer may be sending transactions thru the Integration Layer’s boundary to the Point Solutions, which actually maintain the data. There may be business rules that are maintained within the boundary of the Presentation Layer that control how the layer interacts with the end user. If the business user maintains these rules, then they can be considered an ILF.
Point Solutions
Layer Boundary
Presentation Layer
Boundary
Integration Services
Layer Boundary
Get Agents Request Sends: Postal Code Receives: Agent Name Addresses Phone Numbers WebsitesAgents
Receives: Agent Names Agent Names Within Postal Code Sends: Postal Code Agent Names & Info Within Postal Code Sends: Postal Code Receives: Agent Name Addresses Phone Numbers WebsitesEIF
The data that the Presentation Layer receives from inside the boundary of the Integration Services Layer can be considered the data that is external to the boundary of the Presentation Layer but referenced or read by the Presentation Layer. To determine the EIFs for the Presentation Layer:
1. Identify each unique component within the boundary of the Integration Services Layer that is sending data back to the Presentation Layer.
2. Apply the IFPUG EIF rules to assess if these are valid EIFs. Take care to not over count the EIFs. If multiple components are returning the same data, perhaps sorted differently or with minor additional fields, then count them as a single EIF. If the field differences are major, count the component as an additional EIF.
a. For example, if two services return a list of agent names, just sorted differently, there would be a single EIF, “Agents”. If a third service returned the list of agent names with an addition of the address, this should be included in the initial “Agents” EIF. If, however, the third service provided the list of agent names and addresses along with agency names and addresses then there is likely to be a second EIF, “Agencies”.
The data functions within the boundary for the Integration Services Layer are identified much the same way. Again, there may be little to no data actually maintained within the Layer’s boundary but rather the Integration Services Layer may just be the conduit for the Presentation Layer to send transactions through to the
appropriate Point Solutions to maintain the data. There are not normally rules that are maintained within the boundary of the Integration Services Layer that could be counted as an ILF, but this would need to be confirmed. The data the Integration Services Layer receives from inside the boundary of the Point Solutions Layer can be considered the data that external to the boundary of the Integration Services Layer that is referenced or read by the Integration Services Layer. Depending on how the services are written, it may be possible to have insight into how the point systems logically group the data. If this is the case, then the IFPUG rules for identifying EIFs should be used. If not, then the following approach can be used to determine the EIFs for the Integration Services Layer.
1. Identify each unique component within the Point Solutions Layer boundary that is sending data back to the Integration Services Layer.
2. Apply the IFPUG EIF rules to assess if these are valid EIFs. Take care to not over count the EIFs. If multiple components are returning the same data, perhaps sorted differently or with minor additional fields, then count them as 1 EIF. If the field differences are major, count the component as an additional EIF.
a. For example, if two services return a list of jobs, just sorted differently, this would be a single EIF, Jobs. If a third service returned the list of jobs with an addition of the corresponding pay scale, this should be included in the initial EIF. If, however, the third service provided the list of jobs, corresponding pay scales and number of employees in each job then there is likely to be a second EIF, Employees.
An important concept to remember from one layer to the next is what was considered an EIF may not be an ILF in another layer. Somewhere, in the overall application, the data exists and is maintained, but it may not be the next layer down. For example, an EIF from the perspective of the Presentation Layer boundary may not be an ILF within the boundary of the Integration Services Layer.
EDS INTERNAL DOCUMENT
EDS and the EDS logo are registered trademarks of Hewlett Packard Inc. © 2009 HP. All rights reserved Complexity of Data Functions - DETS and RETS
The complexity of a Data Function is determined by the number of DETs and RETs. A DET is a unique user recognizable, non-repeating field 12 and a RET is a user recognizable subgroup of date elements within an ILF or
EIF 13. The key in determining these values is understanding the user view.
For ILFs within the boundaries of both the Presentation and Integration Services Layers, DETs and RETs can be analyzed by applying the IFPUG rules. Look at the logical fields and sub-groupings to determine the values and corresponding complexities.
For the Presentation Layer, DETs for the EIFs should be based on the fields that cross the boundary from the Integration Services Layer or other Layers, as appropriate. Analyze the services that are called by the Presentation Layer to help identify the fields. Look at the fields that are being returned and apply the IFPUG rules for logical, non-repeating fields. RETs are more complex to identify; analyzing the transactional functions in conjunction with the data returned may provide additional information if more than one RET exists.
For the Integration Services Layer, DETs for the EIFs should be based on the fields that cross the boundary from the Point Solutions Layer. Analyze the services that are called by the Integration Services Layer to help identify the fields. Look at the fields that are being returned and apply the IFPUG rules for logical, non-repeating fields. RETs are more complex to identify; analyzing the transactional functions in conjunction with the data returned may provide additional information if more than one RET exists.
Transactional Functions
Transactional functions are defined as the functionality provided to the user to process data by an application and are classified as external inputs (EIs), external outputs (EOs), and external inquires (EQs). 14 These
transactional functions are counted at the logical, elementary process level. An elementary process is the smallest unit of activity that is meaningful to the user(s) 15. When determining the transactional functions to be
counted, it is important to understand the boundary and user view for what is included in the scope of the count. If data is maintained (added, updated or deleted) within the boundary then the function is either an EI or EO, depending on the primary intent of the transaction. If, instead, the data is maintained outside the boundary, then the function cannot be an EI.
While the services executed have a static data structure, the purpose for calling the service determines the transactional elementary process being performed. Referring to Figure 4 above, when the Presentation Layer service “Agent Names within Postal Code” executes the Integration Services Layer “Get Agents Request” to access the data in the Point Solutions Layer, the elementary process executed is to retrieve a list of all the agents within the zip code. When the “Agent Names & Info within Postal Code” service from the Presentation Layer initiates the Integration Services Layer “Get Agents Request” to access the data in the Point Solutions Layer, the elementary process being executed is to retrieve a list of all the agents and their related information within the zip code. This is a unique, elementary process for the Presentation Layer even though the same service is being executed. However, from the standpoint of the Integration Services Layer, there is one transaction, “Get Agents Request”, regardless of where or how many times it is used by the Presentation Layer services.
For the Presentation Layer, the transactional functions are the actual functionality being provided to the users. Since most Presentation Layers are now being web-enabled, it is important that the functionality be counted based on IFPUG rules and available hints for counting Web applications. If the business users are included and maintain the business rules within the Presentation Layer boundary, this maintenance activity should be included in the counted transactions as well. While the identification of the elementary processes as transactional
functions is straightforward, classifying the transactions as EI, EO and EQ is what is different in counting the layers of a SOA project. Since there may be little to no data actually maintained within the boundary of the Presentation Layer, many of the transactions that would normally have been EIs should be classified as either EQs or EOs because the request to update the data is being sent outside the Presentation Layer’s boundary for processing. This is the primary difference in counting the transactional functions for the Presentation Layer. For the Integration Services Layer, the transactional functions are the actual functionality being provided to the user, which for this layer is normally the Presentation Layer. The IFPUG rules need to be applied utilizing this perspective. Since there is no person to ask about their view point of the functionality, it is imperative to identify the components within the boundary of the Integration Services Layer that are physically called by the
Presentation Layer. These most likely will reside in the Business Process Layer, but may be in the Enterprise Integration Layer as well. These are the functions being executed by the Presentation Layer “user”; it is these functions that define the elementary processes that should be analyzed against the IFPUG rules.
Within a single function, several physical components might be executed. This should be treated in the same manner as when several on-line forms make up a single logical transaction. The function is not complete until all components are executed. Also, physical components are often executed in multiple functions. Each function should account for the appropriate impact to their complexity (DETs and FTRs) provided by all the components that make up the function. There is also the likelihood that a single component might be called within one or more functions as well as being called by itself. In these cases, count the components as their own functions, since they are called by the Presentation Layer, as well as including them in the complexity rating for the other functions that call them.
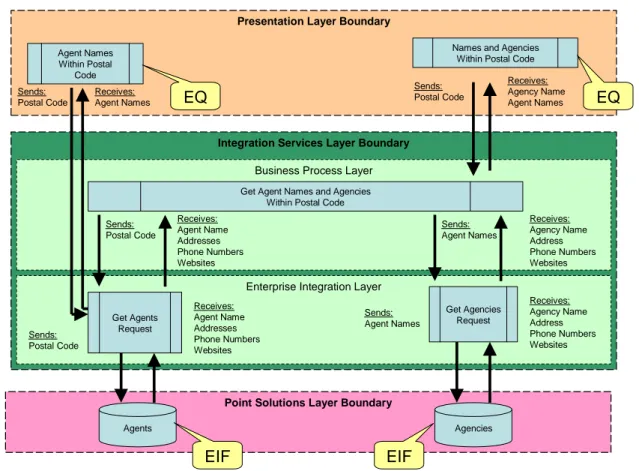
In the example below, Figure 5, there are two functions involved, “List of Agents” which uses the “Agent Names within Postal Code” component and “List of Agencies and their Agents” which uses the “Names and Agencies within Postal Code” component. Even though the “Get Agents Request” component is used directly by the “List of Agents” function and counted in the complexity for that function, it is also included in the complexity of the “List of Agencies and their Agents” function because it is used in this function as well.
EDS INTERNAL DOCUMENT
EDS and the EDS logo are registered trademarks of Hewlett Packard Inc. © 2009 HP. All rights reserved
Figure 5: Transaction Example
Once all functions have been identified, apply the IFPUG rules to them. There may be little to no data actually maintained within the boundary of the Integration Services Layer, but rather the Integration Services Layer may be sending transactions to the Point Solutions Layer to maintain the data. Also, there are not normally rules that are maintained within the boundary of the Integration Services Layer that could be counted as EIs against an ILF.
As with all function point counts, it is crucial to determine what elementary process is being executed. There may be several different processes within the same physical form or service, or there may be several forms or services involved in a single elementary process. Care must be also be exercised not to over count transactions. Ensure that only unique, “user”-recognizable transactions are counted.
Complexity of Transactional Functions - DETs and FTRs
The complexity of a transactional function is determined by the number of DETs and FTRs. A DET is unique user recognizable, non-repeating field 12 and a FTR is an ILF read or maintained by a transactional function or an EIF
read by a transactional function 16. The key to determining these values within a SOA environment is
understanding the user view.
For the Presentation Layer, DETs should be based on the fields that cross the boundary from the user interface or the Integration Services Layer or other Layers, as appropriate. Analyze the services that are called by the Presentation Layer to help identify the fields. Look at the fields that are being sent and returned and apply the IFPUG rules for logical, non-repeating fields. FTRs will be based on the ILFs and EIFs previously identified.
Integration Services Layer Boundary
Enterprise Integration Layer Business Process Layer Presentation Layer Boundary
Point Solutions Layer Boundary
Agents
Names and Agencies Within Postal Code Sends: Postal Code Sends: Postal Code Agencies Sends: Agent Names Receives: Agency Name Address Phone Numbers Websites Sends: Postal Code Receives: Agent Name Addresses Phone Numbers Websites Sends: Agent Names Receives: Agency Name Address Phone Numbers Websites Receives: Agent Name Addresses Phone Numbers Websites Receives: Agency Name Agent Names
EIF
EIF
EQ
Receives: Agent Names Agent Names Within Postal Code Sends: Postal CodeEQ
Get Agent Names and Agencies Within Postal Code
Get Agents Request
Get Agencies Request
For the Integration Services Layer, DETs should be based on the fields that cross the boundary from the Presentation Layer and the Point Solutions Layer. Analyze the services that were called by the Presentation Layer as well as all the services that are executed to help identify the fields. Look at the fields that are sent and returned and apply the IFPUG counting rules for logical, non-repeating fields. FTRs will be based off the ILFs and EIFs previously identified.
Utilizing the Function Point Results
The section describes how the results of the function point analysis should and should not be used. The function point analysis derived by segmenting a project within a SOA Environment provides a size, in an industry
standard measure, to the work that needs to be performed, at the segmented layer level. This FP value can be useful in estimating as well as determining the magnitude of the work performed for each layer. It is important to understand that the function point analysis results are relevant only at the individual, segmented layer level. Due to how the boundary and user view are determined for the layers, the summation of the counts from all the segments will yield an inaccurate and inflated overall project and/or application size. To obtain a true project and/or application size, a separate analysis must be performed based solely on the boundary and user view for the entire scope of work and/or application, not the individual layers. This count should be inclusive of all the layers from Presentation thru Point Solutions and represent the user view of the end-users and business users. When utilizing the FP size, at the layer level, in calculations with other metrics, like effort, duration, defects, changes, etc. it is critical not to aggregate values across layers. In order to provide meaningful results, any data analyzed in conjunction with a layer’s FP size should be collected, analyzed, and reported at the same level as the FP size.
Conclusion
Function Point Analysis can be applied in a Service-Oriented Architecture environment. Function point analysis sizes the functionality being provided to the user, and an application in a SOA environment provides users functionality. By segmenting the layers within a SOA environment, it is possible to determine a meaningful size of the work performed for each layer. Care must be exercised not to sum the individual counts at the overall project level or application level. The approach outlined in this paper provides the mechanism by which function point analysis can be applied to a SOA based project.
EDS INTERNAL DOCUMENT
EDS and the EDS logo are registered trademarks of Hewlett Packard Inc. © 2009 HP. All rights reserved
Notes
1 – International Function Point Users Group, Function Point Counting Practices Manual v4.2.1 pg. G-4 2– International Function Point Users Group, Function Point Counting Practices Manual v4.2.1 pg. G-4 3– International Function Point Users Group, Function Point Counting Practices Manual v4.2.1 pg. G-3 4– International Function Point Users Group, Function Point Counting Practices Manual v4.2.1 pg. 2-3 5– International Function Point Users Group, Function Point Counting Practices Manual v4.2.1 pg. 5-2 6– International Function Point Users Group, Function Point Counting Practices Manual v4.2.1 pg. 4-2 7– International Function Point Users Group, Function Point Counting Practices Manual v4.2.1 pg. 4-2 8– International Function Point Users Group, Function Point Counting Practices Manual v4.2.1 pg. G-2 9– International Function Point Users Group, Function Point Counting Practices Manual v4.2.1 pg. G-1 10– International Function Point Users Group, Function Point Counting Practices Manual v4.2.1 pg. G-7 11– International Function Point Users Group, Function Point Counting Practices Manual v4.2.1 pg. G-2 12– International Function Point Users Group, Function Point Counting Practices Manual v4.2.1 pg. G-2 13– International Function Point Users Group, Function Point Counting Practices Manual v4.2.1 pg. G-6 14– International Function Point Users Group, Function Point Counting Practices Manual v4.2.1 pg. G-7 15– International Function Point Users Group, Function Point Counting Practices Manual v4.2.1 pg. 7-5 16– International Function Point Users Group, Function Point Counting Practices Manual v4.2.1 pg. G-4 17– International Function Point Users Group, Function Point Counting Practices Manual v4.2.1 pg. G-7