How Representative are Google Consumer Surveys?: Results
from an Analysis of a Google Consumer Survey Question
Relative National Level Benchmarks with Different Survey
Modes and Sample Characteristics
Erin R. Tanenbaum1, Parvati Krishnamurty, and Michael Stern
NORC at the University of Chicago, 55 East Monroe St., 30th Floor, Chicago, IL 60603 Abstract
The decrease in coverage for traditional random digit dialing (RDD) samples is well documented (e.g., Blumberg, et al. 2011). The decline in landline connections, particularly for young people, makes coverage especially problematic (Keeter et al., 2007). Although mobile phones can be added to landline sample frames to increase coverage, this dual frame approach introduces challenges, as they are more prone to nonsampling errors in comparison to RDD and are often counted against the respondent's minutes (Brick, et al. 2011). Non-probability Web-based supplements have been suggested as a means to reducing problems with RDD coverage and picking up cell-only households without respondent-side costs. However, this brings new questions. First, do we find cell-only households among non-probability Web samples? Second, how do Web-based results differ from national level random sample results? Third, how demographically different are the samples from mode varying probability samples? In this paper, we present an analysis of a series of Google Consumer Survey questions including home cell-phone usage and compare the results to those from three national-level random sample surveys.
Key Words: Web survey, Google Consumer Survey, coverage, cell-only households, non-probability sample, bias
1. Background
Methods used to collect demographics, opinions, and behaviors have evolved since the advent of survey research, and emerging challenges have necessitated the development of new methods aimed at increasing the representativeness and accuracy of survey estimates. Initially, face-to-face interviewing dominated the field, yielding high response rates and fairly representative samples. However, the costs of face-to-face interviewing have increased dramatically during the 1970s (De Leeuw and Collins 1997), prompting researchers to explore alternative methods, including mail surveys (Dillman 1978), telephone random digit dial (RDD) surveys, and other collection mechanisms. For the last 30 years, RDD has been the predominant mode of data collection due to cost and time
1
efficiencies as well as its perceived comparability to face-to-face data quality (e.g., Groves and Kahn 1979). However, landline telephone survey coverage has diminished as new technologies have emerged and more Americans have given up their landline phones. In fact, cell-only households represent over 35 percent of all households in the United States as of June 2012. Over half of all adults age 18 to 34, 58 percent of all renters, and 52 percent of all adults living in poverty now live in cell-only households and the number of cell-only households only continues to rise (Blumburg, et al, 2012). In response, methods utilizing these new technologies are being explored for survey respondents who are no longer covered by traditional RDD methods. Although mobile phones can be added to landline sample frames to increase coverage, this dual frame approach introduces challenges, because mobile phone frames are more prone to nonsampling errors in comparison to RDD and calls are often counted against the respondent's minutes (Brick et al. 2011). In addition, cell-only surveys are more costly for both surveyor and respondent. Non-probability Web-based supplements have been proposed as an effective means to reduce problems with RDD coverage. This also allows capture of data from cell-only households without costs to respondents.
It has also been noted that cellphone users often also access the Internet, including, but not exclusively, through mobile devices. Pew estimates that 91 percent of Americans are now cell phone owners, and that 57 percent of all Americans go online using a mobile phone (Duggan and Smith 2013). This suggests that a large number of mobile users (and by extension, cell-only households) have access to the Internet. However, non-probability Web-based surveys should first be tested and compared against traditional methods before considering a web-first approach.
The idea of using a Web-based supplement (for any other mode of survey) is not new, as select surveys by the Bureau of Labor Statistics, the US Census Bureau, and other government agencies currently offer an alternate Web-based response option (Fox, et al., 2004). These Web-based options have also been fueled by the growth of computer usage - 76 percent of households reported having a computer and 72 percent of households reported accessing the Internet according to the 2011 Current Population Survey (CPS) Internet use supplement (File 2013). Yet, the effects of using a non-probability Web-based supplement for traditional surveys have not been explored in great depth.
There are many ways to administer non-probability Web-based surveys including the use of panels, opt-in online polls, pop-up advertisements, and so on. Typically, sampling, questionnaire design and non-response weighting are used to ensure a quality survey. While the most online non-probability tools may not offer these strategies, making it difficult to obtain a representative sample, it does have some compensatory advantages, especially cost and time-effectiveness. As such, non-probability Web-based survey panels have been in use for years, especially in market research, political polling, and academia. In response to the rise in popularity of this method despite its known limitations, AAPOR has strongly cautioned against the use of non-probability Web-based surveys when a key research objective is to accurately estimate population values because
of the inherent biases (Baker, et al., 2013). They do, however, mention that the “most promising non-probability methods for surveys are based on models that try to deal with challenges at both the sampling and estimation stages.” (Baker, et al., page 6, 2013) This paper examines sampling and estimation biases associated with a non-probability Web-based sample, as a means of ascertaining the applicability of this method for traditional survey needs. In particular, we present an analysis of data collected from Google Consumer Survey and compare the results to three benchmark national-level random sample surveys. Through the analysis we seek to determine: 1) if cell-only households can be found among non-probability Web samples; 2) if Web-based results differ from national level random sample results; and 3) if results are demographically different from mode varying probability samples.
2. Data and Methods
Google Consumer Surveys offer researchers an inexpensive option to field surveys of either one or two questions using an online platform. Google Consumer Surveys operate through targeting Internet users who seek to access “premium content,” including news articles, videos, or other websites that would otherwise require a payment or subscription to access the content. The publishers of these websites have agreed to allow Google to administer questions to their users through a corporate agreement wherein Google pays the publisher for access to the potential respondents. In exchange, the respondent gains access to the content for free. The questions appear as prompts when users try to access the premium content; this prompting is also known as a “survey wall” since respondents must either answer the question or click an X to remove the question from their screen. Google uses an algorithm to properly distribute the questions across the publishers’ networks. As of March 2013, there were over 80 sites in their networks, and more than 30 under review. The network is diverse in terms of content and excludes offensive sites. The average response rate was 16.75 percent according to a recent Pew report (Keeter, et al., 2012).
Researchers may either ask a single question or two. In two-question surveys, the first question is a screening question and must generate a simple yes/no response. Prior to fielding the surveys, Google reviews all questions submitted by researchers. Some questions are not approved including demographics and sensitive topics such as immigration status, sexual behavior or orientation, sensitive financial or health related information. Additionally, questions cannot target respondents under the age of 18 years. Survey respondents are selected based on a stratified sample approach. Researchers may either opt for a representative sample or a targeted sample based on a particular respondent characteristic. To create a representative sample, probability based Web surveys typically select respondents using sample frames with limited coverage issues, recruit respondents using traditional methods (mail, telephone), and then request that respondents answer the survey online. By contrast, Google Consumer Surveys offers a
hybrid approach using a survey of convenience (respondents who are attempting to access premium content) coupled with stratification using inferred demographic and geographic information. Google’s inferred demographics are based on DoubleClick cookies coupled with the respondent’s IP address, from which they make an educated guess about the respondent’s location, age, gender, and income based on keyword searches and webpages visited. However, these demographics are based on algorithms, which are not entirely accurate (Keeter, et al., 2012). Possible problems arise when for example respondents use a shared computer in which case the inferences made are for a combination of users. In addition, although inferences may be made based on visiting for instance a gossip web site, a certain amount of uncertainty still remains about the true characteristics of the respondent.
As of March, 2013, a 1,500-response survey typically returned survey results in about 36 hours. Google Consumer Surveys currently advertises results for 1,500 respondents in 7 days or less. A single-question survey costs $0.10 per response, or $150, whereas targeted surveys (2 questions or demographic targeting) cost $0.50 per response.
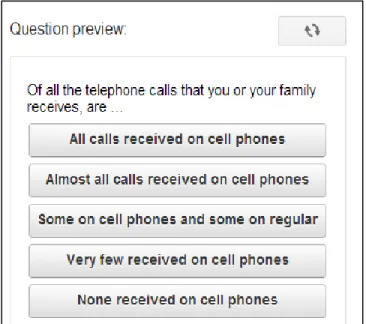
We chose to ask a single question on a topic that had been fielded in two nationally recognized surveys for a representative sample of the U.S. internet population. The question we selected originated from the Pew Research Center’s Internet & American Life Project (PEW) and a similar question was also found in the National Health Interview Survey (NHIS). Figure 1 shows the question preview of our survey provided by Google during the creation process. To account for the differences between benchmark survey response options, the results were grouped prior to analysis into three categories: most or all cell phone, some cell, some regular, and most or all regular phone
Figure 1: Example of the instrument in Google Consumer Surveys (Google)
Google Consumer Survey weights are based on inferred age, gender, and region and are weighted to represent the U.S. population of adults obtained from the most recent Current
Population Survey (CPS) Internet use supplement (McDonald 2012). These were not available when our study was conceptualized, so we planned to explore variables such as age, gender, income, and region for weighting. NORC weights were also weighted to the Current Population Survey (CPS) Internet use supplement as well as to the Pew Research Center’s Internet & American Life Project for comparability using Google’s inferred demographics. Google Consumer Survey results were then compared against the benchmark studies overall, the alternate weights, and by demographic and geographic characteristics.
3. Data Quality Assessment
Prior to addressing our main analysis questions, we first assessed the results provided by Google Consumer Surveys. The survey results delivered included a survey weight, the respondent’s answer, the time of the response, as well as the inferred demographic and geographic information on gender, age, geography (location encoded as a string with [Country]-[Region]-[State]-[City]), urban density and income. The inferred characteristics are provided to Google by DoubleClick and estimated based on cookies from the web sites that a particular computer has recently referenced. Keeter, et al,. (2012) assessed age and gender and found that 75 percent of the inferred genders of the participants matched survey results, whereas only 44 percent of inferred ages matched survey results. Other inferred characteristics were not assessed, but may offer similar match rates.
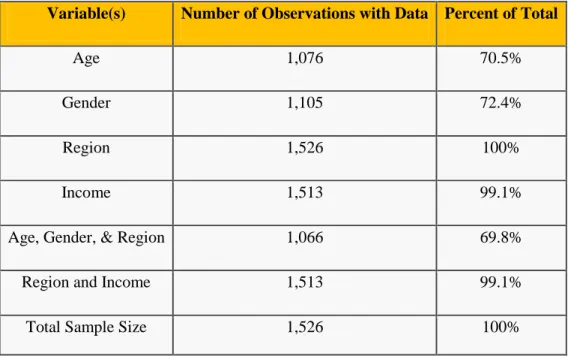
In addition to the potential problems with inferred characteristics, NORC found that a large number of respondents were missing inferred information, and thus were also missing Google Consumer Survey weights. In total, over 30 percent of all responses were missing a weight, which suggests a lost opportunity for analysts wishing to work with weighted responses. We assessed missing rates by characteristic and combination of characteristics and found that 99 percent of all survey responses could have been weighted if the weights were based on income and region instead of age, gender and region (see Table 1). Unfortunately, we do not have an assessment of the accuracy for inferred region or income, but propose that creating survey weights with these variables would add value to the analysis.
Table 1: Data Missing Rates by Variable and Combination of Variables
Variable(s) Number of Observations with Data Percent of Total
Age 1,076 70.5%
Gender 1,105 72.4%
Region 1,526 100%
Income 1,513 99.1%
Age, Gender, & Region 1,066 69.8%
Region and Income 1,513 99.1%
Total Sample Size 1,526 100%
We also reviewed the coverage of respondents based on their inferred state. To assess the coverage we compared the distribution of respondents against a target population: U.S. adults with Internet access from the Current Population Survey (CPS) Internet use supplement (October 2010). An index was created to assess the over or under representation of the population as follows:
A heat map was created based on the index (see Figure 2). In this figure, dark green indicates oversampling, whereas light green indicates under-representation. New Mexico and Washington, DC were the most likely to be found in our survey results (index of 638 and 526 respectively), whereas responses from Vermont and Wyoming were the most under-represented states (index of 31 and 35 respectively). Also of note, upon review of the heat map, it is clear that the plains states were oversampled including Minnesota, Iowa, North Dakota, South Dakota, and Nebraska (index of 244, 122, 151, 130, and 134 respectively). Google Consumer Survey weights are based on region, not state, and thus if a particular survey question were not homogenous within a region, this may impact the results in a manner that requires post stratification to correct.
Figure 2: Heat map of Google Consumer Survey Sample Distribution compared to the 2010 Census Population Estimates.
4. Results
Given the decrease in landline households, our analysis examined whether cell-only households could be found in the expected proportion or greater among Google
Consumer Survey results (see Table 2). The distribution of telephone calls received was compared against several benchmarks, as well as two alternative weighting
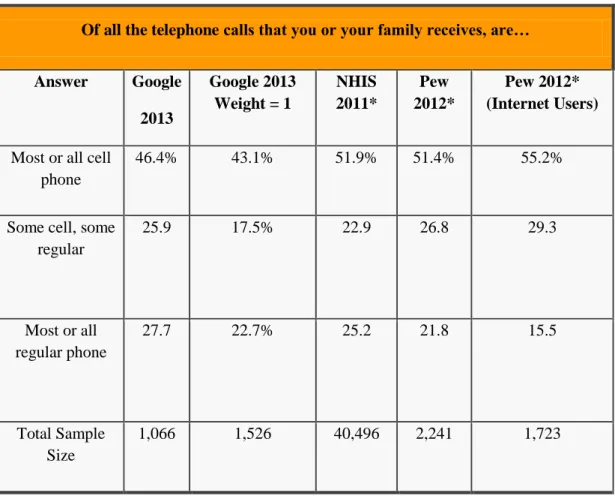
methodologies (weight of 1 and weights using income and region) using a Chi-Squared test statistic. Although cell-only households were found in Google Consumer Survey results, the distribution was found to be statistically different from our probability-based samples. The number of Google Consumer Survey respondents in cell-only households was lower than expected. In fact, 46 percent of all Google Consumer Survey respondents were cell-only households, which is well below NHIS’ estimate of 52 percent. Neither weighting by region and income (not shown) nor using a weight of one changed the outcome. Both methods did however increase the overall sample size available from Google Consumer Surveys’ weights. Although cell-only households continue to grow in the United States, and the benchmark results were older than our survey responses, one cannot conclude that this time lag led to the results being statistically different.
Table 2. Comparison of Google Consumer Survey Results with Others
Of all the telephone calls that you or your family receives, are…
Answer Google 2013 Google 2013 Weight = 1 NHIS 2011* Pew 2012* Pew2012* (Internet Users)
Most or all cell phone
46.4% 43.1% 51.9% 51.4% 55.2%
Some cell, some regular 25.9 17.5% 22.9 26.8 29.3 Most or all regular phone 27.7 22.7% 25.2 21.8 15.5 Total Sample Size 1,066 1,526 40,496 2,241 1,723
Note: all results are weighted unless otherwise specified. Google 2013 results exclude cases without a weight. All survey results exclude unknown cell usage.
*NHIS survey results based on the 2011 fielding period. Pew survey results based on survey results from March 15 to April 3, 2012 of the Pew Research Center’s Internet & American Life Project.
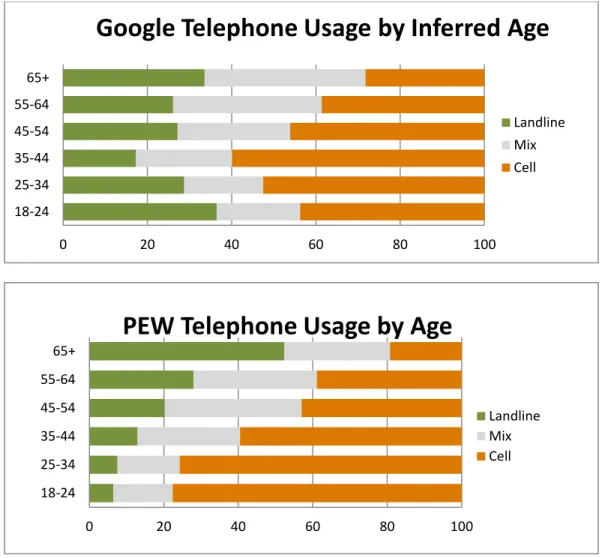
Results were further examined by demographic characteristics (age, region, gender, urban density, and income) and compared against Pew 2012 results. Figure 3 shows phone usage results graphed by inferred age (Google Consumer Survey) or respondent’s age (Pew). The characteristics of these two result sets were markedly different, and this difference was most profound for the lowest age brackets. Other demographic characteristics were also reviewed and all Google Consumer Survey results showed different trends than Pew’s survey results including a review by gender, region, and income (not shown).
Figure 3. Results Graphed by Age and Phone Usage. Google results represent Google Consumer Survey results fielded in March, 2013, the y-axis is inferred age of the respondent and the x-axis is the distribution of telephone usage. Pew results were fielded from March 15 to April 3, 2012 through the Pew Research Center’s Internet & American Life Project survey. The y-axis is the respondent’s age and the x-axis is the distribution of telephone usage. Results exclude respondents with unknown age or telephone usage.
5. Discussion
Google Consumer Surveys have a number of obvious advantages over other methods, including cost and time savings, as well as high response rates owing to the user friendliness of the vehicle and the anticipated value of targeted incentives on response rates. Nonetheless, before adopting novel methods such as this, it is vital to establish the validity of this new approach against known and trusted benchmarks. Both positive and negative features must be carefully examined and considered when using Google Consumer Surveys. 0 20 40 60 80 100 18-24 25-34 35-44 45-54 55-64 65+
Google Telephone Usage by Inferred Age
Landline Mix Cell 0 20 40 60 80 100 18-24 25-34 35-44 45-54 55-64 65+
PEW Telephone Usage by Age
Landline Mix Cell
Our work elucidated a number of notable features for researchers considering utilizing this method, including the impact of weighting factors and the accuracy of survey results compared to benchmarks overall and by inferred demographics. The coverage varied by state, for reasons not completely understood, but believed to be related to Google’s stratification methods. Weights were sparse (not provided for 30 percent of respondents) owing to missing inferred demographic data, This impacted the potential sample size which partially offsets the cost gains achieved using this method. Previous literature also suggests that the inferred demographics may not be fully accurate (Keeter et. al. 2012). Though we did not address this specific issue here, the differences seen in the youngest age brackets in Figure 3 also suggest that this may be the case.
While a number of shortcomings were identified, our overall conclusion is that Google Consumer Surveys may be a useful supplement to existing surveys. The authors still strongly support the use of probability based sampling techniques except in select circumstances. As Google continues to improve the methodologies underlying the Google Consumer Survey including the algorithms, weights and inferred demographics, these improvements will further increase the value of this tool to researchers.
References
Baker, Reg, Brick, J. Michael, Bates, Nancy A., Battaglia, Mike, Couper, Mick P., Dever, Jill A., Gile, Krista J., Tourangeau, Roger. June 2013. Report of the AAPOR Task Force on Non-Probability Sampling. WEB LINK
http://www.aapor.org/AM/Template.cfm?Section=Reports1&Template=/CM/ContentDis play.cfm&ContentID=6055
Blumberg, Stephen J., and Luke, Julian V. 2012. Wireless Substitution: Early Release of Estimates From the National Health Interview Survey, January–June 2012. Report by the U.S. Centers for Disease Control and Prevention, December 12, 2012. WEB LINK
http://www.cdc.gov/nchs/data/nhis/earlyrelease/wireless201212.pdf
Couper, Mick P. 2005. Technology Trends in Survey Data Collection, Social Science Computer Review; 23; 486 DOI: 10.1177/0894439305278972.
Duggan, Maeve, Smith, Aaron. 2013. Pew Research Center: Cell Internet Use 2013.
WEB LINK:
http://pewinternet.org/~/media//Files/Reports/2013/PIP_CellInternetUse2013.pdf
File, Fox. May 2013. Computer and Internet Use in the United States: Population Characteristics, WEB LINK: http://www.census.gov/hhes/computer/
Fox, J. E., Mockovak, W., Fisher, S. K., & Rho, C. April 2004. Usability Issues Associated with Converting Establishment Surveys to Web-Based Data Collection, In Statistical Policy Working Paper 38: Summary Report of the FCSM-GSS Workshop on
Web-Based Data Collection, Pp. 63-74. WEB LINK
http://www.bls.gov/ore/pdf/st030320.pdf; or http://www.fcsm.gov/working-papers/spwp38.html for the entire report
Google Consumer Survey Written by NORC and conducted using Google Consumer Surveys, March, 2013.
Keeter, Scott and Christian, Leah. 2007. How Serious Is Polling’s Cell-Only Problem? The Landline-less Are Different and Their Numbers Are Growing Fast. WEB LINK
http://www.pewresearch.org/2007/06/19/how-serious-is-pollings-cellonly-problem/ Keeter, Scott and Christian, Leah. 2012. A Comparison of Results from Surveys by the Pew Research Center and Google Consumer Surveys. Accessed on November 9, 2012. WEB LINK http://www.people-press.org/2012/11/07/a-comparison-of-results-from-surveys-by-the-pew-research-center-and-google-consumer-surveys/
McDonald, Paul, Mohebbi, Matt, and Slatkin, Brett. 2012. The New Online Era of Consumer Surveys: Bucking tradition, Google introduces its ‘three-legged stool’ Internet survey model. marketingpower.com.
Pew Internet and American Life Project: Pew Research Center. PIP Social Networking and our lives. Accessed July 18, 2012. http://www.pewinternet.org/Press-Releases/2011/Social-networking-sites-and-our-lives.aspx.
Pew Internet and American Life Project: Pew Research Center. Trend Data (Adults). Accessed on July 24, 2012. http://www.pewinternet.org/Trend-Data-(Adults)/Whos-Online.aspx.
Stern, Michael J. and Bryan D. Rookey. 2013. The Politics of New Media, Space, and Race: A Socio-Spatial Analysis of the 2008 Presidential Election. New Media & Society.
Terhanian, George. 2012. A Work in Progress: Google enters the market research field with a technology play and a representativeness claim marketingpower.com.