93
TRITICALE, ALTERNATIVE PLANT TO WHEAT CROPS ON SANDY
SOILS IN ROMANIA
DRAGHICI IULIAN1, RETA DRAGHICI1, MIHAELA CROITORU1
1
Research - Development Center for Field Crops on Sandy Soils, Dabuleni
Key words: drought, genotypes, standard deviation, quality, profit ABSTRACT
The recent climate changes have determined agricultural drought in the sandy soils with negative implications on plant growth and development. In this context during 2009-2011 were experienced in RDCFCSS Dabuleni every 12 genotypes of wheat and triticale in purpose recommendation a straw cereals in crop rotations on sandy soils. The results obtained show that triticale manifest better tolerance to drought, recording higher values of bound water with 0.64% and 0.55% of cellular juice concentration compared to wheat. Mean standard deviation, obtained production in wheat varieties (σ = 371 kg / ha) and triticale (σ = 130 kg / ha) emphasizes best stability in the behavior of triticale varieties. Compared with wheat, triticale has registered an increase in production of 1033.9 kg / ha and a profit rate of between 25.03 to 52.59% ,(profit rate of wheat genotypes was between -9.72% and 19.5%).
INTRODUCTION
Due to low natural fertility and climatic conditions characterized by excess thermal and insufficient precipitations, sandy soils area can be characterized as an agricultural area with handicap, farmers having access to a reduced range of crops to ensure exploiting the soil in terms of profitability. In the past decade, increased drought in southern Romania led to a chronic phenomenon in southern Oltenia Plain, especially in the sandy soils.
Transition to a decentralized system of agriculture, requiring rethinking and reorientation of research in capitalization the natural reduced fertility of sandy soils by finding alternative plants that are more tolerant to drought. Research by T. Hura et al., 2011 emphasizes that triticale plant can adapt to drought conditions as early as intense growth phase due to inhibition of carbohydrate utilization and maintenance of cellular osmotic potential at high level. To wheat culture in return results in tropical areas of M.L. Praba et al. in 2009, emphasizes that the growth phase plants should be irrigated after 13 days when soil humidity decreases to 30% of field capacity water compared to rice when irrigation should be performed after 9 days. The same research indicates that wheat plant is significantly affected when drought occurs in the reproductive phase.
94
Research conducted during 2009 - 2011 to RDCFCSS Dabuleni were aimed at reorienting in capitalizing the sandy soil to new plant species, that, through the results obtained, to mitigate the negative effects of climate change, taking into study every 12 genotypes of wheat and triticale in order to develop efficient cultivation of straw cereals in crop rotations on sandy soils, considering inconstant in wheat yields as a result of climate change lately.
MATHERIAL AND METHODS
In order to streamline the cultivation of cereal straw in crop rotations from sandy soils was studied in RDCFCSS Dabuleni, during 2009 - 2011, the behavior of 12 genotypes of wheat and 12 triticale genotypes. The research was conducted under conditions of irrigation on a sandy soil characterized by humus content in the range between 0.66 to 1.05% and a pH (H2O) 5.4 to 6.9.
They carried observations and determinations of vegetation period, resistance to infection with pathogens, limits and variation of physiological and productivity parameters, production and quality. Physiological and quality analyzes were carried out in the field and laboratory by standard methods. Research results obtained were interpreted by analysis of variance and with statistical functions.
RESULTS AND DISCUTIONS
Analysis of climate conditions for the period 1956-2011 by Walter-Lieth climogramme outlines clearly this phenomenon of dryness and drought on the sands of southern Oltenia: Average annual intervals such phenomena being represented graphically the by the curve interfering with the average air temperature of precipitations scale 1/2 for droughts and scale 1/3 for the phenomena of dryness. According to this graphics in the sandy soils of the Dabuleni, from May to September is highlighted period of drought and drought is accentuated in August and installed dry period (Fig. 1). Association meteorological drought, characterized by decreased precipitations below normal levels, with atmospheric drought, characterized by long periods without rainfall and relative humidity reduced determine the appearance agricultural drought that causes partial or total compromise of crops, including wheat which has requirements high than water, compared with triticale.
Figure 1 Climatic conditions in 1956-2011 period, registred at Dabuleni weather station (Walter-Lieth Climogramme)
Biometric determinations carried out in wheat and triticale genotypes, show their variability depending on the genotype studied in species. Average of determinations on
-6 9 24 39 54 69 84 99
-2 3 8 13 18 23 28 33
X XI XII I II III IV V VI VII VIII IX
A
v
er
ag
e
tem
pe
ra
tu
re
(
0C
)
Average temperature in air 1956-2011 (0C)
Average precipitations 1956-2011(mm) scale 1/3
Average precipitations 1956-2011(mm) scale 1/2
16 26 36
46
56
66
6
0 scale 1/2 scale 1/3
drought period
95
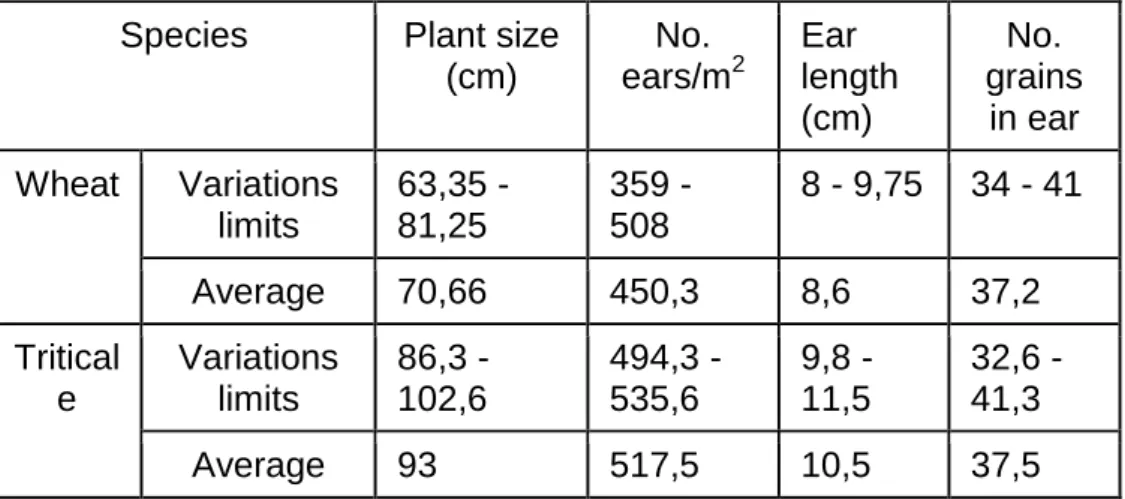
plant size, number of ears at harvest, ear length and number of grains in ear recorded higher values in triticale compared to wheat (Table 1). In the same environmental conditions, the vegetative and productive growth values registered in triticale highlights its better adaptability to the ecopedological conditions of the area sandy soils.
Table 1.
Variability of biometric determinations to wheat and triticale genotypes tested on sandy soils
Species Plant size
(cm)
No. ears/m2
Ear length (cm)
No. grains
in ear
Wheat Variations
limits
63,35 - 81,25
359 - 508
8 - 9,75 34 - 41
Average 70,66 450,3 8,6 37,2
Tritical e
Variations limits
86,3 - 102,6
494,3 - 535,6
9,8 -11,5
32,6 - 41,3
Average 93 517,5 10,5 37,5
Water regime of plants is one of the determinants of to the normal conduct of the entire metabolism of plants, thus having great physiological role. Between the vegetation phenophases, the growth and the flowering are most sensitive affected by water shortages, processes that stop to hydration degree is sufficient however respiration and photosynthesis. Triticale research at T. Hura et al., 2011 show that the plant is subjected to water stress early as spring, young growth phase, the resistance is greater during blossoming. Stress determine the increase of telluric acid in cell walls of leaves, that inhibits growth the leaf surface and thus water loss through perspiration. The results obtained to triticale and wheat under sandy soils show that water content varies with plant species, with age, the body or even tissue. Unfavorable environmental conditions, the vital activity of plants is reduced, triticale registered higher values with 0.64% of the quantity of bound water and juice cellular concentration of 0.55% compared to wheat, showing a greater resistance to triticale plants to drought conditions (Table 2).
Table 2.
Variability of physiological determinations of wheat and triticale genotypes tested on sandy soils
Species Free water
(%)
Bound water
(%)
Dry substance (%)
Juice cellular concentration
(%)
Wheat Variations
limits
57.32 – 58.56
3.52 - 4.2
37.31 – 38.80 13.3 – 14.6
Average 57.75 3.84 38.41 13.8
Triticale Variations limits
56.49 – 59.02
4.09 – 4.76
36.52 – 48.03 13.35 – 14.55
96
Figure 2. Correlation between genotype and the vegetation period to wheat and triticale
Table 3
Results of production obtained to wheat and triticale in sandy soil conditions No.
var.
Wheat TRITICALE
Genotypes Production Genotypes Production
Kg/ha % Kg/ha %
1 Flamura 85 2805 89 Plai 4328 103,8
2 Lovrin 34 3192 99,8 Titan 3771 90,5
3 Alex 3029 96,6 Stil 4310 103,4
4 Simnic 30 2723 86,9 Gorun 4124 98,9
5 Albota 69 3066 97,8 Haiduc 4266 102,3
6 Boema 3607 115* Cascador 4207 100,9
7 Crina 2890 92,2 Migrator 4188 100,4
8 Delabrad 3308 105,5 Matroz 4412 105,8
9 Dor 2728 87 Negoiu 4604 110,5*
10 Faur 3268 104,2 Nera 4005 96,1
11 Glosa 3605 115,0* Nedeea 3788 90,8
12 Ciprian 3382 107,9 TF 2 4006 96,1
Average (control)
3133,6 100 4167,5 100
LSD 5% LSD 1% LSD 0,1%
435 kg/ha 595 kg/ha 793 kg/ha
13,8% 18,9% 25,3%
LSD 5% LSD 1% LSD 0,1%
318 kg/ha 450 kg/ha 573 kg/ha
7,6% 10,8% 13,7%
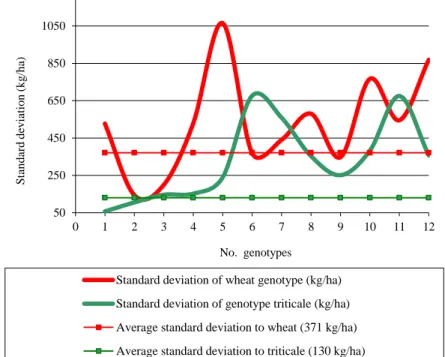
The standard deviations values calculated for productions to wheat and triticale varieties experienced in three years emphasizes a better stability in behavior to triticale varieties compared to wheat varieties (Fig. 3).
228,6
227,1
y = 0,0693x2 - 0,6867x + 229,32 r = 0,594*
y = 0,0528x2 - 0,6325x + 228,37 r = 0,676*
220 222 224 226 228 230 232 234
1 2 3 4 5 6 7 8 9 10 11 12
V
eg
et
a
ti
o
n
p
er
io
d
(d
a
y
s)
Genotipuri
Wheat vegetation period Average wheat
Triticale vegetation period Average triticale
97
The vegetation period, both at wheat and as well as triticale is dependent on genotype experienced and is emphasized in statistically by a significant correlation (r = 0.594 to 0.676) (Fig. 2). The results looks a little early to triticale compared with wheat and variety choice depending on the vegetation period of can be a measure of avoiding of drought or dryness periods on sandy soil area.
Under the aspect grain production obtained to wheat crop detaches Boema and Glossa varieties with the production differences statistically significant as compared to the average varieties. In triticale variety Negoiu noted at the difference from the average production registered varieties is significant. Analysis of the production results highlights
Figure 3 Standard deviation to production obtained from 12 genotypes of wheat and triticale tested on sandy soils
Table 4
The grains qualities to some genotypes of wheat and triticale tested on sandy soils
No. var.
WHEAT TRITICALE
Genotypes
Crude protein
Genotypes
Crude protein % dry
substance kg/ha
* % dry
substance kg/ha
*
1 FLAMURA
85 15,4 371 TITAN 15,5 503
2 BOEMA 14,3 444 STIL 12,4 460
3 DELABRAD 14 398 GORUN 13,8 489
4 FAUR 14,1 396 HAIDUC 12,4 455
5 GLOSA 13,7 425 CASCADOR 12,7 459
6 CIPRIAN 14,2 413 NEGOIU 13,4 530
Average 14,28 407,8 Average 13,36 466
*
Protein per hectare was calculated to 86% dry substance
50 250 450 650 850 1050
0 1 2 3 4 5 6 7 8 9 10 11 12
S
ta
n
d
ar
d
d
ev
ia
ti
o
n
(
k
g
/h
a)
No. genotypes
Standard deviation of wheat genotype (kg/ha)
Standard deviation of genotype triticale (kg/ha)
Average standard deviation to wheat (371 kg/ha)
98
a difference of production 1033.9 kg / ha obtained in plus to triticale towards wheat (Table 3).
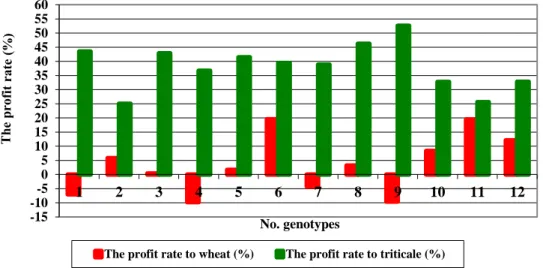
Figure 4 Economic efficiency of wheat and triticale varieties tested on sandy soils
The quality analyzes concerning to percentage of crude protein in grain (Table 4), emphasize quality wheat varieties with an average of 14.28%, compared with the average achieved by varieties of triticale (13.36%). Reported per hectare the quantity of protein obtained detaches net triticale crop towards wheat crop. Of economically is highlighted all triticale genotypes through profit rate ranging from 25.03 to 52.59% compared with wheat genotypes that profit rate was between -9.72% and 19.5 % (Fig. 4). At a production cost of 1810 RON / ha and a price capitalization of 0.6 RON/kg in 2011, the results obtained to wheat genotypes studied emphasize a profitability the wheat crop to a production of at least 3000 kg / ha.
CONCLUSIONS
Analysis of climatic conditions in the sandy soil, during 1956-2011, with Walter - Lieth climogramme outlines the present phenomena of drought during May to September and dryness in August;
Have been highlighted the greater resistance of triticale plant to drought conditions, by registering the higher values of quantity of bound water with 0.64% and with 0.55% of cells juice concentration, compared to wheat;
Mean standard deviation (σ = 371 kg / ha for wheat and σ = 371 kg / ha, triticale) emphasizes best stability in behavior varieties of triticale compared to wheat; Triticale crop has registered an production increase of 1033.9 kg / ha, compared to wheat, standing out through statistically production differences, compared with the average varieties of wheat genotypes (Bohemia and Glossa (3605-3607 kg / ha), and in triticale genotype Negoiu 4604 kg/ha);
Triticale has registered 455-530 kg crude protein / ha and wheat has registered the 371-444 kg crude protein/ha;
From an the economically have been highlighted all triticale genotypes through profit rate ranging from 25.03 to 52.59% compared with wheat genotypes, at that profit rate was between -9.72% and 19 5%.
-15 -10 -5 0 5 10 15 20 25 30 35 40 45 50 55 60
1 2 3 4 5 6 7 8 9 10 11 12
No. genotypes
99
BIBLIOGRAPHY
Bogdan, Octavia, Niculescu, Elena,. Dryness and drought phenomena in
Romania, RRG - Geografie, 39, Bucureşti, 1995.
Bonastre Oliete, Gabriela T. Pérez, Manuel Gómez, Pablo D. Ribotta, Malena Moiraghi, Alberto E. León. Use of wheat, triticale and rye flours in layer cake production. International Journal of Food Science & Technology. Volume 45, Issue 4, pages 697–706, 2010
Hura T., K. Hura and M. Grzesiak. Soil Drought Applied During the Vegetative Growth of Triticale Modifies the Physiological and Biochemical Adaptation to Drought During the Generative Development. Journal of Agronomy and Crop Science. Volume 197, Issue 2, Pages: 113–123, 2011
Ittu, Gh., Saulescu, N.N., Ittu, M., Mustatea, P. Introduction of short straw genes in romanian triticale germoplasm. Romanian Agricultural Research 24, 7-10, 2007.
Pomas M. S., Posmaj R.. Breeding triticale for sprouting resistanceand baking quality. Proc of th. International Simposyum Stellenbasch, South Africa, 3-7 sept., p. 60, 2006
Praba, M.L. J.E. Cairns, R.C. Babu, H.R. Lafitte. Identification of Physiological Traits Underlying Cultivar Differences in Drought Tolerance in Rice and Wheat. Journal of Agronomy and Crop Science. Volume 195, Issue 1, pages 30–46, 2009.
Tudose Sinescu, Vasilichia. Ecological research on Triticosecale crops. Teza de
Doctorat, Univ . Pitesti, Facultatea de Stiinte profi Biologie. Semanatorul, Ed. Online. P. 14-17, 2010.
Voica, Maria. Stability production of new varieties of winter wheat and triticale in la S.C.D.A. Pitesti Albota Anale I.N.C.D.A. Fundulea, VOL. LXXVII, 2009 Genetica si ameliorarea plantelor. p. 14-23, 2009.