Journal of Global Pharma Technology
Available Online at:
www.jgpt.co.in
RESEARCH ARTICLE
Analytical Study for the Ability of Some Polymers to Gain
Transitional Elements Ionsions in Different Temperature, PH
Acidity Functional and Time Situations
Qadoori Z. Khalaf1, Hamid M. Saleh2, Abdulrahman R. Mahmood
3*1. AL- Iraqia University /College of Education/Iraq.
2. Tikrit University/ College of Basic Education-Sharqat/Iraq.
3. University of Baghdad/College of Education for Pure Science (Ibn-Al-Haithem)/Iraq.
*Corresponding Author:Abdulrahman R. Mahmood
Abstract
The compound [K1] was synthesized from the reaction of dichloromethane with linear alkyl benzene (Lab9) using ethanol as a solvent, and from(chloro methyl)-4-nonylbenzene) [K1] it was possible to synthesize the compound Z(4-(nonan-3-yl)phenyl) methane amine) [K2] containing the amine group by synthesized from [K2] reaction with appropriate phenolic aldehydes and using Ethanol as a solvent in the preparation of vinyl chloride4-(((4-nonylbenzyl)imino)methyl)phenol-4-(((4-nonylbenzyl)imino methyl)benzene-1,3diol) [K3-K4] bases has been used. Preparation of a number of Phenolic polymers4-(2-hydroxy-3.5-dimethylbenzyl)-2-methyl-6-(((4-4-(2hyroxy-3, 5-dimethylbenzyl)-2-methyl-6(((4 nonylbenzyl) imino) methyl) benzene-phenolnonylbenzyl) imino) methylbenzene-1,3iol [K5-K6] has been used from the
reaction of K3-K4 with phenol formaldehyde.The analytical capacity of chelating resins prepared using
the meal supply method for some of the transition element ions (Co+2, Fe+3, Cu+2) can be studied. The
loading range for resins can be determined and the effect of the treatment time and pH is determined, with the temperature and concentration of the ions under study and the amount of resin this study shows that the loading capacity of resins increases as the processing time and pH increases. The compounds synthesized above in this study were identified by infrared spectroscopy (IR), H-NMR (1), and mass thermodynamic analysis (TG, DTG).
Keyword: Phenolic Schiff base derivative, Polymer, Chloromethane, Aldehydes Phenolic.
Introduction
Alkyl benzene compounds are important organic compounds in organic chemistry and have been used as raw materials for the preparation of many organic derivatives such as organic acids like benzoic acid, phthalic and anhydride used in the manufacture of plastics and Unsaturated polyacetylene resins, Sulfonated and straight-chain alkyl Benzene sulfonates were also used in the manufacture of the active substance of detergents mainly [1]. (Lab9) (nonan-3-ylbenzene) is the primary material in the process of preparing organic compounds for the polymers used in this study [2]; there are many applications for this compound. In the preparation of a number of polymers phenol formaldehyde, the phenol reaction with formaldehyde in the basal environment
produces ortho and Para mathelol phenols, which are more effective than Phenol itself was reacted to formaldehyde, so a subsequent reaction consisting of biphenyls and triethyl phenol was quickly introduced. The loading capacity of these polymers was studied in the direction of ions (Co+2, Fe+3, Cu+2) [3]. The
study was using the meal method and most polymers were selective towards the Cu+2 ion.
Phenol ring, connected by an azomethine group [4].One of the newly formed polymers is a polymer by Shah and his group. This resin was used to extract some transitional element ions such as Ni+2, Zn+2 Cu+2, Pb+2.
Experimental Part
devices, including a Cary 600 Series FT-IR Spectrometer (4000-400 cm-1). The NMR spectra of the proton were also recorded using DMSO-d6 as a solvent and using a H-NMR Ultra shield 500 MHz (Bruker 2012). TG (and DTG) measurements were performed and the instrument was used (Instrument TGAQ500V6.7Build203.)[5].
Method of Compound Preparation [K1]
(0.86 g, 0.01mol) of dichloromethane with (3g, 0.01mol) of 3-nunan benzene with anhydrous aluminum chloride (AlCl3) and then increase
the mixture for (4 hours) with continuous
stirring, cool the mixture and then drain and dry a white precipitate using TLC technique is used to determine the purity of the observed compound .
Method of Compound Preparation [K2]
Mix (6.64gm, 0.01mol of NH4CL ammonium chloride) in a circular flask with (3gm, 0.01mol) of 3-nunan benzene and add (0.56gm, 0.01mol) of NaOH (KOH) in 20 ml of water Distill the mixture over a grease bath for 5 hours. Cool the mixture, then dry and drain. Table (1) represents some physical properties of compounds (K1-K2) [6].
Table 1: Shows some physical properties of prepared compounds [K1-K2]
Color Yield M.P ºC Molecular Formula R NO White 52%
166 -164 C16H25Cl
CH2Cl
K1 Brown 56% 183 -181 C16H27N
CH2NH2
K2
Preparation of AVS [K3-K4] Basic Compound
In a circular flask add 0.002 mol of benzaldehyde to 0.3 g, 0.002 mol of compound
K2. Mix for five hours with continuous stirring until the precipitate is filtered and dried. Use ethanol as a solvent. Table (2) shows the properties of the physical compounds [7].
Table2: shows the properties of the physical compounds [K3-K4]
Color Yield M.P ºC Molecular Formula R NO White 71% 207-210 C23H31NOCl
2-OH,5-Cl K3
White 67%
186-188 C23H32NO2
2,4-OH,5-CH3
K4
How to Prepare the Alkali Resins [K5-K6]
Mix the flask (1.5 gm) of the prepared compounds [K3-K5] with (7 gm) of phenol [8] and add the mixed mixture (25 mL) formaldehyde blending well and then raise the acidic function to (9- 10.5pH = (10%) weight/volume of sodium hydroxide, mix with stirring for 5 hours until the gel is sticky with a light reddish color, and then transfer the product to a drying oven at 120 ° C for 2 hours until The polymerization process is completed after grinding the resulting polymer and then washing thoroughly with
the non-ionic water to remove the residues of the non-reacting materials and then drying until the weight is confirmed.
Preparation of Standard Solutions for Element ions
The standard solution for each metal was prepared by taking a suitable weight of the metal salt and dissolving it in a small amount of non-ionic water. Then add 2 ml of HNO3 or HCL by salt type and then complete
the volume to 500 ml of water. Some weights used to prepare the standard solution 1000 PPm per metal.
Table 3: the weights used for the salts of each element required to obtain 500 ml of solutions at a concentration of 1000 ppm
Weight in (500 ml) Molecular formula of element salts
NO
2.341gm CO (NO3)2.6H2O
1
1,431 gm FeCl3
2
1,682gm Cu(NO3)2.3H2O
3
It was diluted to certain volumes of these
Non-ionic water was used in all analytical preparation processes. The acidic function was seized using nitric acid solution and ammonium hydroxide solution at a concentration of 1 molar) for both of them [9].
Results and Discussion
The compounds were prepared according to the steps of the work methods referred to in the practical part and according to the following plan
Discussion of Infrared Spectra (IR) of Compound [K1]
It was confirmed that the reaction followed the change in the physical properties of the melting point and color. The compound [K1] was infused with infrared radiation, and an
absorption package (3071 cm -1) was obtained from the membrane of the (Ar-H) and an absorption package appeared in the range (2913) cm -1 for the (C-H) group and for the absorption of (1566) CM -1 for the C =
C group. [10], as in Figure (1).
Fig 1: Infrared spectrum of compound [K1]
The NMR spectrum of the compound showed a single signal at (6.26) ppm, which is attributed to the protons of the ethyl group
CH2Cl.) And a multi-signal at the range
Fig 2: represents the 1H-NMR spectrum of the compound [K1]
Composite [K2]
Fig 3: IR spectrum of compound [K2]
Presence of a peak in the range (3321-3354) CM-1, which indicates the presence of the
NH2 group as shown in Figure 3, added to it
the spectrum (HNMR). (2CH3), the
appearance of a hexagonal signal at (1.89) ppm of protons (4CH2) with the appearance of
a quadrant signal at (2.10) ppm, which
corresponds to the protons of the group (2CH2) A 5-point signal at the site (2.28 ppm)
was obtained from the (CH) group protons. The single in the 5.01 (ppm) sites belongs to the NH2 group and the signal from 7.01-7.88
to the (Ar - H) [11].
Fig 4: 1H-NMR spectrum of compound [K2]
[K3-K4] chloride bases from the reaction of the compound [K2] with the appropriate aldehydes and the solvent used for ethanol
Interpretation of Spectra (IR) of Compounds Prepared from [K3-K4]
The peaks of group uptake (HC = N) and disappearance of the NH2 group indicated the
validity of the resulting compound, with CM-1
absorption peaks (3452-3509) and hydroxyl (OH) (3013-3075), which refers to the
Aromatic group (Ar-H), while the group (C-H) aliphatic has been shown to have peaks at (2919-2937) and that the presence of absorption peaks belong to the groups (C = C) and (C = N) (4) and (4,5), which represents the values of IR (table 4) for compounds prepared from [K3-K4], are shown in the range (1565-1676) CM-1 respectively.
Table 4: represents the values of IR spectra [K3-K4]
IR ν (cm-1)
C=C C=N
C-H Ar –H
OH NO
1676 1653
2937 3013
3452 K3
1668 1650
2919 3075
3509 K4
Fig 5: IR spectrum of compound [K3]
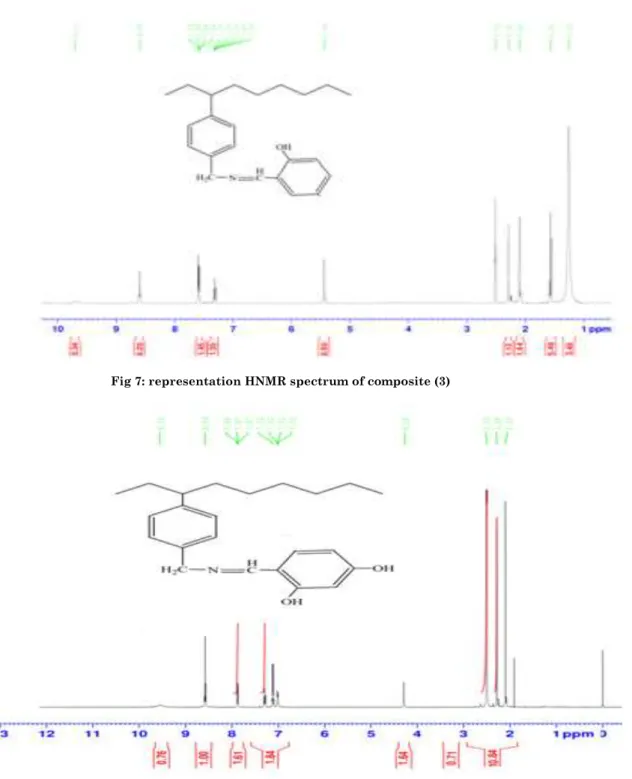
Interpretation of Spectra (1H-NMR) for Compounds Prepared from [K3-K4]
The spectra (1H-NMR) were studied using DMSO-d6 as a solvent and the standard unit of measurement (ppm). The disappearance of the Amine Group was evidence of the correctness of the vehicles being recorded [13].
Composite [K3]
The emergence of a triple signal between (1.09-0.09) PPM dating to the 2-CH2 group
protons.
The appearance of the six-signal between (1.29-1.09) PPM and the 4-CH2 protons and
the quadrant within the range (1.89-1.21) PPM, which belong to the group (2-CH2).As
well as the five-point between (2.28-1.74) PPM which refers to C-H protons. The single signal at the site (4.40) PPM belongs to the CH3 group protons. (7.60-7.07) PPM
indicating the aromatic proton protons and a single signal at 8.97 PPM between the presence of the proton N = CH and the single signal at (9.91-9.74) PPM indicates the presence of the hydroxyl group (OH) [14]. As shows the Figures (7, 8)
Fig 7: representation HNMR spectrum of composite (3)
Analytical Measurements
Study of Resins Selectively Toward Elements
The maximum capacity for loading resins to the studied elements at the maximum treatment time (24 hours) and the highest acid function of the metal ion solution, where the solution is clear and non-turbid and at laboratory temperature, is the optimal condition used for the study of selective chelating resins [15]. The process is treated with 0.1 g of resins with element ions solutions that are 100-ppm in isolation for 24 h. At the highest acidic function of the element ions solution, the filtration process is performed and the concentration of each ion is tested in the leachate by atomic absorption spectrometry to determine the number of ions associated with different resins studied.
Effect of Processing Time on Resin Load Capacity [K5-K6]
The effect of the treatment time for resins was studied with the ions studied separately after stabilizing the rest of the other influencing factors, in particular the size of the solution and the acidic function.
, 1 g) of resin with 10 mL of element ion solution at 100 ppm part for different periods of time ranging from 1 h to 24 h and the concentration of ions associated with resin was calculated [16].
Effect of Acidic pH Function in the Loading Capacity of the Alkali Resins [K5-K6]
The effect of the acidic function on the loading capacity was studied through the
treatment of (10 mL) of the ion solution for specific periods of time in each acidic function studied with (0, 1 g) of resin. The highest loading capacity of most ions is at the highest acidic function of the ion solution under study.
Study of the Analytical Efficiency of the Chelating Resins [K5-K6]
The method of the meal was used to study the analytical efficiency of the resin towards the studied ions, which includes the two and three concentration of ions in these solutions was determined by atomic absorption spectroscopy technique, where 10 mL of the studied ion solution with a concentration of 100 ppm with 0.1 g of resin was irradiated for 24 hours, all ions have shown a significant response to the resin.
The Effect of the Treatment Time in the Maximum Capacity for Loading the Chelating Resins [K5-K6]
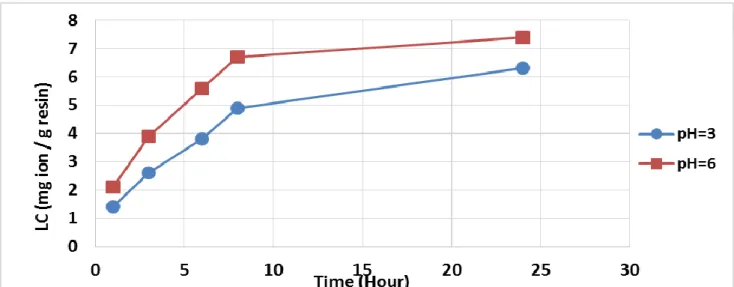
The increase in treatment time increases the loading capacity of resins in general for the studied ions, and the loading capacity reaches its maximum at the highest treatment time (24 hours).This study was conducted to determine the effect of the treatment time. The results showed that the resin loading capacity of the ions reached about equilibrium state after 7-8 hours. In all the acidic functions under study, the amount of loading capacity increases slightly until reaching 24 hours of treatment. Tables (7.5) and Figures (18-10) show the effect of the treatment time on the resin loading capacity of ionsCu+2, Fe+3, Co+2) in the acidic functions studied[17].
Table 5: Number of milligrams of ions (Cu2+, Fe+3, Co+2) drawn by (0.1) gm of [K5] resin as a time function in different acidic functions:
Loading Capacity of ion mg ion /gm resin
Fig 7: Shows that (0.1 g) of the polymer (K5) can be withdrawn to the number of amalgam (Fe+3) in (4, 3 = PH) as the time function
Fig 8: Shows that (0, 1 g) of the polymer [K5] can be withdrawn to the number of amalgam (Fe+2) in (1, 5 = PH) as a
function of time
Fig 9: Shows that (0, 1 g) of the polymer [K5] to withdraw the number of a mailgram (Cu+2) in (4,6 = PH) as a function of time
Table 6: Number of milligrams of ions (Cu+2, Fe+3, Co+2 ) drawn by (0.1gm) of the [K6] as a function of time in different acidic functions
Loading Capacity of ion mg ion /gm resin
Time(hour) pH
Ions
24 8
5 3
1
6.3 4.9
3.8 2.6
1.4 3
Co2+
8.2 6.7
5.6 3.9
2.1 6
6.3 4.6
3.9 2.5
1.3 2
Fe3+
8.2 6.5
5.6 3.8
1.9 6
6.1 4.3
3.7 2.5
1.5 2
2+Cu
6.9 5.4
4.8 3.6
Fig 10: shows that (0, 1gm) of the polymer (K6) to remove the number of ions (CO+2) in (3, 6) = PH as a function of time
Fig 11: Shows that (0, 1gm) from the [K6] polymer which can be withdrawn from the amalgam (Fe+3) in (2,6) = PH as a
function of time
Fig 12: shows that (0, 1gm) of the polymer [K6] which can be obtained to withdraw the number of ions (Cu+2) in (2, 5) = PH as a function of time
Conclusion
The absorptive capacity of the studied polymers for the ions of the transition elements increases with increasing time, temperature and pH function.
Acknowledgment
References
1. Matthijs E, de Henau H (1987) “Determination of LAS” Tenside Surfactant Detergents, 14: 193-199.
2. Erna J, et al (1993) “Growth and Development in LAB Technologies: 30 years of Innorqtion and More to Come” World Surfactant Conference, Monteux, Switzerland.
3. Al-Soud YA, Al-Masoudi NAJ Braz (2003) Chem. Soc., 14(5): 790-796.
4. Aggarwal NR, Kumar P Dureja, Khurana JM (2011) European Journal of Medicinal Chemistry, (46): 4089-4099.
5. Shah BA A, Shah V, Shah PM (2009) J. Malaysian Polymer.
6. Vogel A I, A. Text- Book of practical organic chemistry(1974), 3rd- Edition Longman London. 534-540.
7. Bhat KS, Karthikeyan MS, Holla BS, Shetty NS (2004) Indian J. Chem., 43B: 1765.
8. Abdulwahid AT (2011) M.Sc. Thesis, University of Tikrit.
9. Al-Amin M, Islam MR (2006) Bangladesh J. Pharmacol., 1:21.
10. Rutavicius A, Kuodis Z (2002) Chemistry of Heterocyclic Compounds, 38(7): 852-858. 11. Kamble RR, Sudha BS, Bhadregowda DG
(2008) Serb J. Chem. Soc., 73(2):131-138. 12. Ann A, Karakash S (2008) Indian J. of org.
Chm., 6: 10.
13. Rutavicius A, Kuodis Z (2002) Chemistry of Heterocyclic Compounds, 38(7): 852-858. 14. Williams DH, Fleming I (1973) "Spectroscopic Methods in Organic Chemistry”, 2nd Ed., McGraw-Hill book Co. U.K. Limited 65.
15. Al-Hamad NA (2000) M. Sc. Thesis, Basrah University, Iraq.
16. Al-Amin M Islam (2006) MR Bangladesh J. Pharmacol., 1:21.
![Table 1: Shows some physical properties of prepared compounds [K1-K2]](https://thumb-us.123doks.com/thumbv2/123dok_us/8103939.2148219/2.893.78.823.357.733/table-shows-physical-properties-prepared-compounds-k-k.webp)
![Fig 1: Infrared spectrum of compound [K1]](https://thumb-us.123doks.com/thumbv2/123dok_us/8103939.2148219/3.893.90.812.152.651/fig-infrared-spectrum-of-compound-k.webp)
![Fig 2: represents the 1H-NMR spectrum of the compound [K1]](https://thumb-us.123doks.com/thumbv2/123dok_us/8103939.2148219/4.893.87.812.50.658/fig-represents-h-nmr-spectrum-compound-k.webp)
![Table 4: represents the values of IR spectra [K3-K4]](https://thumb-us.123doks.com/thumbv2/123dok_us/8103939.2148219/5.893.81.772.434.1167/table-represents-values-ir-spectra-k-k.webp)
![Table 5: Number of milligrams of ions (Cu2+, Fe+3, Co+2) drawn by (0.1) gm of [K5] resin as a time function in different acidic functions:](https://thumb-us.123doks.com/thumbv2/123dok_us/8103939.2148219/7.893.79.822.891.1197/table-number-milligrams-drawn-function-different-acidic-functions.webp)
![Table 6: Number of milligrams of ions (Cu +2 , Fe +3 , Co +2 ) drawn by (0.1gm) of the [K6] as a function of time in different acidic functions](https://thumb-us.123doks.com/thumbv2/123dok_us/8103939.2148219/8.893.84.819.1048.1202/table-number-milligrams-drawn-function-different-acidic-functions.webp)