Accredited by RISTEKDIKTI, Decree No: 32a/E/KPT/2017
doi: 10.14203/jet.v19.26-31
CDF-based Flow Detection for Network Flow Sampling and
Packet Capturing
Aris Cahyadi Risdianto
a, *, Nuryani
ba School of Electrical Engineering and Computer Science
Gwangju Institute of Science and Technology 123 Cheomdangwagi-ro, Buk-gu
Gwangju, Korea b Research Centre for Informatics
Indonesian Institute of Sciences (LIPI) Gedung 20 Lt.3, Jl. Cisitu (Komplek LIPI) No. 21/154D,
Bandung, Indonesia
Abstract
Providing an appropriate level of flow collection, relying on packet capturing or flow sampling method, is extremely hard due to various practical limitations and resources requirements. To address this challenge, this paper investigated a CDF (Cumulative Distribution Function)-based flow detection to decide between “known” and “unknown” flows. Therefore, a combined flow collection can be achieved to improve the collection’s efficiency by sampling only the known flows and capturing the remaining unknown flows. As a preliminary experiment, detecting known and unknown flows was conducted over a long period by calculating the empirical CDF distance between each flow’s rate and overall packet’s rate distribution, called as FPR (Flow-to-Packet Ratio), with a threshold (FPRmin) based on a significant level of observed data. The result shows that unknown
flow is detected for most of the recommended significant level values.
Keywords: flow detection, cumulative distribution function (CDF), flow sampling, and packet capturing.
I. INTRODUCTION
Providing an appropriate level of flow collection, relying on either distributed with fully captured or centralized with sampled, is extremely hard due to various practical limitations and requirements in packet capturing and flow sampling [1]. Simple flow collections can be collected through some available packet capturing tools. However, for monitoring wide-area networks, the packets need to be replicated and sent to a single location. Then replicated packets are sent to the packet capturing tools, with or without match-based packet filtering process. Another way to enable flow collections is by using an agent that combines packet samples into datagram and randomly sampled according to a pre-defined sampling interval/ratio before sending the datagram into the collector [2].
In this paper, flow is defined as a set of packets with a common property specified in the packet’s headers, known as the flowkey, which observed within a period. The packet capturing reflects exact flows being processed but only valid at that particular point and also known as a resource-consuming process. In contrast, the flow sampling is limited due to sub-optimal flow sampling ratio/interval. However, it has a unique global view of flows in the whole network and requires a minimum resource. So, there is a need to utilize combined methods that providing an appropriate level of flow collection and improving efficiency while still
keeping the specific level of accuracy. Several sampling methods for network flow monitoring are proposed to address these needs. Providing efficient building blocks for sampling and large flow detecting by using OpenFLow based methods in SDN switch can be used in various monitoring application [3]. A double-sampling and hold-based approach that includes two sample process, hold, and early removal process is proposed to maximize the flow information in the given limited resources [4]. Another approach is modular and self-adaptive measurement architecture that consists of management, sampling, and network plane to accommodate the selection and configuration of sampling technique [5]. R. Hofstede et al. [6] explained a novel traffic monitoring approaches as well as improving efficiency in processing and storing the traffic data. They used protocols such as Netflow and IPFIX, to perform flow monitoring, including packet observation, flow metering and export, data collection, and the final stage is data analysis. However, it needs improvement by combining packet analysis and flow monitoring. Another work tried to estimate the number of bytes and packets of the flow by using Maximum Likelihood Estimation (MLE). The expected relative error is defined as % 𝑒𝑟𝑟𝑜𝑟 196. [7], means that avoiding flow sampling for achieving specific error, if the number of sampled flows is less than s. Performance can be improved by observing packet over a long period (not over short a time of sampling period) and counting the actual rate parameter (not only the packet count).
This paper describe a decision problem to select an appropriate flow collection that combines two methods, * Corresponding Author.
Email: [email protected]
Received: February 20, 2019 ; Revised: June 25, 2019 Accepted: August 01, 2019 ; Published: August 31, 2019
flow sam CDF (Cu over a packet’s similar to be decide and consi is signifi
unknown
section 2 decide a defined le followed section 4 several re in section
As m closely re considere and (b). T reducing requireme size, susp as unknow
This pre-defin on the sp
flows. Th packet an unknown overall p distance paramete threshold accuracy decided i
FU with (
𝐶𝐷𝐹 𝑑 𝐶𝐷𝐹 𝑑
The CDF of depicted known or distance b rate. Flow
Figure 1. packet, (b
mpling and pa umulative Dis long period, characteristic o the overall p ed that the flo idered as a kn
cantly differe
flow. The pa . The propose set of known
evel of accura by experime 4 and 5, resp
ecommendatio n 6.
II. PRO
mentioned in elated with ov ed as known f
The flow can the amount ent. The oth picious flow,
wn flow as dep paper observ ned long-time
pecific attribu hen, the statis nd flows were n flows, the sta packets were between dis r (e.g., rates d (i.e., distan (i.e., a proba into a set of k (1).
𝑑𝑖𝑠𝑡𝑎𝑛𝑐𝑒 𝑏𝑒𝑡𝑤𝑒𝑒 𝑑𝑖𝑠𝑡𝑎𝑛𝑐𝑒 𝑏𝑒𝑡𝑤𝑒𝑒
III.
proposed sy the flow’s ra in Figure 2. T r unknown flo between each
w Classifier w
(a) Probability Dens b) known flows (s
acket capturin stribution Fun , then comp s. If the char packet’s chara ow and packet
nown flow. On ent, the flow
articular prob ed design of t
n and unknow
acy is describ ental simulati ectively. Fina ons for future
OBLEM FORM the previous verall packets
flows as depi be collected b
of collected her flows wi or wrong flow picted in Figu ved a set of
period, and c utes, which ca stical characte e analyzed. Fo atistical relatio e compared stributions fo s or counts). nce value) or ability of error known flows F
𝑒𝑛 𝑓 𝑎𝑛𝑑 𝑝 𝑑 𝑒𝑛 𝑓 𝑎𝑛𝑑 𝑝 𝑑
SYSTEM DE ystem design ate value ove This system he ows dependin h flow’s rate
with pre-defin
sity Function (PD similar distributio
ng, by monito nction) of eac paring with
racteristic of acteristic, then
t are closely r n the other sid
is considered blem is descri the system m
wn flow with bed in section ion and anal ally, conclusi e work are pr
MULATION section, a flo characteristic icted in Figur by flow sampl d data and re ith fixed-rate w can be con ure 1 (c) and (d
packet input classifies them
an be conside eristic of the or defining kn on between fl by measurin or specific st
Under pre-d r expected le r), the flow fk
FN or unknown
𝑑𝑖𝑠𝑡𝑎𝑛𝑐𝑒 , 𝑓 𝑖𝑠𝑡𝑎𝑛𝑐𝑒 , 𝑓 ∈
ESIGN
for calculati er a long pe elps us to disti ng on the distr and overall p ned set of flow
(b) DF) comparison fo
on shape with pac
oring a ch flow overall flow is n it can related, de, if it d as an ibed in model to a pre-3. It is lysis in on and rovided
ow that can be re 1 (a) ling for esource /packet nsidered
d). over a m based ered as overall nown or ow and ng the tatistics defined evel of can be n flows
∈ 𝐹 ∈ 𝐹 (1)
ing the eriod is inguish ribution packet’s
wkey S (i.e pra con num be
num num
ove int val val
fK i tot ran
pac wit uni is dis of ana of It num is d
fun on var and dis of obs
or rate values dist cket), (c) very sm (abnormal traff
e., a combin actically grou
ntains all th mber of flows defined as in
𝑓 𝑡 The essenti mber of flowk
mber of flows
Flow model
er a specific t o CDF. First, lue of x1, x2, lues in bps (b in the duratio al number o ndom variable
x 𝑡
𝑋 Due to this cket’s rate val th a single t iform distribu selected to stribution over CDF, nomi alyzed. Nomin
packet/flow’s can denote a merical distrib defined as in (
𝐶 Empirical C nction of the p
real observed riable and em d Ĉ , so fl stribution func observed rat served value i Ĉ
(c) tribution between mall rate flow (sus
fic).
ation of pac ups the pac he flowkey in
s. So, each flo (2).
𝑝 𝑆, 𝑡 , 𝑘 ial point is a
key elements, s.
ling tries to ob time and then
, random vari
x3,…, xk to r bit per second on of Δt as d f observed r e x1, x2, x3, …,x
𝑓
x 𝑡 , x 𝑡 s randomness lues may not b type of distr ution function) analyze th r a specific tim inal CDF, a
nal CDF is u s rate random
as 𝐶 , so f bution functio (5).
𝑥 𝑃 𝑋
CDF tries to packet/flow’s d values from
mpirical CDF flow f1, f2, f ctions Ĉ , Ĉ
te values is N
is r, so Ĉ ca Ĉ 𝑁, 𝑟
)
n packet and seve spicious traffic), a
ket’s header cket input 𝑝 n 𝑆 1, 2, 3, … ow’s rate over
∈ 1,2,3, … , 𝐾 a set of flowk
which gener
bserve the flow models the ob iable X is def
epresent the d) for each flo
efined in (3) rate values is
xk have N valu 𝑡 𝑑𝑡
, … , x 𝑡 s characterist
be possible to ributions (e.g ). CDF-based he observed
me. In this wo and empirical used to analyz variable, as d flow f1, f2, f ons 𝐶 ,𝐶 ,𝐶
𝑥
estimate the rate random v experiments. F can be de
f3,…, fK hav
, Ĉ ,…,. . I
N and a spec an be describe
∑ 1
eral classified flow
and (d) fixed & s
information) 𝑝 𝑆, 𝑡 which , 𝐾 , into K
r the time can
𝐾 (2)
key S with K
rate exactly K
w rate’s value bserved value fined with the observed rate ow f1, f2, f3,…, and (4). The s N, so each ues.
(3)
(4)
tic, flow’s or o approximate g., normal or characteristic rate values ork, two types l CDF were ze real-valued defined in Xk.
f3,…, fK have 𝐶 ,…,𝐶 . It
(5) e distribution variable based Rate random enoted as Ẋk ve empirical If the number cific value of ed in (6).
,
(6)
(d) ws; (a) overall
mall rate flow
) h
K
n
)
K K
e e e e
e h
)
)
r e r c s s e d . e t
) n d m k l r f
Figure 2.
where 1 rate value
The r packet’s obtained Test) [9] CDF of rate distr for all o written in 𝐹𝑃𝑅
Flow flow by c ratio va significan number Equation between distributio specific s
𝐹
where 𝑐 𝛼
By updates th flows 𝐹 ,
FN c because t with over be captur suspiciou sampling system ar
IV
Expe is conduc with a analysis r an initial and colle analyzed Wireshar flowkey and gene calculate packets. testing to
. System model fo
, is defined
e (i.e., event) o ratio between rates, called a
using Kolm for calculati each flow an ibution Ĉ a observed valu
n (7). 𝐷, 𝑁
w Detector de comparing th alue 𝐹𝑃𝑅 , nt level that re
of observed (8) is des flow’s rate on with a num significant val
𝑃𝑅 𝐷 ,
𝛼 is defined
𝑐 𝛼
comparing 𝐹 he set of norm , as shown in (
𝐹𝑃𝑅 𝐹
𝐹𝑃𝑅 𝐹𝑃
can be easil the flow’s rat rall packet’s i red packet-by-us or too sma
error. Symb re described in
V. EXPE
erimental simu cted by gener
different typ requires data l observation ected into the
by using rk [10]) to get
(i.e., source erate a statist the rate’s dist As a prelimi ools, known
or detecting know
as the indicat of flow fk [8]. n each flow’s r as FPR (Flow mogorov-Smirn
ing a distance nd overall pac also, packet’s ues N, then t
sup Ĉ etects known e value of FP which may eflects a conf
values of scribed the distribution mber observed
lue α.
𝑚𝑖𝑛 𝑐 𝛼
as in (9).
ln
𝐹𝑃𝑅 and 𝐹𝑃 mal flows 𝐹 ,
(10).
𝐹𝑃𝑅 , 𝑓 ∈
𝑃𝑅 , 𝑓 ∈ ly collected te is well-distr
input rate. In -packet, becau all for samplin bols and not n Table 1.
RIMENTAL SI ulation to coll rating a differ pe of applic from packet-data. The pa e pcap-based packet ana filtered packe IP, destinatio ic report. Th tribution for e inary experim
as D-ITG (
wn and unknown
tor specific ob
rates with the w-to-Packet Ra nov Test (i.e e between em cket input. If
rate distribut the distance
𝑁, 𝑟 Ĉ 𝑁 n flow or un PR with a mi y derive fr fidence level a experiment maximum d
and packet d value Nk and
𝛼 .
𝑃𝑅 , the d
and set of un
𝐹
𝐹
by flow sa ributed or cor contrast 𝐹 n use the flow’s ng that may c tations used
IMULATIONS lect observatio rent type of p cations. CDF -level monito ackets were ca
file, and then alyzing tools
ets based on s on IP, and pr his report is u each flow and ment, three n (Distributed I
flows.
bserved
overall atio), is e., K-S mpirical f flow’s
tion Ĉ can be
𝑁, 𝑟 (7)
nknown inimum rom a and the results. distance ’s rate d Np for
(8)
(9)
detector nknown
(10)
ampling rrelated need to s rate is cause a in the
on data packets F-based oring as aptured n were s (i.e., specific rotocol) used to overall network Internet
Tra fro con kno fro are flo inf sho bec com dis
Sy
F
N
affic Generato om three pairs
nsidered as k own as nmap om a single p e considered ows). The k fluence overal ould be simila cause it sen mmunication stribution is di
ymbols Notat
Feature S
Index
t
k
n
Number
K
N
r
Data
p(S,
C
p
Ĉ
p
F
f
k(t
x
k(t
x
𝐶
Ĉ
FPR
FPR
α
FPR
F
N
F
U
or) [11] were s of IP source known flows. [12], is used air of IP sour as unknown known flows’
ll packet’s rat ar. The unkno nt only an (i.e., TCP sy ifferent.
TABLE
SYMBOLS AND
tion
S
Set of flo packet he port, othe
Indexes in
Indexes fo
Indexes fo
K Number
feature S
N Number o
Specific r
,t)
Rate of p containing flowkey S
p
Nominal function (
p
Empirical function (
F Set of cla
t) Rate of
period
t
n) Observed
x
k
The rand observed
Nominal function (
Empirical function (
PR Flow-to-p
R
k Flow-to -p
The confi
R
min
Minimum between K
N Set of Kn
U
Set of U captured/i
e used, to gen and destinati . One port s d to generate a
rce and destin n flows (i.e ’ rates are
e, so the rate’ own flow’s rat initial pack ync message),
E 1 NOTATIONS
Description
owkey which co eader (ip address ers)
n the time domain
for classified flow
for observed rate v
of classified flo
of observed rate v
rate value
packet input ov g all possible flo S)
cumulative (ncdf) of the pack
l cumulative (ecdf) of the pack
ssified Flows
flow k over a
d rate value of flow
dom variable of values
cumulative (ncdf) of flow k
l cumulative (ecdf) of flow k
packet ratio (Simi
packet ratio for fl
idence level of Ob
m flow-to-packet Known and Unkn
nown Flow (can b
Unknown Flow inspected)
nerate packets on, which are canning tool, attack packets nation, which e., suspicious expected to ’s distribution te is very low ket of TCP so the rate’s
n
ontained in the s, protocol, tcp
n
ws
values
ows based on
values
ver time which owkeys (set of
distribution ket input
distribution ket input
an observation
w k for t n + Δt
flow k for N
distribution
distribution
ilar to SNR)
flow k
bserved Data
ratio to detect nown Flow
be sampled)
(need to be
TOTAL N
Flow
Flow1
Flow2
Flow3
Attack Ethernet
Tabl during an different network flow3, wh
classified generated This flow Ethernet usually u the same should be this expe another ty flow (i.e.
By lev raw obser packet’s observati
V A. CDF
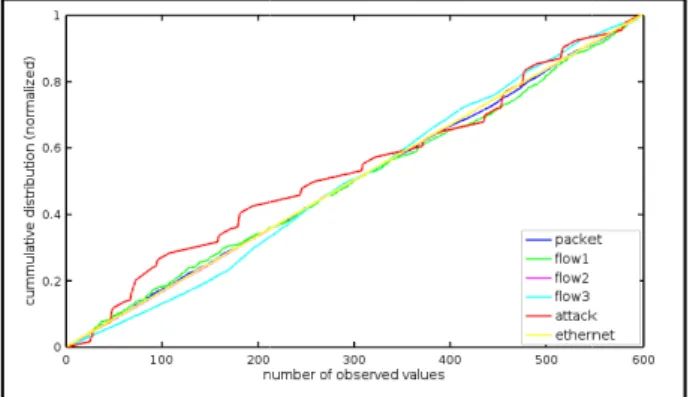
As a Figure 4, and over calculated numerica packets a flows flo similar sh our expe while th shapes du However has a fa character distance m empirical measurin from obs shows th classified intuitively each flow flow1, fl
distance attack flo ethernet packet’s r
NUMBER OF CAPT
FlowK
172.16.1.13,172 172.16.1.6,172. 172.16.1.12,172 172.16.1.102,17 ff:ff:ff:ff:ff:ff,et
e 2 shows t n observation type of applic
testing tools hile a set of pa d as an atta d during the w is conside
broadcast add used by the ho
e Ethernet d e happened ve eriment, it w ype of flow th , abnormal flo eraging packe rvation data, e rate also on period, as
V. VERI
F-based Analy
a preliminary , a numerical rall packet’s
d by using (4 al CDF for ob and classified
ow1, flow2, f
hape with the ectation as de he attack and ue to a statist r, intuitively, a ar distance f ristic. It may measurement l CDF need t ng frequency
served data, he empirical d flow’s rate y describes th w and packet.
low2, flow3
with the ov ow has far
flow has a rate value and
TABLE 2
TURED PACKETS D PERIOD
Key N
2.16.1.10,tcp 16.1.8,tcp 2.16.1.14,udp 72.16.1.16,tcp th
the number o n period (i.e.,
cations. Set o s are classifie
ackets from p ack. Furtherm
experiment ered as Ethe dress as its de ost to send me domain. Usua ery rarely and was sent reg hat can be con ow).
et-level monit each flow’s ra
can be gen depicted in Fi
FICATION AND
ysis
analysis of th CDF of all c rate can be 4). It is show bserved rate flows. Networ flow3 are mo
overall packe escribed in th d ethernet fl
tical characte a CDF charac from the ove y give inapp between thos to anayzed, w
counts of sp as formulate
CDF comp e and overal he distribution
Network rand rate’s values verall packet’
enough dista close distanc d it against our
DURING OBSERVA
Number of Packets
Num B
26512 16
28617 18
8906 55
18611 10
193 1
of captured p , 10 minutes) of packets from
ed as flow1,
port scanning t more, anothe
was also ob ernet flow (u
estination), w essage to all h ally, Etherne d incidentally, gularly to g nsidered as un
oring for pcap ate graph and
nerated duri igure 3.
D ANALYSIS
he result depi classified flow
analyzed, wh wn a compari
values from rk random gen st likely to et, which is sim
he previous ows have di ristic of both cteristic of eac
erall packet’s propriate resu se two CDFs.
which is deri pecific rate’s ed in (5). Fi parison betwe
ll packet’s r n distances b dom generated
s have very s rate value, ance. Unfortu ce with the r expectation.
ATION
mber of Bytes
836505 383512 585816 079438 15633
packets ) for a m three flow2,
tools is r flow served. use an which is hosts in et flow , but in enerate nknown
p-based overall ing an
icted in w’s rate hich is ison of overall nerated have a milar to section ifferent h flows. ch flow s CDF ults in So, the ved by s value igure 5 een all rate. It between d flows y close , while unately, overall
B.
dis Ko in em bet rat for dis Th in T
C.
des def tha the exc det unk com val dif val obs list sug to
Distance M
For further stributions ne olmogorov-Sm
(6). Howeve mpirical CDF
tween each f e distribution r each flow FP
stance, called he summary o
Table 3.
Hypothesis
Table 3 also scribed on the fault significa at K-S test re ere is a simil
cept the attac
tecting each f known flows, mparing each lue, denoted fferent FPRmi lues derived served data a t of FPRmin f ggested by [13
600.
Figure 3. Flo
Figure 4. Numer
Measurement
analysis, the d eed to be ca mirnov test (K er, the K-S
because for n flow’s distribu is intuitively
PRk is obtained as K-S (Kolm of K-S distanc
s Testing
o gives hypoth e P-values. By ant level (α =
esults accept larity in the d
k flow. Howe flow and cate another hypo K-S distance as FPRmin. in was adopt from signi as formulated for recommen 3] for the num
ow rate graph from
rical CDF for obs packets and clas
distance betwe alculated by K-S test) [9], a
test is only nominal CDF ution and ove
very far. Thu d based on thi mogorov-Smirn ce from all flo
hesis testing [ y comparing P
0.05), it can b the null hyp distribution) f ever, for furth egorizing it in othesis need to e with a minim As a preli ted, valued ficant level
in (7). Table nded significa mber observed
m packet-level m
served rate values ssified flows.
een those rate applying the as formulated y applied for , the distance erall packet’s us, FPR value is distribution nov) distance. ows is shown
14] result that P-value with a be easily seen pothesis (i.e., for all flows, her analysis or nto known or o be made by mum distance iminary test, from critical and several e 4 shows the ant level α as d data N equal
onitoring.
s from overall
e e d r e s e n . n
Figure 5. Em
E
THE MIN
A.
α F
0.1 0
0.05 0
0.025 0
0.01 0.
0.005 0. 0.001 0.
By c Table 4, flows wa detection FU with a The method c for almos small val of confid level as 1 data is no improved decrease result sh
mpirical CDF for and
THE SUMM
Flow
K-Flow1
Flow2
Flow3
Attack Ethernet
NIMUM DISTANCE
Significant lev (alpha) 0.1 0.05 0.025 0.01 0.005 0.001
K-SDISTANCE
FPRMIN Flow1
0.07066 FN
0.07841 FN 0.08546 FN .093971 FN .099929 FN .112553 FN
comparing eac another table as generated. n result for kno a different con
detection re can consider a
st all significa lue of signific dence. Some 1 – α [14], so ot achieved 99 d by increasin the value o hows that th
r observed rate va d classified flows
TABLE 3
MARY OF K-SDIS
-Sdistance=FPR
0.0284 0.0167 0.0584 0.1018 0.0184
TABLE 4
ES FOR DIFFEREN
vel B.
TABLE 5
E-BASED DETECTI
Flow2 Flow
FN FN
FN FN
FN FN
FN FN
FN FN
FN FN
ch FPR in Tab e to show dete Table 5 sho own flows FN nfidence level esult shows
attack flow as ant level α, ex
cant level refl references c o it can be sa 9.9% of confid ng the number
f FPRmin. Ho he unknown
alues from overal .
TANCES
RK P-value
0.967 1.000 0.251 0.040 1.000
NT SIGNIFICANT L
Minimum dist FPRMIN 0.07066 0.07841 0.08546 0.093971 0.099929 0.112553
ION RESULT
w3 Attack E
N FU
N FU
N FU
N FU
N FU
N FN
ble 3 with FP
ection results ow the summ N and unknown of observed d
that our pr an “unknown xcept α = 0.00
lects a wide i consider conf id that our ob dence level. It r of observed owever, the
flow needs
ll packets e LEVEL ance= Ethernet FN FN FN FN FN FN
PRmin in for all mary of n flows data. roposed n” flow 01. This interval fidence bserved t can be data to overall to be
mo and “kn con It c obs pap D. Est Ko giv con ML pac rat lev Fin ML res det cap flo dis “un lev mo ove cap fut net [1] [2] [3] [4] [5] [6] [7] [8] [9]
onitored by p d analysis. N nown” flow nsistency app can be impro servation peri per, the observ
Compariso Estimator (
Relative sa
timator (ML
olmogorov-Sm ve an initial id nfidence inter LE’s relative cket’s sample
io), while the vel (depends nally, an imp LE can be ach sult with the M
This paper tection for pturing. The ow’s and p
stribution can nknown” flow vel in distribu onitored using
erhead proce ptured packet ture, this app twork traffic i
A. C. Risdian visibility for tagging," in P
Conf. 2017, Je
S. Panchen, P sFlow: A meth networks. Y. Afek, A. B large flow de
Interest Group
G. Cheng, Y. based approa monitoring,” i 2007, pp. 857-J. M. C. Silva, for deploying
Federation I Infrastructure
R. Hofstede, P Sperotto, and A capture to data
Surveys Tutori
P. Phaal and S [Online]. http://www.sflo A. W. V. Vaa University Pre H. W. Lillie normality with
Statistical Asso
packet captur Noted that, Eth
due to a few earances duri oved by reduc
iod, such as vation period
on with Maxim (MLE)
ampling error LE) and con mirnov test we dea about the rval for the sam
sampling erro es (depends o confidence in on the num provement in hieved, and ho MLE.
CONCLU describes an network flow result shows acket’s emp n be used ws with a m ution distance g flow-level
ss, while un t-by-packet to proach can be
in real-time.
REFERE
nto, J. W. Kim, effective SDN-c
Proc. Korea Inst
ongseon, Korea, P. Phaal, N. McK
hod for monitorin
B. Barr, S. L. Fe etection in SDN
p Data Commun.,
Tang, W. Ding ach for accurate
in Proc. Int. Co
864.
P. Carvalho, S. R g self-adaptive t
Inform. Proces Manage. Security
P. Čeleda, B. Tr A. Pras, “Flow m a analysis with ne
ials, vol. 16, no. 4 S. Panchen. (2017
ow.org/packetSam art, Asymptotic S
ss, 1998, p. 265. efors, "On the h mean and va
oc., vol. 62, no. 3
ing for furth hernet flow i w numbers o ing the observ cing the granu
every 0.1 sec is 1 second).
mum Likelih
in Maximum nfidence inte
ere also comp value of relat me observed p or relies on th on the sampl nterval relies mber of obser
CDF-based opefully, a sim
USION idea for CD w sampling that the dista pirical CDF
to detect “ most significan
test. Known monitoring t nknown flows o increase acc e implemente
ENCES
"A balanced co coordinated flow
t. Commun. Info
2017.
Kee (2001). InM ng traffic in swit
eibish, L. Schiff N”, in Proc. 201
London, UK, 20 g, “A double-sam
e and efficient
onf. Computatio
R. Lima, “A mod traffic sampling,
ss. Int. Conf y, 2014, pp. 179-rammell, I. Drag monitoring explain etflow and ipfix, ” 4, pp. 2037-2064, 7, June). Packet
mplingBasics/ind
Statistics. Cambri
Kolmogorov-Sm ariance unknown 318, pp. 399-402,
her inspection is detected as of packet and vation period. ularity of the conds (in this
ood
m Likelihood erval in the pared. It may tive error and packet’s data. he number of ling rate and on significant rvation data). analysis over milar accuracy
DF-based flow and packet ance between based rate “known” and nt confidence flows can be to reduce the s need to be curacy. In the ed to monitor
ollection of flow w clustering and
orm. Sci. Winter
Mon corporation's tched and routed
f, “Sampling and
15 ACM Special
015, pp. 345-346. mpling and hold t network flow
onal Sci., China,
dular architecture ,” in Proc. Int. f. Autonomous
183.
go, R. Sadre, A. ned: From packet
” IEEE Commun.
, May, 2014.
sampling basics.
Available: dex.htm.
idge: Cambridge
mirnov test for n," J. American
[10] Wireshark. (2017, June). Wireshark [Online]. Available: https://www.wireshark.org/.
[11] Dipartimento di Ingegneria Elettrica e delle Tecnologie dell'Informazione (2017, June). D-ITG: Distributed Internet
Traffic Generator [Online]. Available:
http://www.grid.unina.it/software/ITG/.
[12] G. Lyon (2017, June). Nmap: the Network Mapper – Free
Security Scanner [Online]. Available: https://nmap.org/.
[13] University de Montreal. (2017, June). Critical Values for
two-sample Kolmogorov-Smirnov test (2-sided) [Online]. Available:
https://www.webdepot.umontreal.ca/Usagers/angers/MonDepotP ublic/STT3500H10/Critical_KS.pdf.
[14] D. M. Lane. (2017, June). Significance Testing and Confidence
Intervals [Online]. Available:
![Figure 2. where 1 rate value The r packet’s obtained Test) [9] CDF of rate distr for all o written in](https://thumb-us.123doks.com/thumbv2/123dok_us/8094478.2144943/3.892.112.443.85.160/figure-obtained-.webp)