164
TRENDS IN ROMANIA’S FRUIT MARKET
ION PIRVUTOIU1, AGATHA POPESCU2
1Hyperion University, 169 Calea Calarasilor, District 3, Bucharest, Romania 2University of Agricultural Sciences and Veterinary Medicine of Bucharest, 59 Marasti, District 1,
Bucharest, 011464, Romania, Phone:+40213182564, Fax:+40213182888, Email:[email protected]
Keywords: fruit, market, production, Romania, trade
ABSTRACT
Fruit market is a dynamic sector in Romanian agriculture. In 2010, the surface of orchards was 198.6 thousand ha by 36 % smaller and production accounted for 1.429 thousand tons by 3 % less than in 1990. Consumption increased to 63.3 kg fruits/inhabitant. The most fruit amounts are produced in the South, North West and West parts of the country. Romania comes on the 8th position in the EU, contributing by 3.01 % to its fruit production. The fruit offer is diverse, but consumption is still below the EU average. Despite that Romania is a net fruit importing country, export growth rate is higher than the import rate.
INTRODUCTION
Fruits are a part of human food intake because they are very rich in vitamins, minerals, fiber, energy and a few proteins and fats. For this reason, their consumption is healthy and recommended for a balanced diet. More than 400 g fruits and vegetables are recommended to be consumed every day (WHO, 2011).
Besides vegetables and cereals, fruits should assure 60-70 % of the number of calories needed in human daily diet (Pridie, 2004). Fruit consumption diminish the risk factors for cardiovascular diseases, obesity and aging, strengthen human body by the deliver of energy (European Commission, 2007, Mirmiran et al, 2009).
Because the main active components could be destroyed during processing, fruits have to be consumed mainly as fresh fruits, sometimes as dried fruits or slightly processed in canned fruits, jams and cakes.
Age, gender, social-economic status, preference, environment, perception of healthiness, meal patterns and dietary behavior are considered among the main factors influencing fruit consumption.
Because fruit consumption is not a corresponding one in different countries, many international organizations have on their agenda as a goal the increase of fruit consumption and also various programs and initiatives have been developed in this respect ( EUFIC ORG, Sorensen, 2004, WHO, 2012).
Romania has a high potential for producing a large assortment of fruits, because of its geographical position, soil and climate conditions, long tradition in fruit growing, high biological and productive potential fruit varieties achieved by the research stations (Coman et al., 2012,) and fruit trees growing technologies and management are continuously adapted to market requirements in order to satisfy consumer need better (Popescu Agatha, 2012, Sumedrea et al., 2012).
In this context, the paper aimed to identify the main trends in Romania’s fruit market during the period 1990-2010 and also the position of Romania within the EU regarding fruit production and consumption.
MATERIALS AND METHODS
165
orchards, its share in the cultivated area and distribution in the territory, fruit production at country level, but also by macro-regions and counties, Romania’s contribution to the EU fruit production, fruit production per inhabitant, fruit consumption, Romania’s fruit trade.
In this purpose, the index method, share method and comparison methods were used.
RESULTS AND DISCUSSIONS
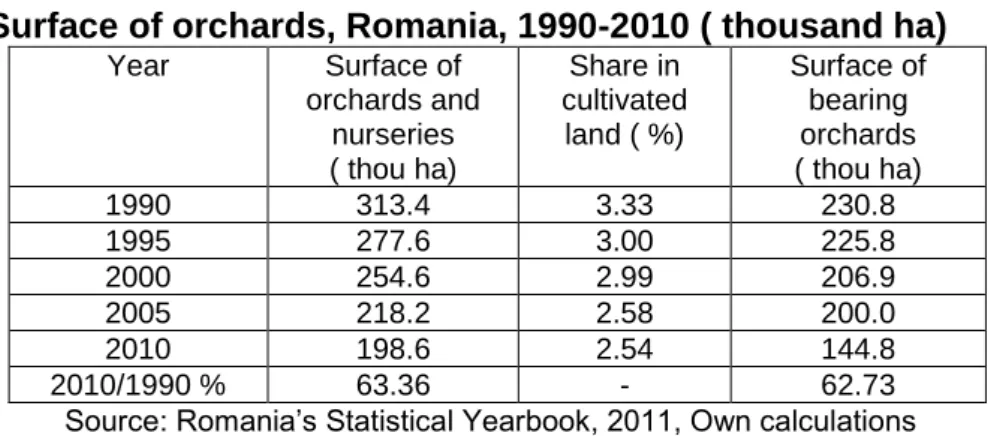
The surface of orchards decreased by 36 % from 313.4 thousand ha in 1990 to 198.6 thousand ha in 2010. This was caused by the dissolution of the old producing units, the orchards aging which were not able any longer to produce in an efficient way, the reduced investments in new plantations. Climate change and the extreme meteo phenomena during the last years have affected plantations and increased production costs due to the higher number of sprayings and other plant protection measures.
The surface of bearing orchards declined by 3 % from 230.8 thousand ha in 1990 to 144.8 thousand ha in 2010. Its share in the total surface of orchards was 7.36 % in 1990 and 0.729 % in 2010 (Table 1).
Table 1
Surface of orchards, Romania, 1990-2010 ( thousand ha)
Year Surface of
orchards and nurseries ( thou ha)
Share in cultivated
land ( %)
Surface of bearing orchards ( thou ha)
1990 313.4 3.33 230.8
1995 277.6 3.00 225.8
2000 254.6 2.99 206.9
2005 218.2 2.58 200.0
2010 198.6 2.54 144.8
2010/1990 % 63.36 - 62.73
Source: Romania’s Statistical Yearbook, 2011, Own calculations
As a result, the share of orchards surface in the total cultivated area decreased from 3.33 % in 1990 to 2.54 % in 2010.
The orchards are spread in various regions of the country, taking into account the long tradition in fruit tree growing and favorable conditions across the time.
The most suitable areas for fruit tree growing are South Muntenia region which is placed on the top with 42,093 ha ( 29 %), North Western Romania accounting for 25,200 ha ( 17.3 %), South and Western Oltenia region accounting for 23,676 ha ( 16.3 %) and Western Romania with 18,149 ha (12.6%). In 2010, the distribution of the orchards in the territory was the following one: M3-macro-region 42,587 ha (29.4 %), M4-macro-region 41,825 ha (28.9 %), M1-macro-region 33,335 ha ( 23 %) and M2-macro-region 27,097 ha (18.7%) (Romania’s Statistical Yearbook, 2011).
The largest surface with orchards are in the following counties: Arges, Valcea, Caras-Severin, Prahova, Buzau, Dambovitza, Timis, Bistritza-Nasaud, Gorj, Mehedintzi, Dolj, Satu Mare, Maramures. The smallest surfaces with orchards are situated in Bucharest, Ilfov and Calarasi areas.
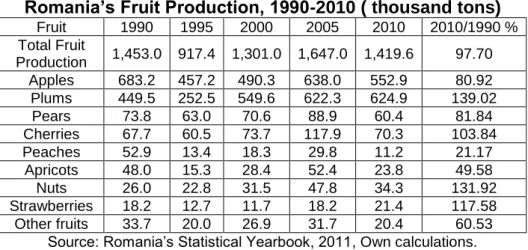
Fruit production declined from 1,453 thousand tons in 1990 to 1,420 thousand tons in 2010. The lowest production, 917.4 thousand tons, was recorded in 1995.
Since the year 2000, it was noticed a slight recover and production has continuously increased grace to a few investments in new technologies and plantations so that in 2005, Romania recorded the top fruit production accounting for 1,647 thousand tons.
166
addition melons, grapes and forest fruits. The open frontiers after 1990 have enlarged the offer with imported fruits such as: oranges, lemons, tangerines, grapefruits, bananas, pine apple, mango, pomelo, dates, figs, peanuts, almonds etc.
The domestic production varies from a fruit tree species to another. Apples have been on the top position till 2010. Their production accounted for 613.2 thousand tons in 1990 and declined by 20 % till 2010, reaching 552.9 thousand tons. The plum production started to increase after the year 2000 and in 2010 reached 624.9 thousand tons passing on the 1st position. While pears, peaches and apricots registered a lower production in the analyzed period, nuts, strawberries and cherries recorded a higher performance ( Table 2).
Table 2
Romania’s Fruit Production, 1990-2010 ( thousand tons)
Fruit 1990 1995 2000 2005 2010 2010/1990 %
Total Fruit
Production 1,453.0 917.4 1,301.0 1,647.0 1,419.6 97.70
Apples 683.2 457.2 490.3 638.0 552.9 80.92
Plums 449.5 252.5 549.6 622.3 624.9 139.02
Pears 73.8 63.0 70.6 88.9 60.4 81.84
Cherries 67.7 60.5 73.7 117.9 70.3 103.84
Peaches 52.9 13.4 18.3 29.8 11.2 21.17
Apricots 48.0 15.3 28.4 52.4 23.8 49.58
Nuts 26.0 22.8 31.5 47.8 34.3 131.92
Strawberries 18.2 12.7 11.7 18.2 21.4 117.58
Other fruits 33.7 20.0 26.9 31.7 20.4 60.53
Source: Romania’s Statistical Yearbook, 2011, Own calculations.
The plums and apples bring the highest contribution to fruit production. In 2010, their market share was 82.95 % compared to 77.9 % in 1990.
Other sorts of fruits contributed as follows: peaches 4.95 %, pears 4.25 %, nuts 2.41 %, apricots 1.67 %, strawberries 1.50 % ( Table 3).
The distribution of fruit production in the territory followed the same evolution like orchards surface. In 2010, the highest fruit production was registered by M3 macro-region, accounting for 402,402 tons, representing 28.34 % of the total production. This was due to the Southern Muntenia region which contributed by 398,864 tons ( 28.09 %) to fruit production.
The M1 macro-region produced 347,503 tons (24.47 %), M2 macro-region 339,997 tons (23.94 %) and M4 macro-region 329,716 tons (23.25 %). The lowest fruit production was noticed in Bucharest, Ilfov and Calarasi areas ( 3,538 tons, 0.25 % of fruit production).
Table 3
Contribution of various fruits to Total Fruit Production, Romania (%)
Fruit 1990 2010
Total production
100 100
Apples 47.0 38.94
Plums 30.90 44.01
Pears 5.08 4.25
Cherries 4.66 0.78
Peaches 3.64 4.95
Apricots 3.30 1.67
Nuts 1.79 2.41
Strawberries 1.25 1.50
Other fruits 2.32 1.49
167
Romania’s contribution to the EU fruit production is very important. Romania contributed by 3.01 % to the EU production, being situated on the 8 position.
The EU production registered a slight increase by 8.57 % in 2009 compared to 1990, accounting for 47,139 thousand tons, in 2010 it recorded a deep decline reaching 36 million tons, being by 7.8 % lower than in 2009. A number of 8 producing countries contributed by 98.65 % to the EU fruit production in 2010, as follows: Italy 38.95 %, France 19.16 %, Spain 16.24 %, Greece 8.44 %, Germany 5.95 %, Portugal 3.82 %, Hungary 3.08 % and Romania 3.01 %.
In the EU fruit production had a increasing trend in Italy ( +7.30 %), Greece ( +1.50 %) and Romania while in the other countries it declined: Germany ( -42 %), Hungary (-37 %0, Portugal (-25 %), France (-24 %) and Spain (-14 %) ( Table 4).
Table 4
Romania’s contribution to the EU Fruit Production, 1990-2009 ( thousand tons)
Country 1990 1995 2000 2005 2009 2009/1990 %
EU-27 43,415 38,938 42,272 44,211 47,139 108.57
Italy 17,112 16,260 17,889 18,216 18,362 107.30
France 11,942 11,251 11,265 10,297 9,033 75.64
Spain 8,901 6,338 7,319 6,970 7,657 86.02
Germany 4,854 2,202 3,088 2,687 2,809 57.86
Greece 3,922 4,050 4,151 3,756 3,981 101.50
Portugal 2,417 1,925 1,917 1,842 1,801 74.51
Hungary 2,306 1,229 1,726 1,215 1,452 62.96
Romania 1,453 917 1,301 1,647 1,420 97.72
Source: EuroStat, 2011, Romania’s Statistical Yearbook, 2011, Own calculations.
Fruit production per Romanian inhabitant accounted for 66.2 kg in the year 2010, being smaller compared to the peak of 76.2 kg in 2005 and 94 kg in the EU in 2009 and even with 71.8 kg in 2010. The difference between fruit production per capita in Romania and the EU average registered a large variation from a period to another. However, in 2010, the difference was the smallest one, only 5.8 kg/capita ( Table 5).
Table 5
Fruit Production/inhabitant, 1990-2010 (kg/capita) 1990 1995 2000 2005 2010 2010/1990 %
Romania* 62.8 40.4 58.0 76.2 66.2 105.41
UE** 99 87 94 90 72 72.72
Differences -36.2 -46.4 -36 -13.8 -5.8 16.02
Source:*Romania’s Statistical Yearbook, 2011, **EuroStat, 2011, Own calculations.
In Romania, fruit production/capita is still far away from other EU countries. There are EU countries where fruit production has the highest level: Greece 307 kg, Italy 306 kg, Spain 166 kg, France 141 kg, despite that in these countries fruit production declined, except Italy.
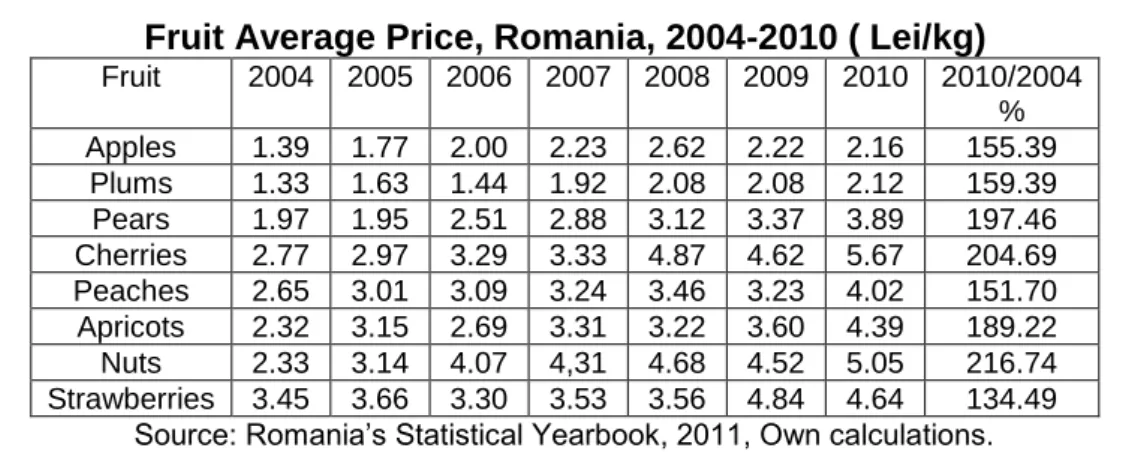
Fruit consumption accounted for 63.3 kg/inhabitant in Romania ( INSSE, 2011) and 86 kg/capita in the EU ( EuroStat, 2011), a very low level compared to the minimum provided by WHO for a healthy diet. The trend varies from a country to another and is very worrying ( Martinez-Palou et al., 2008). However in a few EU countries fruit and vegetable intake is very high: Cyprus 748 g/day and Greece 717 g/day. In Romania fruit consumption is still low because of the economic crises, low purchasing power, increased fruit price, factors which determined consumers to be more oriented to cheaper fruits such as: nuts, apples, plums and buy less strawberries, apricots and peaches ( Socaciu, 2011).
168
Table 6
Fruit Average Price, Romania, 2004-2010 ( Lei/kg)
Fruit 2004 2005 2006 2007 2008 2009 2010 2010/2004
%
Apples 1.39 1.77 2.00 2.23 2.62 2.22 2.16 155.39
Plums 1.33 1.63 1.44 1.92 2.08 2.08 2.12 159.39
Pears 1.97 1.95 2.51 2.88 3.12 3.37 3.89 197.46
Cherries 2.77 2.97 3.29 3.33 4.87 4.62 5.67 204.69
Peaches 2.65 3.01 3.09 3.24 3.46 3.23 4.02 151.70
Apricots 2.32 3.15 2.69 3.31 3.22 3.60 4.39 189.22
Nuts 2.33 3.14 4.07 4,31 4.68 4.52 5.05 216.74
Strawberries 3.45 3.66 3.30 3.53 3.56 4.84 4.64 134.49
Source: Romania’s Statistical Yearbook, 2011, Own calculations.
Fruit trade has been continuously developing mainly after 1990 due to the open borders and Romania entry into the EU in 2007. Romania’s fruit trade is characterized by a continuous higher increase of import but also of export. Despite this, Romania is a net importing country as import value is higher than export value. The positive easpect is that export value increased by 55 % while import value increased by 7.76 % in the period 2006-2010. In 2010, Romania fruit import value accounted for Euro million 177.6 while export value was Euro million 61.3 ( Table 7).
Table 7
Romania’s Fruit Trade, 2006-2010 ( Euro Million)
2006 2007 2008 2009 2010 2010/
2006 %
Export 39.5 38.5 33.4 38.8 61.3 155.18
Import 164.8 245.1 245.3 175.7 177.6 107.70
Deficit balance
125.3 206.6 211.9 136.9 116.3 92.81
Export/ Import
0.23 0.16 0.14 0.22 0.35 152.17
Source: CRCIS, Motofelea, 2011. Own calculations.
CONCLUSIONS
Fruit market in Romania is continuously developing, being stimulated by consumption growth. Despite that the surface of orchards is smaller and production declined, during the last years it was noticed a recover due to some investments in new technologies and plantations.
Fruit offer is diversified and consists mainly by domestic production and also imported fruits.
Romania si an important fruit producer in the EU coming on the 8th position. It as to strengthen this position emphasizing on fruit quality, competitiveness and promotion.
169
BIBLIOGRAPHY
Coman, M., Militaru, Madalina, Butac Madalina, 2012, Fruit varieties breeding in Romania:from the beginning to present, Annals of the Academy of Romanian Scientists, Vo.1(1):43-52
Martinez-Palou, A, Rohner-Thielen, E., 2008, Fruit and vegetables: fresh and healthy on European tables. Eurostat Statistics in focus 60/2008
Mirmiran, P. et al., 2009, Fruit and vegetable consumption and risk factors for cardiovascular diseases. Metabolism, 58(4):460-468
Motofelea, C., 2011, Romania-Vegetables and Fruits, Sectorial Analysis, Romanian Center for Investments and Trade,pp.8.
Popescu Agatha, 2012, Research regarding the trends in Romania’s apple market,
Analele Universitatii Craiova-seria Agricultura, Montanologie, Cadastru, Vol.XLII(2):408-413
Pridie, E., 2004, My family book, Ceres Publishing House, Bucharest, p.68-70
Socaciu, I., 2011, How many fruits eat a Romanian in crisis? www.econtext.ro
Sorensen, G. et al., 2004, Worksite-based research and initiatives to increase fruit and vegetable consumption. Preventive Medicine 39, Suppl.2:S94-100.
Sumedrea, D.I., Chitu, E., Tanasescu, N., Butac Madalina, 2012, Fruit growing technologies-present and perspectives, Annals of the Academy of Romanian Scientists, Vo.1(1):65-76
Agriculture in the EU, Statistical Economic Information 2011, Martie 2012
Evaluation of the European Fruit School Scheme. European Commission. Directorate General for Agriculture and Rural Development, Chaoter 2, pp.6-7. www.epp.eurostat.ec.europa.eu
Fresh fruit and vegetable production, trade and consumption monitor in the EU-27, 2011, www.freshfel.org
Fruit Consumption in the EU, World Health Organization,2011 Fruit Production, 2011, www.epp.eurostat.ec.europa.eu
Fruit and vegetable consumption in Europe. Do Europeans get enough?, www.eufic.org/article
Global Health Risks, WHO, World Health Organization,2012, Geneva, Switzerland European Commission, 2007, White Paper on a Strategy for Europe on Nutrition; overweight and obesity related to health issues.COM.279 final, 30 May 2007, E.C.Brussels