MJCCA9 – 735 ISSN 1857-5552 e-ISSN 1857-5625
Received: May 4, 2017 DOI: 10.20450/mjcce.2017.1210
Accepted: October 17, 2017 Original scientific paper
DEVELOPMENT AND VALIDATION OF A FAST, SIMPLE, COST-EFFECTIVE
AND ROBUST HPLC METHOD FOR LISINOPRIL DETERMINATION IN SOLID
PHARMACEUTICAL DOSAGE FORMS
Tanja Bakovska Stoimenova1,2, Marjan Piponski2, Gordana Trendovska Serafimovska2, Marina Stefova1
1
Institute of Chemistry, Faculty of Natural Sciences and Mathematics, Ss. Cyril and Methodius University, Skopje, Republic of Macedonia
2
Replek Farm Ltd, Quality Control Department, Skopje, Republic of Macedonia
A fast, simple, cost-effective and robust chromatographic method was developed and validated for determination of the antihypertensive drug lisinopril dihydrate in tablets under routine operational condi-tions, without ion-pair reagents, high column temperatures and an acidic mobile phase. Taking into con-sideration all four different pKa values of lisinopril, the separation was optimized using the C18 column
(end-capped, 150 mm × 4.6 mm 5 µm) and a mobile phase composed of methanol and ammonium (or po-tassium) dihydrogen phosphate buffer (pH 7.2) with a flow rate of 1.1 ml/min, UV detection at 214 nm and a temperature of 40 °C. These optimized conditions led to the production of a single and symmetrical peak for lisinopril. This mobile phase is suitable for different HPLC columns, which makes it appropriate for industrial quality control laboratories. The developed method was validated, showing excellent valida-tion results and the possibility to be implemented for the determinavalida-tion of lisinopril in combined dosage forms with other active substances.
Keywords: lisinopril dihydrate; tablets; HPLC; optimization; validation
РАЗВОЈ И ВАЛИДАЦИЈА НА БРЗ, ЕДНОСТАВЕН, ЕКОНОМИЧЕН И РОБУСТЕН HPLC-МЕТОД ЗА ОПРЕДЕЛУВАЊЕ НА ЛИЗИНОПРИЛ ВО ЦВРСТИ ФАРМАЦЕВТСКИ ДОЗИРАНИ ФОРМИ
Развиен е и валидиран брз, едноставен, економичен и робустен хроматографски метод за определување на антихипертензивниот лек лизиноприл дихидрат во таблети, кој е погоден за примена во рутинска контрола бидејќи не вклучува употреба на реагенси со јонски парови, високи температури на колоната и кисела мобилна фаза. Имајќи ги предвид сите четири различни вредности на pKa на лизиноприл, хроматографското разделување е оптимизирано со употреба на
колоната C18 (специјално деактивирана, [анг. end-capped], 150 mm × 4.6 mm 5 µm) и мобилна фаза составена од метанол и амониум (или калиум) дихидрогенфосфатен пуфер (pH 7,2) со проток од 1,1 ml/min, UV детекција на бранова должина од 214 nm и температура на колоната од 40 °C. При овие утврдени најдобри услови се добива еден симетричен пик од лизиноприл. Оваа мобилна фаза е погодна за употреба со различни HPLC колони, што ја прави соодветна за лаборатории за контрола на квалитет во индустријата. Развиениот метод е валидиран при што се добиени одлични резултати кои овозможуваат негова имплементација за определување на лизиноприл во комбинирани дозирани форми заедно со други активни супстанци.
1. INTRODUCTION
Lisinopril dihydrate (Fig. 1) is a member of the group of antihypertensive drugs from the ACE (angiotensin converting enzyme) inhibitors class, defined in the European pharmacopoeia [1] as 1-[N-[(s)-1-carboxy-3-phenylpropyl]-L-lysyl]-L-proline dihydrate, with the IUPAC name: (2S)-1-[(2S)-6-amino-2-[[(1S)-1-carboxy-3-phenylpropyl]amino] hexanoyl]pyrrolidine-2-carboxylic acid. It was the third ACE inhibitor (after captopril and enalapril) that was introduced into therapy in the early 1990s [2]. Despite this, lisinopril is still one of the most commonly prescribed and used ACE inhibitors, being among the first three best buy ACEIs for high blood pressure treatment, and it is a best buy drug for most people who need an ACEI after a heart attack, taking the cost and convenience into account [3]. Among the analytical methods for the determination of lisinopril, HPLC methods are the usual methods of choice [1, 4–15]. Besides HPLC, some UV-spectrophotometric and spectrofluoro-metric methods, without [16] or with the derivati-zation of lisinopril [7, 17–23] or using derivative spectrophotometry [24, 25], can also be applied, but these methods are very restrictive and not pre-ferred in pharmaceutical analysis. Lisinopril dihyd-rate has UV absorbance maximum in the low UV region at wavelengths of about 210–220 nm, which complicates its UV spectral analysis because of the interferences of other components present in phar-maceutical formulations.
N
N
C O2H
H O
H O2C H H
H2N
H
2 H2O
Fig. 1. Chemical structure of lisinopril dihydrate
The presence of the proline moiety compli-cates the HPLC determination of lisinopril dihy-drate, causing peak splitting or extensive peak tail-ing, which is often solved by using alkyl-sulfonate ion-pair reagents (most frequently hexanesul-fonate, and rarely heptansulfonate or octan-sulfonate). The use of ion-pair reagents in HPLC methods for lisinopril determination is almost al-ways accompanied by high column temperatures and low pH values of mobile phases, which are the three well known RP bonded phase column
de-stroyers. Even in the three Pharmacopoeias, EP [1], BP [4] and USP [5], quantification methods for lisinopril prescribe the use of hexanesulfonate and phosphate buffer (pH 2.0) in the mobile phase and a column temperature of 50 °C, to avoid lisinopril peak splitting and tailing. Very low pH and high temperatures are not recommended by the majority of column vendors. Moreover, the use of ion-pair reagents permanently changes the column charac-teristics and reserves its use only for ion pair em-ploying separations.
There are diverse published HPLC methods that make use of the above-mentioned critical pa-rameters: mobile phases in a wide pH region, from 2 to 7.5, with or without the use of ion-pair rea-gents and column temperatures from ambient up to 60 °C. Rao and Rani [10] used a Kromasil C18, 250 mm × 4.6 mm column at 50 °C with UV de-tection at 210 nm, a mobile phase composed of acetonitrile and phosphate buffer without precisely defined pH value (4:96, v/v), with a flow rate of 1 ml/min, and obtained a symmetrical peak with a retention time of 9.217 minutes; Adam et al. [12] developed and validated a method using a Waters Spherisorb C18 column, 250 mm × 4.6 mm, with 5 µm particles, signal monitoring at 210 nm, a mo-bile phase composed of tetrabutyl ammonium hy-droxide solution (pH 6.5; 0.03 M) and acetonitrile (4:1, v/v), a flow rate of 1.0 ml/min, and the sepa-ration was completed within 3.49 minutes; Raju and Rao [13] proposed a method using a C8 X-Terra 150 mm × 4.6 mm column with 3.5 µm par-ticles, UV detection at 215 nm with a mobile phase consisting of potassium dihydrogen phosphate buffer (0.7 %, w/v) with triethylamine (0.2 %, w/v) (pH 3.0) and methanol (35:65, v/v), which led to an early eluting time for lisinopril of 2.3 minutes, with a flow rate of 0.8 ml/min; Chander et al. [14] published a method for lisinopril determination with use of Nucleosil 125 mm × 4 mm column with 5 µm particles as the stationary phase and a mobile phase consisting of buffer solution, isopro-pyl alcohol and triethylamine (95:5:0.1, v/v/v) at a flow rate of 1.0 ml/min, column temperature of 50 °C and detection at 215 nm, with a run time of 7 min; and Maslarska and Tencheva [15] used a Li-chrospher C18, 250 mm × 4 mm column with 10 µm particles, a mobile phase composed of acetoni-trile and phosphate buffer (pH 2.0) at 35 °C and UV detection at 215 nm.
the use of any of the above-mentioned conditions that are considered harmful for HPLC columns.
2. EXPERIMENTAL
2.1. Chemicals and reagents
All of the chemicals used were EP grade. Methanol, acetonitrile, and ammonium dihydrogen phosphate (NH4H2PO4) were purchased from Carlo
Erba, France, 25 % ammonium hydroxide solution and 85 % o-phosphoric acid were purchased from Sigma–Aldrich, USA, potassium dihydrogen phos-phate (KH2PO4) and 37 % hydrochloric acid were
purchased from Merck, Darmstadt, Germany, 30 % hydrogen peroxide was purchased from Alkaloid, Macedonia, and sodium hydroxide was purchased from Riedel-de Haën, Germany. The demineral-ized water with conductivity less than 1 µS was produced by a Stilman apparatus.
The standard substance of lisinopril (with potency of 100.09 % and water content of 8.65 %, standardized versus reference standard) and Lis-inopril tablets were obtained from Replek Farm Ltd., Skopje, Macedonia.
2.2. Preparation of solutions
Samples and standards for dissolution test-ing of Lisinopril tablets were prepared in 0.1 M hydrochloric acid, to a final, working concentration of 0.01 mg lisinopril/ml.
Samples and standards for assay and the uni-formity of dosage unit testing of Lisinopril tablets were prepared in diluent composed of water and methanol (75:25, v/v), in a final working concen-tration of 0.1 mg lisinopril/ml.
Placebo solutions, in both cases, were suita-bly prepared from the excipients present in the tab-let formulation.
2.3. Equipment
2.3.1. Instruments
Samples were weighed using OHAUS Pio-neerTM balance with an accuracy of 0.1 mg. For pH adjustment of the mobile phase buffer, a HANNA Instruments HI113 pH meter was used.
Four HPLC systems were used. Three were used for method development and the optimization of experimental parameters, while the fourth was used for method validation of the finally defined method:
UPLC system Shimadzu Nexera XR with low pressure mixing quaternary pump, au-tosampler, column oven, controller and PDA detector, controlled by Lab Solutions software;
UHPLC Dionex Ultimate 3000 with low pres-sure mixing quaternary pump, autosampler, column oven and four channel UV-Vis detec-tor and Chromeleon software;
HPLC Varian ProStar with ternary high pres-sure mixing pump, autosampler with column oven and Photo Diode Array detector, con-trolled by software Varian-Star;
HPLC Agilent Technologies 1200 series with low pressure mixing quaternary pump, au-tosampler, column oven, controller and PDA and ion trap MS detector, controlled by Chem-Station software.
2.3.2. Analytical columns
The following HPLC columns were tested: Purospher C18e STAR 125 mm × 4 mm, 5 µm particles, Lichrospher 100 C18e 125 mm × 4 mm, 5 µm particles and Purospher C18e STAR 150 mm × 4.6 mm, 5 µm particles, all used with 4 mm × 4 mm C18e pre-column and product of Merck, Darmstadt, Germany; Discovery C18 100 mm × 4.6 mm, 5 µm particle size (Supelco, Bellefonte, USA); Nucleosil C18 250 mm × 4.6 mm, 10 µm particles (Macherey-Nagel, Germany); RP Select B 75 mm × 4 mm, 5 µm particle size and Purospher C8 55 mm × 4 mm, 5 µm particle size (Merck, Darmstadt, Germany).
3. RESULTS AND DISCUSSION
3.1. Method development and optimization
The method development started with the se-lection of the most appropriate buffer to be used as a mobile phase constituent. For this purpose, the four different pKa values for lisinopril were considered:
pKa1 = 2.5, pKa2 = 4.0, pKa3 = 6.7 and pKa4 = 10.1
[26]. Chromatographic theory suggests avoiding the pH of mobile phases in the proximity of the pKa values of analytes, if possible up to at least ±1
pH unit [27]. The widest interval is between pKa3
and pKa4, which seemed a good option, and this pH
phase C18 and C8 matrices, in order to achieve the applicability of the method for as much variety of HPLC columns as possible.
Two buffer solutions were tested with the same pH value of 7.2: 20 mM potassium rogen phosphate and 20 mM ammonium dihyd-rogen phosphate buffer solution, adjusted to pH 7.2 with sodium hydroxide and ammonium hydroxide, respectively. The increase in the pH value of mix-tures of buffers with methanol of about 0.15 pH units for every 10 % methanol present in the mix-ture [28] was taken into consideration. The use of the much more soluble ammonium dihydrogen phosphate was preferred in combination with the more miscible methanol, compared to acetonitrile, especially in buffers with pH higher than 6, when the solubility of binary mobile phase exponentially decreases.
The other limiting factor that had to be kept in mind was the low wavelength (~215 nm) at which lisinopril shows maximum absorbance, which restricts the use of mobile phase compo-nents with high UV cut-off values, such as inor-ganic buffers or orinor-ganic modifiers and tailing cor-recting additives that absorb at low wavelengths. Therefore, the use of buffering components like acetate, citrate and formate as well as tetrahydrofu-ran and triethylamine as tailing correctors should
have been avoided. So, the conclusion was to use a stable, UV transparent buffer such as a phosphate buffer combined with methanol.
As a result, the goal was to obtain a symmet-rical chromatographic peak of lisinopril, using a mobile phase with pH 7–7.5 without using ion pair reagents and column heating, even though previous studies [29, 30] demonstrated that these factors cause isomerization, i.e. rotamerization of lis-inopril leading to splitting and/or tailing of the ob-tained chromatographic peak.
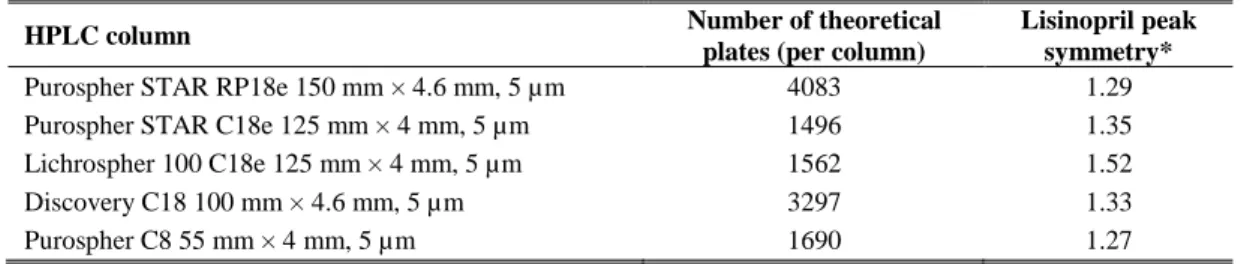
Since the choice of an appropriate RP col-umn is very important, the high purity, base deac-tivated and end-capped silica based matrices gave better results (Fig. 2, Tab. 1). That is why, from all of the tested columns, Purospher STAR RP18e 150 mm × 4.6 mm, 5 µm, the column that gave a chromatographic peak with best symmetry, was finally chosen to be used for method validation. Nevertheless, the method was shown to be equally applicable with C18 and C8 bonded reversed phase columns (Table 1). The choice of C18 as the pre-ferred column was also based on the well docu-mented stability of longer alkyl-chains attached to silica matrices in alkaline mobile phases and long-er analyte retention which increases the column capacity.
Fig. 2. Chromatograms obtained using: a) Lichrospher 100 C18e 125 mm × 4 mm, 5 µm HPLC column; symmetry factor 1.521(USP); in order to achieve the same RT of lisinopril as when using the finally proposed HPLC column, mobile phase composition and flow rate were suitably changed: ammonium dihydrogen phosphate buffer (pH 7.2; 20 mM) and methanol (65:35, v/v), with a flow rate of 0.8 ml/min; b) Purospher STAR RP18e 150 mm × 4.6 mm, 5 µm HPLC column, ammonium
T a b l e 1
System suitability results obtained with different types of tested HPLC columns
HPLC column Number of theoretical
plates (per column)
Lisinopril peak symmetry*
Purospher STAR RP18e 150 mm × 4.6 mm, 5 µm 4083 1.29
Purospher STAR C18e 125 mm × 4 mm, 5 µm 1496 1.35
Lichrospher 100 C18e 125 mm × 4 mm, 5 µm 1562 1.52
Discovery C18 100 mm × 4.6 mm, 5 µm 3297 1.33
Purospher C8 55 mm × 4 mm, 5 µm 1690 1.27
*Calculated according to USP
Finally, the proposed method uses Purospher STAR RP18e 150 mm × 4.6 mm, 5 µm HPLC col-umn, thermostated at 40 °C, with a mobile phase composed of ammonium dihydrogen phosphate buffer (pH 7.2; 20 mM) and methanol (60:40, v/v), with a flow rate of 1.1 ml/min, signal monitoring at 214 nm and an injection volume 20 µl. These HPLC conditions can be used for dissolution, assay and uniformity of dosage unit testing for various strengths of Lisinopril tablets.
The retention factor (k’) of the peak of
lis-inopril using this HPLC column and conditions is ~0.75. Although it is lower than 1, it yields satisfy-ing results in respect to all validation parameters and allows shorter analysis times.
This method was completely validated ac-cording to the ICH guidelines for the validation of analytical procedures Q2 (R1) [31].
3.2. Method validation
3.2.1. Selectivity
In order to demonstrate the selectivity of the developed method, chromatograms of placebo, standard and test solutions, prepared suitably as for dissolution and assay testing of lisinopril, were analyzed. No interference was detected between the solvent or placebo components with the chro-matographic peak originating from the active sub-stance, lisinopril, with a retention time of 3.0 minutes (Fig. 3).
Fig. 3. Selectivity of the method for dissolution testing of Lisinopril tablets: a) Placebo solution; b) Test solution with concentration approximately 0.01 mg lisinopril/ml;
Furthermore, forced degradation studies were performed under the following conditions: tablet powder treated for 24 hours with 0.1 M NaOH (base hydrolysis), 0.1 M HCl (acid hydroly-sis) and 3% v/v H2O2 (oxidation). After 24 hours,
all of the prepared samples were neutralized and diluted to a final concentration of 0.1 mg lis-inopril/ml. These solutions were then analyzed with the developed HPLC method. There were no interferences detected between the degradation products of lisinopril obtained during the per-formed forced degradation study, and the active
substance itself. Only oxidative degradation yield-ed a few degradation products during this time. All of the detected peaks from the degradation prod-ucts are well separated from the lisinopril peak (Fig. 4). PDA analysis of the lisinopril peak showed that the peak is pure in all three cases and that the proposed method is selective for lisinopril determination. Peak purity factor calculated by ChemStation software of Agilent HPLC for the peak of lisinopril, in all three performed degrada-tion studies, is greater than 999.96.
Fig. 4. Chromatograms obtained from forced degradation studies performed on Lisinopril tablets, during a time period of 24 hours: a) Oxidation with 3% v/v H2O2; b) Base hydrolysis with 0.1 M NaOH; and c) Acid hydrolysis with 0.1 M HCl
3.2.2. Accuracy
The accuracy of the method was examined using 9 determinations over three concentration levels in the interval between 50 % and 150 % of the working concentration for dissolution and as-say and uniformity of dosage units testing of Lis-inopril tablets, i.e. between 0.005 mg/ml and 0.015 mg/ml for dissolution testing and 0.05 mg/ml and 0.15 mg/ml for assay and uniformity of dosage unit testing. The analytical procedure was applied to synthetic mixtures of the drug product components with known added amounts of the active substance, corresponding to these concentration levels. Ob-tained recovery in both cases was between 98 % and 102 %, the RSD of the obtained results was
lower than 1 % and the correlation coefficient (R) and the slope were almost ideal (~1.0) (Tab. 2).
3.2.3. Precision
T a b l e 2
Accuracy of the method for dissolution and assay/uniformity of dosage unit testing of Lisinopril tablets
Approximate level Recovery (%) for dissolution testing (n = 3)
Recovery (%) for assay/uniformity of dosage units testing (n = 3)
50 % 101.44 99.41
100 % 101.51 98.96
150 % 101.44 99.61
RSD = 0.27 RSD = 0.33
Correlation coefficient (R) = 0.9999 Correlation coefficient (R) = 0.9999 Slope = 1.0144 Slope = 0.9969
Method repeatability was demonstrated by preparing 6 individual test solutions, from the same homogenous sample. The RSD value from the ob-tained % of dissolved or present active substance was calculated and was lower than 2% in both cas-es (RSD = 0.36 for the dissolution tcas-esting method and RSD = 1.11 for the assay and uniformity of dosage units testing method).
The intermediate precision of the method for determination of the quantity of lisinopril/tablet was also proven, since the RSD value of the per-cent obtained of 12 test solutions prepared on two different days (6 test solutions in the first day, for method repeatability testing, and another 6 test solutions prepared in the second day, from the same homogenous sample) was found to be 1.1 %.
3.2.4. Linearity and range
Linearity of the method for dissolution test-ing was proven for five concentration levels in the range between 40 % (corresponding to c ~ 0.004 mg/ml) and 150 % (corresponding to c ~ 0.015 mg/ml) from the working concentration. All con-centration levels were prepared with suitable dilu-tions of the standard solution prepared with con-centrations of 0.02 mg/ml which is two times high-er than the working concentration, 0.01 mg/ml. RSD of the obtained response factors was much lower than 2% (0.29%), the linearity regression equation was y = 37.71x – 1.31 and the correlation coefficient obtained was ideal, R2 = 1.0000.
Linearity of the method for assay and uni-formity of dosage units testing was also checked and confirmed in five concentration levels in the range between 50 % (corresponding to c ~ 0.05 mg/ml) and 150 % (corresponding to c ~ 0.15 mg/ml) from the working concentration. All con-centration levels were prepared with suitable dilu-tions of the standard solution prepared with a con-centration of 0.2 mg/ml, which is two times higher than the working concentration, 0.1 mg/ml. The RSD of the obtained response factors was much
lower than 2 % (0.10 %), linearity regression equa-tion was y = 37.87x – 1.10 and the correlation coef-ficient obtained was ideal in this case as well, R2 = 1.0000.
3.2.5. Stability of the standard solutions
It was confirmed that the standard solutions are stable and can be used for up to 24 hours after preparation. The difference between peak areas of the standard solution for dissolution testing of Lis-inopril tablets immediately after preparation and after 24 hours is less than 2 % (0.84 % exactly). The difference between peak areas of the standard solution for assay and uniformity of dosage units testing of Lisinopril tablets, immediately after preparation and after 24 hours, is also less than 2 % (0.95 % exactly).
3.2.6. Filter study
A filter study was also conducted in order to determine whether the type of filter used would have an impact on the final result. The test solution for assay and uniformity of dosage unit testing, before filling in a vial, was filtered through a 0.45 µm Nylon filter and through a 0.45 µm RC (Re-generated cellulose) filter. The difference between the obtained assay results was minor, 0.56%, which implies that both types of filters can be used during sample preparation without affecting the results.
3.2.7. Robustness
of these changes on the peak area of lisinopril, re-tention time, peak symmetry and number of theo-retical plates, as system suitability parameters, was examined.
By varying the column temperature by ± 5 °C it was concluded that it does not significantly change the system suitability parameters. As expected, the number of theoretical plates increased while retention time decreased with the increased temperature, whereas peak symmetry was best with the prescribed column temperature of 40 °C (Tab. 3).
Mobile phase flow rate variations of ± 0.2 ml/min also did not cause any significant changes in the system suitability parameters. The number of theoretical plates and retention times slightly de-creased with increasing flow rate, while peak symmetry was best with the prescribed flow rate of 1.1 ml/min (Tab. 3).
By making changes in the methanol content in the mobile phase composition of ± 5 % (absolute) from the prescribed content of 40 % (v/v), it was concluded that with a higher content of methanol, the elution of lisinopril is faster, as expected, but the highest number of theoretical plates and best sym-metry factor were obtained using an eluent contain-ing 40 % methanol, as proposed (Tab. 3).
Taking into consideration all of the above presented results from the robustness testing and the fact that many columns with different proper-ties were successfully tested during method devel-opment, it can be concluded that the developed method is robust and the measurements and results from the analysis are not susceptible to inaccuracy in cases of intentional or accidental small varia-tions in HPLC condivaria-tions.
T a b l e 3
Influence of three HPLC variables: column temperature (± 5°C), mobile phase flow rate (± 0.2 ml/min) and methanol content in the mobile phase composition (± 5%), from the prescribed test conditions,
on the system suitability parameters
Variations in T ± 5 °C (35–45 °C)
Variations in mobile phase flow rate ± 0.2 ml/min
Variations in % of methanol in mobile phase ± 5% 35 °C 40 °C 45 °C 0.8 ml/min 1.1 ml/min 1.3 ml/min 35% 40% 45% No. of theoretical
plates (per column) 3993 4083 4155 4837 4083 3533 3866 4083 3922
tr/min 3.144 2.986 2.921 4.377 2.986 2.525 3.698 2.986 2.631
Peak symmetry 0.715 0.731 0.714 0.699 0.731 0.728 0.709 0.731 0.718
4. CONCLUSION
The developed HPLC method for the deter-mination of lisinopril can be used for dissolution, assay and uniformity of dosage unit testing of Lis-inopril tablets. Its main advantage when compared to other methods developed for this purpose, espe-cially with the pharmacopoeia methods, is in its satisfactory selectivity and peak shape and sym-metry obtained without using ion pair reagents, high column temperatures and mobile phases with low pH values, factors that can shorten the column life cycle or restrict their use. Of great importance is also the fact that it demonstrates that with care-ful choice and optimization of HPLC conditions, lisinopril peak splitting can be avoided when using a mobile phase with a high pH value. Finally, it is fast, simple, cost-effective, selective, precise, accu-rate and robust, and can be used for the routine analysis of Lisinopril tablets in quality control la-boratories.
REFERENCES
[1] European Pharmacopoeia, 8th ed., European Direc-torate for the Quality of Medicines – Council of Europe, Strasbourg, 2014.
[2] A. Patchett, E. Harris, E. Tristram, M. Wyvratt, M. Wu, D. Taub, E. Peterson, T. Ikeler, J. ten Broeke, L. Payne, D. Ondeyka, E. Thorsett, W. Greenlee, N. Lohr, R. Hoffsommer, H. Joshua, W. Ruyle, J. Rothrock, S. As-ter, A. Maycock, F. Robinson, R. Hirschmann, C. Sweet, E. Ulm, D. Gross, T. Vassil, C. Stone, A new class of angiotensin-converting enzyme inhibitors, Nature, 288 (5788), 280–283 (1980).
DOI: http://dx.doi.org/10.1038/288280a0
[3] Consumer Reports Health Best Buy Drugs, Using ACE inhibitors to treat: High blood pressure and heart dis-ease comparing effectiveness, safety and price, Consum-ers Union of United States, Inc., March 2011.
[4] British Pharmacopoeia Commission, British Pharmaco-poeia 2013, The Stationery Office, Norwich, 2012. [5] United States Pharmacopeia and National Formulary
[6] Society of Japanese Pharmacopoeia, Japanese Pharmaco-poeia, 16th ed., Tokyo, Maruzen Company Ltd., 2012. [7] A. El-Gindy, A. Ashour, L. Abdel-Fattah, M. M.
Sha-bana, Spectrophotometric, spectrofluorometric and LC determination of lisinopril, J. Pharm. Biomed. Anal., 25 (5–6), 913–922 (2001).
DOI: http://dx.doi.org/10.1016/S0731-7085(01)00376-4 [8] B. Stanisz, Kinetics of lisiopril degradation in solid phase,
React. Kinet. Catal. Lett., 85 (1), 145–152 (2005). DOI: http://dx.doi.org/10.1007/s11144-005-0254-x
[9] C. A. Beasley, J. Shaw, Z. Zhao, R. A. Reed, Develop-ment and validation of a stability indicating HPLC method for determination of lisinopril, lisinopril degra-dation product and parabens in the lisinopril extempora-neous formulation. J. Pharm. Biomed. Anal., 37 (3), 559–567 (2005).
DOI: http://dx.doi.org/10.1016/j.jpba.2004.11.021 [10] S. N. L. Rao, U. N. Rani, Estimation of lisinopril in
tablets by RP-HPLC method, Int. J. Chem. Sci., 7 (2), 1462–1466 (2009).
[11] R. Ludwig, Analysis of lisinopril by LC/UV using a core enhanced technology accucore RP-MS column, LCGC ASIA PACIFIC,14 (3), 38 (2011).
[12] E. Adam, I. Barakat, A. Saeed, Development and valida-tion of a high performance liquid chromatography meth-od for the determination of lisinopril dihydrate, Asian J. Pharm. Biol. Res., 2 (2), 94–99 (2012).
[13] V. B. Raju, A. L. Rao, Development, estimation and vali-dation of lisinopril in bulk and its pharmaceutical formula-tion by HPLC method, E-J. Chem.,9 (1), 340–344 (2012). DOI: http://dx.doi.org/10.1155/2012/292754
[14] V. Chander, M. Mohan, R. Seth, P. Singh, R. Singh, S. Gupta, Development and validation of RP-HPLC meth-od for estimation of lisinopril in tablet dosage form,
Anal. Chem. Lett. 2 (5), 309–313 (2012).
DOI: http://dx.doi.org/10.1080/22297928.2012.10648282 [15] V. Maslarska, J. Tencheva, Development of analytical
method for determination of lisinopril tablets using RP-HPLC method, Int. J. Pharm. Bio. Sci., 4 (4), 163–167 (2013).
[16] N. D. Preetham, K. Sujana, S. D. P. Sankar, Develop-ment and validation of UV spectrophotometric method for the estimation of lisinopril in bulk and pharmaceuti-cal formulation, Int. J. Pharm. Sci. Rev. Res., 25 (1), 257–259 (2014).
[17] A. F. El-Yazbi, H. H. Abdine, A. R. Shaalan, Spectro-photometric and spectrofluorometric methods for the as-say of lisinopril in single and multicomponent pharma-ceutical dosage forms, J. Pharm. Biomed. Anal.,19 (6), 819–827 (1999).
DOI: http://dx.doi.org/10.1016/S0731-7085(98)00110-1 [18] G. Paraskevas, J. Atta-Politou, M. Koupparis, Spectro-photometric determination of lisinopril in tablets using 1-fluoro-2,4-dinitrobenzene reagent, J. Pharm. Biomed. Anal.,29 (5), 865–872 (2002).
DOI: http://dx.doi.org/10.1016/S0731-7085(02)00207-8
[19] S. E. Aktas, L. Ersoy, O. Sagirli, A new spectrofluori-metric method for the determination of lisinopril in tab-lets, II Farmaco58 (2), 165–168 (2003).
DOI: http://dx.doi.org/10.1016/S0014-827X(02)00013-7 [20] A. A. El-Emam, S. H. Hansen, M. A. Moustafa, S. M.
El-Ashry, D. T. El-Sherbiny, Determination of lisinopril in dosage forms and spiked human plasma through deri-vatization with 7-chloro-4-nitrobenzo-2-oxa-1,3-diazole (NBD-Cl) followed by spectrophotometry or HPLC with fluorimetric detection, J. Pharm. Biomed. Anal.,34 (1), 35–44 (2004).
DOI: http://dx.doi.org/10.1016/j.japna.2003.08.021 [21] N. Rahman, N. Anwar, M. Kashif, Application of
π-acceptors to the spectrophotometric determination of lis-inopril in commercial dosage forms, II Farmaco, 60 (6– 7), 605–611 (2005).
DOI: http://dx.doi.org/10.1016/j.farmac.2005.04.011 [22] A. Raza, M. T. Ansari, Atta-ur-Rehman,
Spectrophoto-metric determination of lisinopril in pure and pharma-ceutical formulations, J. Chin. Chem. Soc.,52 (5), 1055– 1059 (2005). DOI: 10.1002/jccs.200500149
[23] M. C. Jamakhandi, C. Javali, I. J. Disouza, S. U. Chougule, K. A. Mullani, Spectrophotometric determi-nation of lisinopril dosage form by condensation reac-tion, Int. J. Pharm. Sci., 3 (2), 185–187 (2011). [24] D. Özer, H. Senel, Determination of lisinopril from
phar-maceutical preparations by derivative UV spectrometry, J. Pharm. Biomed. Anal.,21 (3), 691–695 (1999).
DOI: http://dx.doi.org/10.1016/S0731-7085(99)00168-5 [25] B. Stanisz, Estimation of the applicability of differential
spectroscopic method for the determination of lisinopril in tablets and for the evaluation of its stability, Acta Pol. Pharm.,61 (5), 327–334 (2004).
[26] M. Remko, Acidity, lipophilicity, solubility, absorption and polar surface area of some ACE inhibitors, Chem. Pap.-Chem. Zvesti, 61 (2), 133–141 (2007).
DOI: http://dx.doi.org/10.2478/s11696-007-0010-y [27] Technical overview, Control pH during Method
Devel-opment for Better Chromatography, Agilent Technolo-gies Inc., USA, 2015.
[28] Y. Kazakevich, R. Lobrutto (Editors), HPLC for Phar-maceutical Scientists, John Wiley & Sons, New Jersey, USA, 2007.
[29] A. Kocijan, R. Grahek, D. Kocijan, L. Kralj-Zupančič, Effect of column temperature on the behaviour of some angiotenzin converting enzyme inhibitors during high-performance liquid chromatographic analysis, J. Chroma-togr. B: Biomed. Sci. Appl., 755 (1–2), 229–235 (2001). DOI: http://dx.doi.org/10.1016/S0378-4347(01)00082-2 [30] S. Bouabdallah, H. Trabelsi, K. Bouzouita, S. Sabbah,
Reversed-phase liquid chromatography of lisinopril con-formers, J. Biochem. Biophys. Methods,54 (1–3), 391– 405 (2002).