Abstract—Peat profile exhibits a unique water table dynamics which impinge fate of elements in the system. This work aimed to study the microstructure and elemental composition of peat profiles using FESEM coupled with EDX techniques. Peat profiles were divided into aerobic peat, anaerobic peat, transitional peat, mineral soils under transitional peat and bottom mineral soils. Results demonstrated darker colour of former layers and brighter gray colour of later layers. Water extracted from peat profiles were rich in N, P, K, Ca and Mg. Microscopic image illustrates different stages of peat disintegration experienced by each layer. The EDX results reveals astounding amount of N, Mg, K, Al and Fe in transitional peat and mineral soils underneath, which was absence in peat layers. From this study, it is believed there was a deposition and movement of elements upward and downward peat profiles, concurrent with the fluctuating water table.
Index Terms—FESEM, profile, peat, microscopy, EDX.
I. INTRODUCTION
Tropical peat soils encompassed of about 8% from total world’s peat soils [1] which primarily found in Indonesia and Malaysia. The existence of topogenous; a freshwater swamp occurs along lowland river and ombrogenous; a peat swamps where water and nutrients were supplied entirely either from rain, aerosols and dust [2], was common in Southeast Asia. Although a study on tropical peat was extensively accomplished in Malaysia, only few studies have endeavoured to discuss the profile of peat soil [3]-[6]. Since these studies focused mainly on peat classification, the microscopic study as well as elemental composition in a complete peat profiles was slightly discussed. A peat profiles exhibit different type of peat materials as a results of peat disintegration on the upper peat layer and contain mineral soils chiefly clay and sand underneath [3], [4]. Despite, decomposition process of surface peat material is highly dependent on type of organic material and aerobic condition [7] created upon drawdown of water table which controlled by amount of precipitation[8] under natural condition. Continuous fluctuating of water table along with different texture and components downward peat profiles is suspected to have an effect on elemental composition. Hence, this work aimed to study the microstructure and elemental composition of peat profiles using Field Emission Scanning Electron Microscopy (FESEM) coupled with Energy Dispersive X-Ray (EDX).
Manuscript received September 29, 2014; revised February 2015, 2015. The authors are with Faculty of Plantation and Agrotechnology, UiTM Shah Alam, 40450, Shah Alam, Selangor, Malaysia (e-mail: [email protected]).
II. MATERIALS AND METHODS
The sampling area was located at natural peat soils in Jalan Johan Setia, Selangor. Water table was at 30 cm from soil surface during sampling. Soil samples were taken up to 300 cm depth and divided accordingly into aerobic peat (30 cm), anaerobic peat (120 cm), transitional peat (50 cm), mineral soils after transitional peat (30 cm) and bottom mineral soils (70 cm). The characteristics of each layer were differentiated according to colors, described using Munsell Color Chart. Degree of peat decomposition examined using hand squeezed method following the Von Post scale to have defined results on peat decomposition stage [9].Water samples were taken from peat as well as mineral soils underneath peat upon sampling. For FESEM study, a small portion of oven-dried samples from both plots were placed onto aluminium stub covered with double-sided carbon tape without coating as there was no surface charging occurred after initial test done. Then, the stubs were placed into Carl Zeiss, Supra 40VP FESEM (Germany) to analyze the surface morphology and microstructure of peat samples. The samples were magnified at 5 different magnification specifically 300x, 500x, 1.00Kx, 5.00Kx and 10.00Kx to obtain defined picture of the peat as well as mineral soils microstructures. After having the desired microstructure, the spectrum and chemical composition was derived using Energy Dispersive X-Ray (EDX).
III. RESULTS
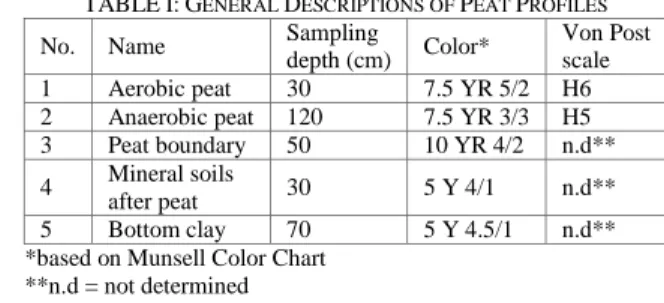
Table I showed the general descriptions of sampled peat profiles whereas Table II demonstrates the properties of water extracted from sampled peat and mineral layers. From Table I, the data demonstrate a general descriptions of peat layers specifically the colors and scale of Von Post, degree of humification.
According to the Munsell colors, it reveals that layers containing peat materials exhibit dark color whereas the underneath mineral soils demonstrate brighter gray color. In aerobic peat, little evidence of indistinct plant materials was observed. Upon squeezing, the liquid appear to be a little muddy, indicating a moderately to well decomposed peat which falls under H6 category. Contrarily, anaerobic peat layer demonstrates a strongly turbid; dark brown liquor with a little peat suspension upon squeezing with palm, enlightened a moderately decomposed peat material that falls under H5 category. Consequently, both of these peat layers were classified to be hemic material. In transitional peat layers, texture of the soil was suggested to be a clayey type, with admixture of peat materials. Occurrence of
Microscopic Study of Peat Profiles Using FESEM
Coupled with EDX Technique
distinct plant structure especially woods and roots was clearly identifiable. Since there was existence of clay texture,
the degree of peat decomposition in this layer was left undetermined.
TABLEI:GENERAL DESCRIPTIONS OF PEAT PROFILES
No. Name Sampling
depth (cm) Color*
Von Post scale 1 Aerobic peat 30 7.5 YR 5/2 H6 2 Anaerobic peat 120 7.5 YR 3/3 H5 3 Peat boundary 50 10 YR 4/2 n.d** 4 Mineral soils
after peat 30 5 Y 4/1 n.d** 5 Bottom clay 70 5 Y 4.5/1 n.d** *based on Munsell Color Chart
**n.d = not determined
TABLEII:PROPERTIES OF WATER FROM SAMPLED PEAT LAYERS AND MINERAL SOILS UNDERNEATH PEAT
Sample N (mg/L) P (mg/L) K (mg/L) Ca (mg/L) Mg (mg/L) pH
Cond (µS/cm) Mineral
soils water
3.80 1.84 12.04 3.17 6.91 4.91 463 Peat
water 3.18 7.73 9.79 3.37 3.19 3.27 247
TABLEIII:ELEMENTAL COMPOSITION OF DIFFERENT LAYERS IN PEAT PROFILE USING EDX APPROACH
Aerobic peat Anaerobic peat Transitional peat Mineral soil after peat Bottom mineral soil Element Weight Atomic Weight Atomic Weight Atomic Weight Atomic Weight Atomic
(%) (%) (%) (%) (%) (%) (%) (%) (%) (%) C 68.97 75.14 69.16 75.44 11.31 17.50 2.65 4.50 5.11 9.25 N 0.00 0.00 0.00 0.00 1.68 2.23 3.72 5.42 1.35 2.10 O 29.56 24.17 29.40 24.08 48.05 55.79 46.60 59.41 40.26 54.74 Mg n.d. n.d. n.d. n.d. 0.87 0.66 0.93 0.78 0.93 0.84 Al 0.21 0.10 0.00 0.00 9.93 6.84 11.28 8.52 9.48 7.65 Si 1.27 0.59 0.00 0.00 21.35 14.12 24.02 17.44 20.15 15.61 P 0.00 0.00 0.00 0.00 0.00 0.00 0.00 0.00 0.00 0.00 S n.d. n.d. n.d. n.d. 1.52 0.88 n.d. n.d. 0.92 0.63 K 0.00 0.00 1.44 0.48 1.56 0.74 3.29 1.72 1.76 0.98 Ca 0.00 0.00 0.00 0.00 0.00 0.00 0.00 0.00 0.00 0.00 Fe 0.00 0.00 0.00 0.00 3.72 1.24 4.03 1.47 5.79 2.26 Mo n.d. n.d. n.d. n.d. n.d. n.d. 3.47 0.74 n.d. n.d. Cr n.d. n.d. n.d. n.d. n.d. n.d. n.d. n.d. 14.24 5.96
Totals 100
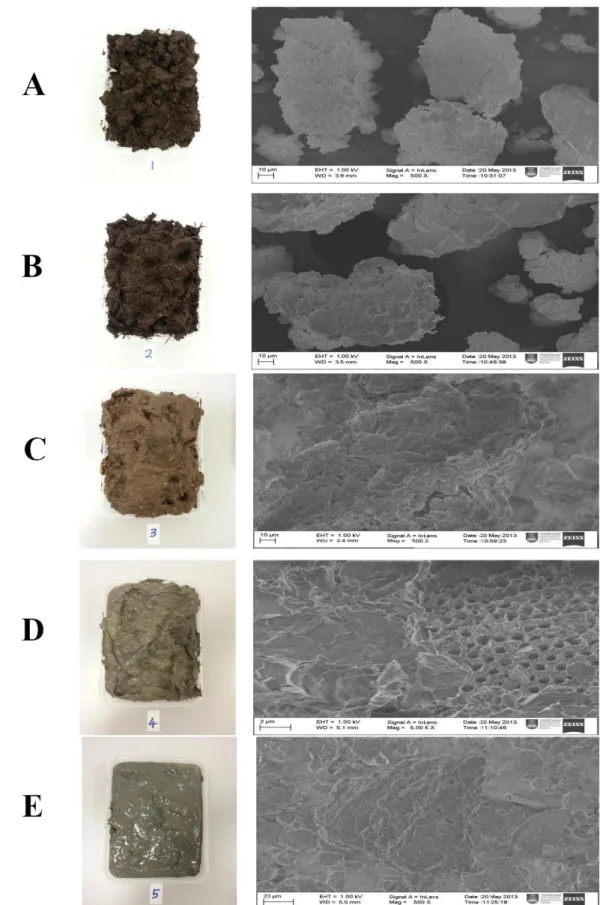
Fig. 1 (Image A-E) illustrates the microscopic image of different layers in sampled peat profiles whereas Table III shows various elemental compositions of different layers in sampled peat profiles detected using EDX approach. Image A showing an evidence of degradable peat materials with some elements detected, namely C, O, Al and Si (Table III). It is suspected Al and Si may have come from either the mineral soils underneath peat layers, following the fluctuating water table or through atmospheric deposition. High amount of carbon also detected in aerobic peat layer, believed to be originated non-decomposed plant material. Image B reveals a microstructure of plant materials (clear but indistinct), which restrain high amount of carbon remained in moderately decomposed plants materials. Presence of K was noticeable in this layer, possibly due to its high mobility in soil solution.
Hence, it is suspected whenever water table fluctuated, K will move accordingly with the water and deposited. Image C illustrates the soil exhibit admixtures of clayey and peaty texture, with insignificant degradation of peat materials. This explained the plant materials were either weakly decomposed or slightly present, supported by low carbon. Numerous elements were concentrated in this layer including N, O, Mg, Al, Si, S, K and Fe. Existence of K and Mg is perhaps due to their high mobility. High amount of Al and Fe is expected under acidic environment, owing to low pH. Absence of N in previous layers was detected in this
layer. Image D and E illustrates the microstructure of mineral soils underneath peat.
As expected, most of elements were found to be deposited in these bottom layers probably because of clayey texture exhibit by both layers. High amount of Al, Fe, Cr and Si was detected along with nutrient elements such as N and K. It is believed P and Ca were fixed with Al and Fe in these layers since much amount of particular elements detected in soil solution, but due to detection limit of EDX, some amount of P and Ca possibly detected using instrument with high detection limit such as Inductive Coupled Plasma (ICP).
IV. DISCUSSION
The sampled peat contains of approximately > 150 cm peat materials in upper layer with poorly drained condition, classified under ombrogambist great group in Malaysian Soil Taxonomy [10]. Initial findings demonstrated darker color of surface layers and shifted into bright, grey color upon reached the mineral soils underneath peat, enlightens presence of organic matter which masked the coloring effects of iron [11] in peat layers.
Occurrence of clay material in transitional peat slightly brightens the soil color despite existence of slight organic material. Beneath transitional peat, brighter grey colors of mineral soil become obvious as under saturated condition, International Journal of Chemical Engineering and Applications, Vol. 8, No. 1, February 2017
iron that coated soil particles was leached and dissolved, leaving the base color (gray) of soil particles [11]. Effects of color changes reveals in Table III, indicating most of peat material merely observable in former peat layer and almost none upon reaching the beneath mineral soils. From this
color observation, it is understood peat layers were rich in organic matter and the amount decrease upon reaching beneath mineral soils, discloses a different stages of peat disintegration.
Fig. 1. Image (A) Aerobic peat, Image (B) Anaerobic peat, Image (C) Transitional peat, Image (D) Mineral soils after peat, Image (E) Bottom mineral soils.
Amount of stored carbon was higher in peat layer, and slightly detected in later layers owed to existence of peat materials, which is a good supply of carbon. Breakdown of
through increase in soil temperature which helps peat degradation [12], higher availability of oxygen which helps in microbial activity [6], and acted as an optimal terminal electron acceptor for decomposition [13], [14]. Contrarily, the later inhibit decomposition process by reducing the available oxygen in peat, thus hindering microbial activity [14].
Different stages of peat decomposition permitted the occurrence of different texture throughout peat profiles, shown in this study. High deposition of elements detected in mineral layers since it is renowned peat texture was porous whereas clayey texture helps in providing exchange sites for elemental fixation, shown by high elemental deposition namely N, K, Mg, Al and Fe. Decrement of Fe as it moves upward peat profiles imply a high stability and mobility of Fe2+ ions under reducing conditions. Fe2+ ions are readily soluble and suggested to be transported upward in appearance of high water table until oxidation condition reached, which turn the ion into immobile Fe3+ [15]. Decomposition of peat materials is expected to release N [16], however, it is surprising that absence of N and other nutrient elements were detected on peat layers. This is probably true for N since mobilization of mineral N is mainly through diffusion[7]. Upon increase of water table to the surface, the element is believed to be utilized into soil solution and there is a possibility of being deposited into peat materials in upper peat profiles.
Despite, lack of cations and anions in surface peat is suggested to be uptake by plants of the sampled area and slow decomposition inhibits the recycled of these elements onto peat soils. The absence of elemental composition in surface peat layers is therefore discovered in soil solution, which enrich in N, P, K, Ca and Mg.
V. CONCLUSION
From this study, it is believed there was a movement of elements upward and downward peat profiles, concurrently with the fluctuating water table. The creation of aerobic and anaerobic condition, joined with different texture and components of the profiles exhibit different dynamics of elements composition as well as peat decomposition.
ACKNOWLEDGMENT
The authors wish to thank Hj. Sharifhuddin Idris, the owner of small-scale pineapple farm under study. This research was supported by Excellent Fund Grant 600-RMI/ST/DANA 5 5/3/Dst (466/2011).
REFERENCES
[1] P. Maltby and E. Immirzi, “Carbon dynamics in peatlands and other wetlands – regional and global perspective,” Chemosphere, vol. 27, pp. 147–154, 1993.
[2] M. Dominik, W. William, S. Jack, R., Susan, P. Marlies, G. Steve, and R. Antonio, “The geochemistry of major and selected trace elements in a forested peat bog, Kalimantan, SE Asia, and its
implications for past atmospheric dust deposition,” Geochimica et
Cosmochimica Acta, vol. 66, no. 13, pp. 2307–2323, 2002.
[3] V. Ramesh, S. Paramananthan, and V. R Eric, “Classification of tropical lowland peats revisited: The case of Sarawak,” Catena, vol. 118, pp. 179–185, 2014.
[4] S. Paramananthan, Malaysian Soil Taxonomy-A unified Malaysian
Soil Classification System, 2000.
[5] J. Yonebayashi, K. Okazaki, and M. Pechayapisit, “No Title,” in
Coastal Lowland Ecosystem in Southern Thailand and Malaysia.
Showado-Printing, Sakyoku, Kyoyo, K. Kyuma, P. Vijarnson, and A.
Zakaria, Eds, 1992, pp. 233–247.
[6] J. P. Andriesse, “Nature and management of tropical peats,” FAO
Soils Bulletin, FAO, Rome, 1988, p. 165.
[7] J. J. M. Geurts, A. J. P. Smolders, A. M. Banach, J. P. M. van de Graaf, J. G. M. Roelofs, and L. P. M. Lamers, “The interaction between decomposition, net N and P mineralization and their mobilization to the surface water in fens,” Water Reasearch, vol. 44, pp. 3487–3495, 2010.
[8] S. E. Page, J. O. Rieley, W. Shotyk, and D. Weiss, “Interdependence of peat and vegetation in a tropical swamp forest,” Philos. Trans. R.
Soc. London, vol. 354, pp. 1885–1897, 1999.
[9] Soil Survey Staff, "US Soil Taxonomy. Keys to soil taxonomy. Soil Management Support Services Technical Monograph no. 19," Virginia Polytechnic Institute and State University, Blacksburg, VA. 1990.
[10] S. Paramananthan, Malaysian Soil Taxonomy-Revised, 2nd edition,
Param Agricultural Surveys (M) Sdn. Bhd., 2010.
[11] Interpreting your soil evaluation for septic system suitability. (2014). [Online]. Available: http://www.illinoissoils.org
[12] J. E. Hilasvuori, A. Akujärvi, H. Fritze, K. Karhu, R. Laiho, P. Mäkiranta, M. Oinonen, V. Palonen, P. Vanhala, and Liski, “Temperature sensitivity of decomposition in a peat profile,” Soil
Biology and Biochemistry, vol. 67, pp. 47–54, 2013.
[13] H. Freeman, C. Ostle, N. J. Fenner, and N. Kang, “A regulatory role for phenol oxidase during decomposition in peatlands,” Soil Biology
and Biochemistry, vol. 36, no. 10, pp. 1663–1667, 2004.
[14] R. Laiho, “Decomposition in peatlands: Reconciling seemingly contrasting results on the impacts of lowered water levels,” Soil
Biology and Biochemistry, vol. 38, no. 8, pp. 2011–2024, 2006.
[15] E. Teirumnieka, E. Kļaviņš, and M. Teirumnieks, "Major and trace
elements in peat from bogs of East Latvia," Mires and Peat, pp. 978–
984, 2010.
[16] G. P. McLatchey and K. R. Reddy, “Regulation of organic matter decomposition and nutrient release in a wetland soil,” Journal of
Environmental Quality, vol. 27, no. 5, pp. 1268–1274, 1998.
Nur Qursyna bt Boll Kassim was born in Sarawak, Malaysia on December 2, 1986. She graduated the first bachelor degree (honours) in plantation industry and management in 2009 and master degree in plantation industry and management in 2010 at Universiti Teknologi MARA (UiTM) Shah Alam, Malaysia. She is currently pursuing her doctor of philosophy (PhD) in soil science, major in peat soils.
Adzmi bin Yaacob was born on March 9, 1958. In 1990 he studied at the University of Kent, UK for his MSc. Conservation of soil fertility. In 2001, he went to the University of Wales Aberystwyth, UK for the D. Phil degree on soil physic-chemical assessment during forest conversion to tree plantation.
Currently, he is the dean at the Faculty of Plantation and Agrotechnology, UiTM, Shah Alam Malaysia.
His research interests include peat soil management, soil suitability assessment for plantation crops and heavy metals in agricultural soils.
International Journal of Chemical Engineering and Applications, Vol. 8, No. 1, February 2017