P
P
P R E S S The•P O L I C YKept out or opted out?
Understanding and combating financial exclusion
First published in Great Britain in 1999 by The Policy Press
34 Tyndall’s Park Road Bristol BS8 1PY UK
Tel no +44 (0)117 954 6800 Fax no +44 (0)117 973 7308
E-mail [email protected]
http://www.bristol.ac.uk/Publications/TPP © The Policy Press 1999
In association with the Joseph Rowntree Foundation ISBN 1 86134 159 8
Elaine K Elaine KElaine K Elaine K
Elaine Kempsonempsonempson is Director and Clairempsonempson ClairClairClaire Claire e Whe e WhWhWhWhyleyleyleyleyleyyyyy is a Research Fellow at the Personal Finance Research Centre, University of Bristol. All rights reserved: no part of this publication may be reproduced, stored in a retrieval system, or transmitted in any form or by any means, electronic, mechanical, photocopying, recording or otherwise without the prior written permission of the Publishers. The JJJJJoseph Rooseph Rooseph Rooseph Rooseph Rowntrwntrwntree Fwntrwntree Fee Fee Fee Foundation oundation oundation oundation has supported this project as part of its programme of research and innovative developmentoundation projects, which it hopes will be of value to policy makers and practitioners. The facts presented and views expressed in this report are, however, those of the authors and not necessarily those of the Foundation.
The statements and opinions contained within this publication are solely those of the authors and contributors and not of The University of Bristol or The Policy Press. The University of Bristol and The Policy Press disclaim responsibility for any injury to persons or property resulting from any material published in this publication.
The Policy Press works to counter discrimination on grounds of gender, race, disability, age and sexuality. Cover design by Qube Design Associates, Bristol.
Photograph used on front cover supplied by kind permission of www.johnbirdsall.co.uk Printed in Great Britain by Hobbs the Printers Ltd, Southampton
Acknowledgements iv
1 Introduction 1
Previous research 1
Research aims and methods 2
This report 2
2 The extent of financial exclusion 4
Who are the financially excluded? 4
What determines the likelihood of financial exclusion? 7
Predicting the likelihood of financial exclusion 10
Access to financial products: a hierarchy 12
3 The processes of financial exclusion 14
Households that have never used financial services 14
Disengagement from financial services 17
Individuals within households 19
Engagement and re-engagement with financial services 20
4 Unmet needs and the consequences of financial exclusion 22
Day-to-day money management 22
Longer-term financial security 26
Medium-term financial security 27
Purchasing consumer goods 28
5 Meeting the needs of financially excluded households 30
Providers of financial services 30
Appropriate product design and delivery 31
How well do existing products match up to these criteria? 33
6 Summary and policy implications 40
The processes of exclusion 40
Unmet needs and the consequences of financial exclusion 41
Meeting the needs 42
The policy implications 44
Moving forward 47
References 49
Appendix A: Regression models 51
Appendix B: Research methods 54
Contents
••••••••••••••••••••••••••••••••••••••••••••••••••••••••••••••••••••••••••••••••••••••••••••••••••••••••••••••••••••••••••••••••••••••••••••••••••••••••••••••••••••••••••••••••••••••••••••••••
••••••••••••••••••••••••••••••••••••••••••••••••••••••••••••••••••••••••••••••••••••••••••••••••••••••••••••••••••••••••••••••••••••••••••••••••••••••••••••••••••••••••••••••••••••••••••••••••
••••••••••••••••••••••••••••••••••••••••••••••••••••••••••••••••••••••••••••••••••••••••••••••••••••••••••••••••••••••••••••••••••••••••••••••••••••••••••••••••••••••••••••••••••••••••••••••••
••••••••••••••••••••••••••••••••••••••••••••••••••••••••••••••••••••••••••••••••••••••••••••••••••••••••••••••••••••••••••••••••••••••••••••••••••••••••••••••••••••••••••••••••••••••••••••••••
••••••••••••••••••••••••••••••••••••••••••••••••••••••••••••••••••••••••••••••••••••••••••••••••••••••••••••••••••••••••••••••••••••••••••••••••••••••••••••••••••••••••••••••••••••••••••••••••
••••••••••••••••••••••••••••••••••••••••••••••••••••••••••••••••••••••••••••••••••••••••••••••••••••••••••••••••••••••••••••••••••••••••••••••••••••••••••••••••••••••••••••••••••••••••••••••••
This research could not have been completed without the help and support of a great many people and we would like to thank them for their hard work.
At the Personal Finance Research Centre (PFRC), University of Bristol, we would like to thank Sharon Collard for her invaluable contribution to the project and, in particular, the final report. Also, Professor Nigel Thrift and Dr Andrew Leyshon for reading and commenting on working papers. Our Advisory Group offered invaluable advice throughout the study. The group comprised:
Tony Baker, Deputy Director General Association of British Insurers
Kelvin Baynton, Formerly, Head of Consumer Affairs, Personal Investment Authority
Adrian Coles, Director General Building Societies Association
Acknowledgements
Amanda Jordan
Social Exclusion Unit
Susan Rice, Head of Branch Banking Bank of Scotland
Tim Roberson, Consumer Economist Office of Fair Trading
Theresa Williams, Principal Research Officer Department of Social Security
We thank the Office of Fair Trading for allowing us access to their dataset on vulnerable
consumers and Plus Four Research Ltd for undertaking the recruitment for the focus groups. We are also greatly indebted to the individuals who participated in the focus groups and who agreed to be interviewed in depth. Finally, we are grateful to the Joseph Rowntree Foundation for providing financial support for the study and, in particular, to Derek Williams for his commitment and enthusiasm throughout the project.
1
During the 1980s, retail financial markets expanded and more people gained access to a wider range of financial products than ever before. In the mid-1970s, less than half of all households had a current account – it is now about eight out of ten and many of these have facilities with their account that were not available 20 years ago (Kempson, 1994). Likewise, about a quarter of households in the early 1970s had credit facilities – a figure that had grown to seven out of ten in the space of two decades (Berthoud and Kempson, 1992). Moreover, forms of credit that were in their infancy in the early 1970s are now fairly commonplace. Two key factors influenced these developments: deregulation of the financial services sector, leading to greater competition, and developments in the use of information technology for risk assessment, which allow companies to accept a more diverse customer base than used to be the case. Overall, these developments have benefited the majority of consumers, who now enjoy access to a wider range of financial products than in the past. But a minority of households lack even the most basic of financial product, such as a current account or home contents insurance. There is also mounting concern that these households are the most disadvantaged in society and that limited participation in financial services is contributing to the more general problem of social exclusion.
Despite this political and academic interest, we do not know how many people are affected, we are unaware of the problems they face in a society where there is widespread use of financial services, and we do not have an
Introduction
Previous research
Previous research has found that large numbers of households lack basic financial products. Two out of ten households do not have a current bank or building society account (Kempson, 1994; Kempson and Whyley, 1998); a similar proportion do not have home contents insurance (Whyley et al, 1998). Around three out of ten have no savings at all (Kempson, 1998) and about the same number have not had access to consumer credit facilities in the previous year (Berthoud and Kempson, 1992). While we do not know the extent to which these are the same people, this earlier research does suggest a fair degree of overlap.
Existing research also demonstrates that financial exclusion is neither a single nor a straightforward process. Certainly it is not simply a matter of people being refused access outright. In fact, there seems to be a high degree of turnover. For example, about a third of the households lacking a current account had had one in the past, but had closed it down (Kempson and Whyley, 1998). Similarly, half of households who had no home contents
insurance had been insured in the past but had let their policy lapse (Whyley et al, 1998). As a group, households who had given up a current account or home contents insurance differed quite markedly from those who had never had them.
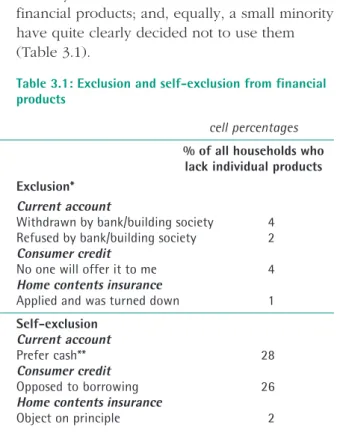
A key question is whether the people who lack financial products are excluded from access or whether they self-exclude. Previous research suggests that, at the extremes, the answer is straightforward: a small minority are denied
down. Equally a small minority do not want specific products under any circumstances (Kempson, 1994; Kempson and Whyley, 1998; Whyley et al, 1998).
Between these extremes, there is a grey area where people face barriers that encourage self-exclusion. Some people are deterred by price considerations, whether this be an unaffordable insurance premium, the high cost of credit sources available to people on low incomes or the risk of incurring charges by inadvertently overdrawing a current account. Others are deterred by the conditions attached to financial products, including people who are offered insurance policies with high excesses or containing exclusions that severely limit the policy’s usefulness, and people who can only gain access to a current account with very limited facilities. Finally, there are people to whom none of the financial services are marketed and who have very little knowledge of financial products or how to go about getting them (Kempson, 1994; Kempson and Whyley, 1998; Whyley et al, 1998; Kempson, 1998).
Research aims and methods
The current research builds upon this earlier work to provide a detailed understanding of the extent and nature of financial exclusion, to identify unmet needs for financial products and how these needs can best be met. Within this, it has been designed to provide answers to the following more specific questions:
• How many households have restricted access to a wide range of financial products?
• What are the characteristics and circumstances of these households?
• In what ways are they excluded from financial services and how does this contribute to social exclusion more generally?
• What are their unmet needs for financial services?
• How might their needs be met and the trend towards financial exclusion be reversed?
The study involved three distinct but linked stages: secondary analysis of the Family Resources Survey to identify how many
households are affected and who they are; re-analysis of in-depth interviews with 87
households that had very limited use of financial products, to provide a detailed understanding of the processes of financial exclusion; and five focus groups to explore the extent and nature of unmet need for financial services. In addition, the Office of Fair Trading kindly gave us access to the statistical data they had collected through two modules of questions placed on the Office of National Statistics Omnibus Survey. Full details of the methods are given in Appendix B.
This report
Chapter 2 covers the extent of financial exclusion and the characteristics of both households who are completely outside financial services provision, as well as those on the margins of exclusion. It also examines the likelihood of households in different
circumstances using financial products and identifies a hierarchy of access to individual financial products.
Following this, Chapter 3 looks in detail at the processes leading to financial exclusion, beginning with households who have
disengaged and then turning to those who have never used any financial products.
Chapter 4 discusses the main unmet needs for financial services among those with low levels of use and the consequences of not having access to mainstream financial services. Chapter 5 focuses on ways of meeting these needs, separating out product design and the delivery of financial products.
Finally, Chapter 6 brings together the main findings of the research, draws out the
implications for policy makers and practitioners, and identifies the scope for combating financial exclusion.
The term ‘financial exclusion’ is used in the report as it is widely accepted in the language of current debates on the broader processes of social exclusion, and we wanted to maintain the continuity of those debates. As a consequence, we use it as a generic term to describe all those who lack any financial products, regardless of the reason. In doing so, we are not suggesting that all these households experience direct
exclusion because the financial services industry refuses to provide them with financial products. Rather, we recognise that they comprise a variety of characteristics, experiences and circumstances which cannot easily be summarised in the use of a single term. This includes people who are refused all products, those who decide freely not to use them, and those who self-exclude because of the inappropriateness of current products to households in their financial circumstances.
In addition to this report, three working papers have been produced which give, in greater detail, the results of the Family Resources Survey
secondary analysis (Kempson and Whyley, 1999a); the depth interviews reanalysis (Kempson and Whyley, 1999b); and the focus groups (Whyley and Kempson, 1999).
The extent of financial exclusion
2
Around 1.5 million households in Britain (7%) have no mainstream financial products at all1.
This means that they manage their household finances without a bank or building society account, have no money saved or invested, no private pension, no mortgage and are without any type of insurance. Moreover, a further one in five make only very limited use of financial services: one in 10 have just one financial product and a further one in 10 have two products. Most commonly, they have either a current account or a savings account with a bank or building society.
The situation does, however, vary across the country. Levels of non-use are highest in Scotland, where 13%of households have no financial products – twice the national average – and a further 25%have only one or two. Other localities with higher than average levels of non-use include the North and North West of England and Greater London. At the opposite end of the spectrum, the South East and East Anglia have far fewer households lacking access to financial services – in the South East, for example, only 3% of households have no financial products at all and a further 14%have just one or two.
Moreover, financial exclusion is concentrated among certain types of households in particular types of neighbourhood. And, at the same time, there are clear indications of the types of household most susceptible to being without financial products.
Who are the financially excluded?
The great majority (74%) of households without financial products are headed by a single person rather than a couple – including single people who live alone, both above and below pensionable age, and lone parents. Further, they are concentrated in social rented housing (84%) and, in England and Wales, almost half (47%) live in one of the 50 most deprived districts and boroughs according to the
Department of the Environment, Transport and the Region’s (DETR) index. It is, however, important to note that even areas with low overall rates of exclusion may have pockets of much higher levels concentrated within them (Table 2.1). Finally, households lacking financial products are poor. They are virtually all (94%) headed by someone who is not in paid work and, in two thirds of cases, the head of household has been without employment for six years or more. Consequently, seven in 10 are in receipt of Income Support and two thirds have net weekly incomes between £50 and £150 (Table 2.2).
Table 2.1: The characteristics of households with no financial products
column percentages
No financial products All households Age of household head
16-19 2 *
20-29 20 12
30-39 19 20
40-49 10 18
50-59 11 15
60-69 13 14
70-79 15 13
80+ 10 7
Household type
Single no children 22 14
Couple no children 5 17
Three + adults no children 1 7
Single pensioner 28 16
Couple pensioners 7 14
Lone parent 24 7
Couple with children 11 22
Three + adults with children 2 3
Ethnicity
White 92 96
Black 4 2
Indian * 1
Pakistani/Bangladeshi 2 *
Other 1 1
Age completed education (household head)
16 or under 93 73
17-19 6 16
20 or over 1 11
Housing tenure
Owned outright 3 26
Mortgagor 0 40
Local authority tenant 70 20
Housing association 14 5
Private tenant 13 9
Standard region
North (including Cumbria) 8 6
Yorkshire and Humberside 8 9
North West 15 11
East Midlands 5 7
West Midlands 8 9
East Anglia 3 4
Greater London 15 11
South East (excluding London) 8 19
South West 5 9
Wales 7 6
Scotland 18 9
Local levels of deprivation**
1 (Most deprived) 46 25
2 22 17
3 9 11
4 8 11
5 6 11
6 4 9
7 (Least deprived) 5 16
Weighted base 1,751 26,435
Source: Family Resources Survey 1995/96
Kept out or opted out?
Table 2.2: Socioeconomic circumstances of households with no financial products
column percentages
No financial products All households Net weekly household income
No income * 1
£1-£50 1 1
£51-£100 26 11
£101-£150 41 17
£151-£200 20 14
£201-£300 11 20
£301-£400 1 14
£400-£500 * 9
more than £500 * 12
Net equivalent weekly household income
No income * 1
£1-£50 * 1
£51-£100 4 3
£101-£150 36 16
£151-£200 41 21
£201-£300 16 26
£301-£400 3 15
£400-£500 * 8
more than £500 * 9
Receipt of income-related benefit
None 5 69
Council Tax Benefit only 2 5
Income Support only 1 2
Council Tax Benefit and Income Support 2 4
Housing Benefit only 3 2
Housing Benefit and Council Tax Benefit 17 5
Housing Benefit and Income Support 7 1
Housing Benefit, Council Tax Benefit and Income Support 63 12
Economic activity status (head of household)
Self-employed * 9
Full-time employment 4 42
Part-time employment 2 2
Unemployed 17 6
Retired 35 27
Sick/disabled 17 6
Student 1 1
Other inactive 24 7
Number of years since last worked (head of household)
0 7 54
1 4 3
2 5 3
3 6 3
4 6 3
5 5 3
6-10 20 10
11-16 28 14
21 or more 19 7
Weighted base 1,751 26,435
Source: Family Resources Survey 1995/96
The extent of financial exclusion
What determines the likelihood of
financial exclusion?
A review of the characteristics of households that are without financial products illustrates the nature of this population, and the types of households which are prominent in it. Another way of looking at this information, however, is to assess the likelihood of different types of households lacking financial products. This adds a further dimension to our understanding, by demonstrating which particular characteristics render people more or less likely to be outside the formal financial services system.
As Tables 2.3 and 2.4 show, certain groups have a high likelihood of having no, or very few, financial products. These include very young householders who are aged under 20 – many of whom will not yet have acquired many, if any, financial products – and at the other extreme, householders aged over 80, who would have moved into retirement by the time there was a rapid expansion of financial services.
In general, the younger a householder was when they left full-time education, the lower their likelihood of having financial products, although people who left school when they were 16 or younger did not, on the whole, have especially low levels of use. This, together with the findings in relation to income reported below, suggests that lack of education does not lead directly to low levels of use of financial products; it does so by increasing the likelihood of a low income.
Lone-parent households are highly likely to be very low users of financial products – with almost a quarter having none at all and another
four out of 10 having just one or two products. The only other types of household with similarly low levels of usage are those headed by single pensioners. In other words, there is a greater likelihood of a female-headed household being excluded than one which is headed by a man. There are also very clear ethnic differences. Usage of financial products is lowest in households classifying themselves as African-Caribbean or Black, Pakistani or Bangladeshi. Interestingly, however, Indian households are, if anything, even more likely to have financial products than white households.
We have already seen that the great majority of people without financial products live in the social rented sector, so it is not surprising to find that the likelihood of having financial products is especially low among both council and housing association tenants. In both cases around two out of 10 have no products at all, and half have very low levels of use.
As already noted, there are some very interesting geographical differences in the likelihood of households having financial products. In general, engagement with financial services markets is lowest in Scotland, followed by the North, Greater London and the North West, while it is highest in the South East. And, as might be expected, the likelihood of having financial products is linked to the overall level of deprivation within a local authority.
Households living in the 50 local authorities in England and Wales with the highest levels of deprivation are more than six times as likely to have no financial products as those living in the 65 authorities with the least deprived
Kept out or opted out?
Table 2.3: Number of financial products by household circumstances
row percentages
Number of financial products** Weighted base None Low Med low Ave Med high High
All households 7 19 20 11 21 22 26,435
Age of household head
16-19 26 57 13 2 2 * 112
20-29 11 27 18 11 19 15 3,211
30-39 6 16 15 11 26 26 5,272
40-49 4 11 15 11 25 34 4,738
50-59 5 13 17 11 23 32 3,982
60-69 6 18 24 13 19 19 3,813
70-79 7 27 29 13 15 9 3,522
80+ 10 39 27 8 10 6 1,785
Household type
Single no children 11 25 20 11 19 14 3,581
Couple no children 2 10 15 12 28 33 4,515
Three+ adults no children 1 10 18 12 26 32 1,911
Single pensioner 12 37 28 9 9 5 4,132
Couple pensioners 3 16 27 15 21 18 3,783
Lone parent 23 42 17 7 7 4 1,790
Couple with children 3 11 14 10 27 35 5,861
Three+ adults with children 3 11 20 12 24 30 862
Ethnicity
White 6 19 20 11 21 23 25,215
Black 16 37 22 8 10 7 440
Indian 3 17 26 16 18 19 282
Pakistani/Bangladeshi 14 42 29 7 6 2 211
Other 7 29 21 8 21 14 287
Age completed education (head of household)
16 or under 8 23 22 11 19 16 19,151
17-19 2 11 15 11 26 35 4,084
20 or over 1 7 12 10 25 45 2,939
Housing tenure
Owned outright 1 11 29 15 24 20 6,818
Mortgagor * 1 12 14 33 40 10,605
Local authority tenant 23 51 19 4 2 1 5,348
Housing association 20 50 23 4 2 1 1,190
Private tenant 9 39 28 9 10 5 2,474
Standard region
North (including Cumbria) 9 25 22 13 19 13 1,619
Yorkshire and Humberside 6 21 22 11 20 20 2,305
North West 9 21 20 11 20 19 2,921
East Midlands 5 19 19 12 22 23 1,926
West Midlands 6 20 20 11 21 22 2,407
East Anglia 4 17 19 12 25 23 1,067
Greater London 9 23 20 10 19 19 2,961
South East (excluding London) 3 14 17 11 24 32 5,119
South West 4 17 19 11 22 27 2,297
Wales 8 23 25 12 18 14 1,455
Scotland 13 25 19 10 19 15 2,358
Local levels of deprivation ***
1 (Most deprived) 11 27 20 11 16 15 5,699
2 7 22 23 11 21 16 3,931
3 5 19 21 13 24 19 2,406
4 4 15 20 13 23 25 2,440
5 4 13 18 11 23 31 2,416
6 2 13 16 11 24 34 2,157
7 (Least deprived) 2 12 17 11 24 34 3,573
Source: Family Resources Survey 1995/96
*Less than 1%. ** ‘Low’ =1 or 2 products; ‘Medium-low’ =3 or 4 products; ‘Average’ =5 products; ‘Medium-high’ =6 or 7 products; ‘High’ =8 or more products. ***Analysis based on the DETR Deprivation Index and restricted to England and Wales. Base: all households 22,622.
The extent of financial exclusion
Table 2.4: Number of financial products by socioeconomic circumstances
row percentages
Number of financial products** Weighted base None Low Med low Ave Med high High
All households 7 19 20 11 21 22 26,435
Net weekly household income
No income 2 18 17 13 22 27 179
£1-£50 6 26 28 13 18 9 321
£51-£100 16 39 29 6 8 3 2,785
£101-£150 15 37 26 10 9 4 4,490
£151-£200 9 29 25 13 17 8 3,665
£201-£300 4 15 22 16 26 18 5,279
£301-£400 * 6 16 12 34 32 3,631
£400-£500 * 3 8 10 31 48 2,276
more than £500 * 1 6 7 26 60 3,193
Net equivalent weekly household income
No income 2 18 17 13 22 27 179
£1-£50 4 19 24 16 23 14 213
£51-£100 8 28 32 9 16 7 791
£101-£150 15 35 29 9 9 4 4,058
£151-£200 13 34 23 10 13 6 5,282
£201-£300 4 17 22 14 25 19 6,769
£301-£400 1 7 14 12 32 35 3,976
£400-£500 * 3 10 11 30 47 2,127
more than £500 * 2 6 8 25 59 2,433
Receipt of income-related benefit
None * 8 20 14 28 31 18,289
Council Tax Benefit only 2 24 39 13 15 6 1,229
Income Support only 4 18 27 13 21 18 589
Council Tax Benefit and Income Support 3 32 40 13 9 3 974
Housing Benefit only 13 62 21 2 2 * 484
Housing Benefit and Council Tax Benefit 21 58 17 3 1 * 1,403
Housing Benefit and Income Support 36 49 9 2 3 2 365
Housing Benefit, Council Tax Benefit 35 55 9 * * * 3,102
and Income Support
Economic activity status (head of household)
Self-employed * 6 16 12 29 37 2,386
Full-time employment * 9 16 12 29 34 10,981
Part-time employment 6 29 22 12 17 15 442
Unemployed 19 38 20 8 9 7 1,565
Retired 8 29 28 11 14 9 7,262
Sick/disabled 19 32 22 10 11 7 1,573
Student 8 40 28 8 10 6 274
Other inactive 22 32 14 6 12 14 1,951
Number of years since last worked (head of household)
0 * 9 16 12 29 34 13,809
1 8 31 22 12 15 13 832
2 10 29 23 11 15 13 810
3 13 25 22 11 13 16 739
4 13 29 22 10 14 11 782
5 10 31 23 10 14 11 714
6-10 13 27 25 11 14 11 2,455
11-16 12 32 27 10 12 7 3,620
21 or more 16 39 25 8 9 4 1,906
Source: Family Resources Survey 1995/96
*Less than 1%. ** ‘Low’ =1 or 2 products; ‘Medium-low’ =3 or 4 products; ‘Average’ =5 products; ‘Medium-high’ =6 or 7 products.
Kept out or opted out?
The likelihood of having financial products is lowest in households with net incomes of between £50 and £150 a week – well over half of households with incomes at this level have, at most, two financial products. Moreover, the likelihood of a household having financial products falls steeply with income, so that only 2%of the highest income households have such low levels of use. There is a strong link between being out of work and having no or very few financial products, especially among households that are headed by someone who is unemployed, sick or disabled, or looking after the home or family on a full-time basis. Retired people and students are rather less affected. What is more, the analysis suggests that people close down financial products during the first year or so that they are out of work. The proportion of people who have either no products at all, or only very low levels of use, barely increases with the length of time the household head has been out of work. This is consistent with findings from the second, qualitative stage of this research, detailed in Chapter 3.
Out of work tenants, claiming Housing Benefit and Income Support, have incredibly high levels of financial exclusion – more than a third have no products at all and half have very low levels of use. Low-income tenants not in receipt of Income Support, but getting other income-related benefits, fare only slightly better.
Predicting the likelihood of financial
exclusion
So, we know that the likelihood of experiencing financial exclusion depends on household characteristics, housing and area effects, and socioeconomic circumstances. But many of the individual characteristics which affect the likelihood of a household being without financial products are interrelated. For example, a high proportion of council tenants are without paid employment; lone parents are especially likely to claim income-related benefits; and Pakistani and Bangladeshi households tend to have incomes that are well below average. From the analysis so far, we do not know the relative importance of each of the factors that influence the likelihood of a
household being without financial products.
Nor do we know whether individual factors have a direct influence over the likelihood of a household being without, or whether they are simply a reflection of the indirect impact of other significant factors.
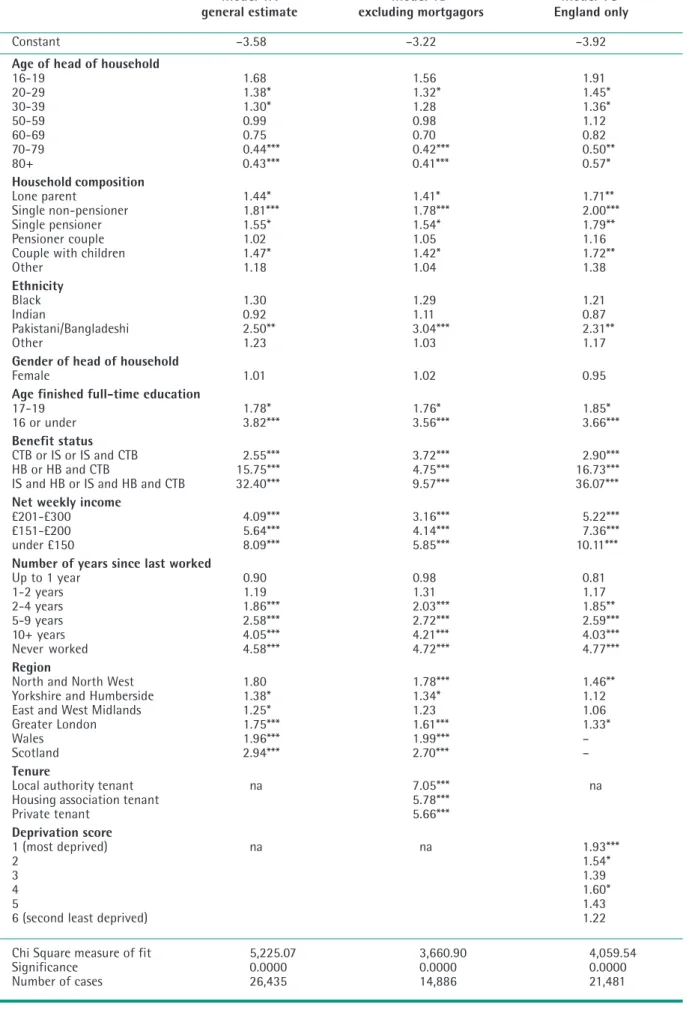
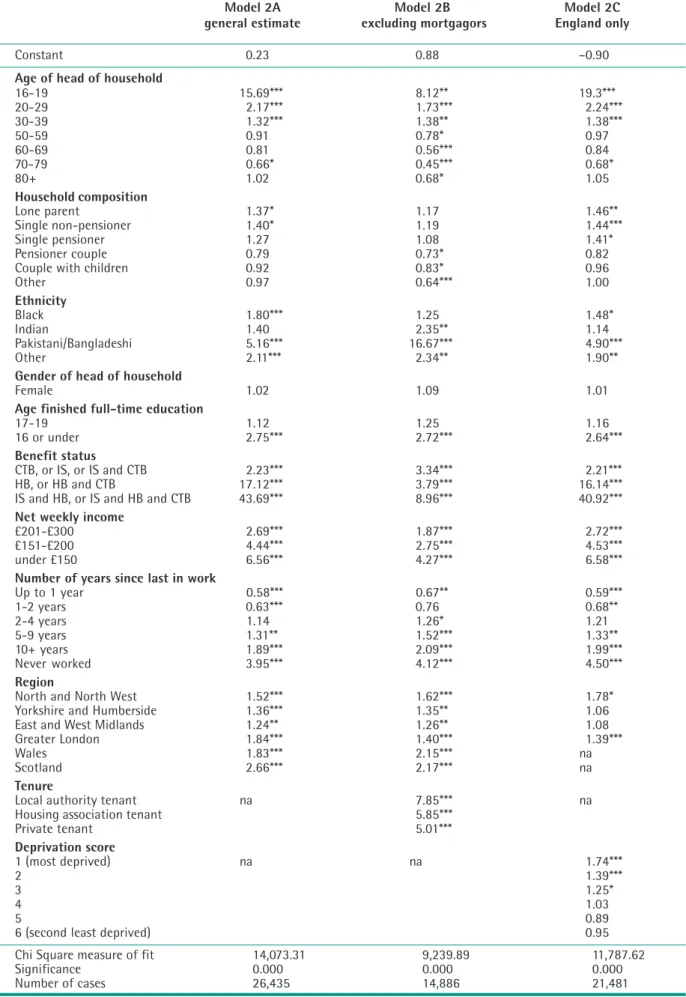
It is possible, however, to disentangle these effects by using the techniques of statistical modelling. Using logistic regression analysis we have determined the additional net effect of each significant individual characteristic, once we have held constant the influence of other related factors. In other words, by modelling, statistically, the effects of each of the significant variables on the likelihood of a household having no financial products, we could assess the extent to which these variables affect the ‘odds’ of financial exclusion (see Appendix A). We ran two sets of models to predict the likelihood of financial exclusion. The first set predict the likelihood of a household being completely without financial products. We then replicated these models according to a broader definition of financial exclusion, which we describe as ‘low levels of use’, and which includes households with only one or two financial products as well as those who do not have any at all. While, broadly speaking, the same factors remain significant in explaining variations in a household’s likelihood of
financial exclusion according to both definitions, the extent and pattern of their influence
changes in interesting ways.
Household economic circumstances
The key factors in predicting the likelihood of financial exclusion, on both definitions, related to household economic circumstances.
By far the most influential factor in predicting the likelihood of both non- and low-use of financial products was benefit status and, in particular, being an out-of-work tenant receiving Income Support, Housing Benefit and Council Tax Benefit (Appendix A, Table 1, Model 1A and Table 2, Model 2A). In comparison with a household not receiving any means-tested benefits, being in receipt of these three benefits increased the odds of having no financial products by 30 times, and of being a low user by a factor of 40. Even low-income tenants who were not on Income Support had a much greater likelihood of financial exclusion,
according to either definition, relative to households who did not receive means-tested benefits.
Although the size of these effects was reduced when housing tenure was introduced into the models, its predictive power remained highly significant (Appendix A, Table 1, Model 1B and Table 2, Model 2B). In other words, receipt of means-tested benefits increases the odds of a household experiencing financial exclusion even when all its other characteristics and circumstances are taken into account.
Income level was also significant in increasing the odds of exclusion, although its effect was strongest in predicting the likelihood of being without financial products altogether. The chances of being a non-user of financial products increases steeply as income falls, so that households with net incomes below £150 a week were eight times as likely to fall into this category as those getting more than £300 a week (Appendix A, Table 1, Model 1A). Income was less influential in predicting the likelihood of a household being a low-user, but remained highly significant (Table 2, Model 2A). Once again, the introduction of tenure into the model reduced the effect of income slightly, but it remained highly significant. The fact that both income and benefit status were so highly significant is especially striking. Clearly, receiving means-tested benefits reduces the likelihood of using financial products by even more than income level alone would predict. The chances of being without any financial products increased with the length of time since the household head had last worked (Appendix A, Table 1). However, the odds of having fewer than two financial products was significantly
reduced in households where the head had been without paid work for less than two years (Appendix A, Table 2). Taken together, this supports the hypothesis that when people move out of paid employment they retain financial products in the short term, although they may suspend use of them, but stop using them altogether the longer they are out of work. This process is, in fact, confirmed by qualitative analysis presented in Chapter 3.
Household characteristics
Some household characteristics are also significant in predicting the odds of financial exclusion, although their influence varies according to the definition used. Those
predicting the likelihood of non-use of financial products include being a single non-pensioner household; having finished full-time education at age 16 or earlier; and being Pakistani or Bangladeshi (Appendix A, Table 2). Possible explanations are, in turn, that single-person households are newly formed and have yet to acquire any financial products; that people with low levels of education find financial products bewildering or off-putting; and that differences in language, religion or culture act as a barrier to Pakistani and Bangladeshi households using financial services.
The picture is very different, however, when we look at low-users, as well as non-users, of financial products (Appendix A, Table 2). Household composition (and in particular being a single non-pensioner) is barely significant in explaining low levels of use, nor is it
particularly influential.
The age of the head of household has a much greater influence over the odds of a household making low use of financial products than it does on having none at all. Having very few products is clearly a particular issue for younger households. Those headed by someone aged under 20, for example, have almost 16 times the odds of having fewer than two financial
products than a household headed by someone aged 40-49 (Appendix A, Table 2, Model 2A). Although this age effect reduces when tenure is added to the model, the under 20s remain more than eight times more likely to be low-users of financial products than older households (Appendix A, Table 2, Model 2B). These findings clearly support the hypothesis that many young people have simply not yet
engaged with the financial services industry. However, despite the fact that very elderly householders – in their 70s and 80s – have a low likelihood of using financial services (Table 2.3), statistical modelling shows that being aged over 70 decreases the odds, especially of having no products at all (Appendix A, Table 1). In other words, it is most likely economic factors
that explain the very low use of financial services among some very elderly people. Ethnicity, too, has a far greater influence over the likelihood of a household having fewer than two financial products, than on having none at all. Pakistani and Bangladeshi households were the only minority ethnic group which had significantly higher odds of being completely without financial products (Appendix A, Table 1). Yet all minority ethnic groups, with the exception of Indians, had significantly higher odds of having fewer than two financial products (Table 2). Once again, it is Pakistani and Bangladeshi households that have the highest odds of being low-users – at least five times the odds of a comparable white
household.
Area effects
There are some very interesting geographical effects, showing that levels of use of financial services depend not only on who you are but also where you live.
First, there are important regional differences in the likelihood of being completely without financial products, with Scottish households being three times as likely to be non-users as those in the South of England; Welsh
households were twice as likely. In England, people living in the North and North West or in Greater London were almost twice as likely to have no financial products as those living in the South (Appendix A, Table 1, Model 1A).
Although more regions are significant in the models of low levels of use, those with the greatest effects are, once again, Scotland, Wales and Greater London (Appendix A, Table 2, Model 2A).
Introducing tenure into the models does not, on the whole, greatly reduce these regional effects, while tenure itself is highly significant
(Appendix A, Table 1, Model 1B and Table 2, Model 2B). Council tenants, for example, are seven times as likely to have no financial products and eight times as likely to be low-users as similar home-owning households. In addition, living in one of the 50 most deprived local authorities in England doubles the chances of a household being without financial products and a similar influence on it
being a low user of financial services. Predictably, adding the deprivation index reduces the regional effect indicating that it is partly due to the existence of pockets of
deprivation (Appendix A, Table 1, Model 1C and Table 2, Model 2C).
It is important to note that the regional tenure, and deprivation index effects are not due to socioeconomic differences, as these are held constant in the models.
Access to financial products:
a hierarchy
So far we have taken an overall view of whether people have any financial products at all, and how many products different types of household are likely to have. In this section we look at access to specific types of financial products, including current accounts, mortgages, a range of savings and investment products and a range of the most common types of
insurance2.
Although only one in 15 households have no financial products at all, rather more are without specific ones. Putting together information from the Family Resources Survey and the Office of Fair Trading survey of vulnerable consumers:
• between one in eight and one in five households do not have a current account;
• a quarter have no savings or investment products;
• about one in five have no insurance policies3;
• a quarter have no credit commitments;
• and a third lack any pension provision.
If households have only one financial product, it is most likely to be either a current account (47%) or a savings account with a building society (21%) or bank (11%). When people have just two products, occupational pensions and structural insurance are added to the list. At the other end of the scale, the products most associated with high levels of use are PEPs, TESSAs, stocks and shares, unit trusts, mortgage payment protection policies, private medical insurance, personal accident policies, and
insurance policies covering loss of earnings through sickness, redundancy or hospitalisation. In general, access to individual financial
products follows overall patterns of use. So, for example, low-income households have the lowest levels of current account holding, and this increases with rising household income. However, some individual products are much more sensitive than others to the factors that seem to increase overall levels of use of financial services. For example, households with net weekly incomes of more than £500 are 1.7 times as likely to have a current account as those with incomes between £51 and £100; but they are 29 times as likely to have an insurance policy to cover them for redundancy (although this particular product is likely to be far less relevant to people who have low incomes because they are not working). Similar effects were found with benefit status. Households claiming no income-related benefits were 2.6 times as likely to have a current account as those claiming Income Support, Housing Benefit
and Council Tax Benefit; and they were 21 times as likely to be insured for redundancy. The most ‘sensitive’ products included (in descending order of sensitivity):
• insurance for redundancy
• insurance for loss of earnings through sickness or disability
• private medical insurance, mortgage payment protection insurance
• PEPs
• Unit Trusts
• mortgages
• and TESSAs.
At the other end of the scale, the least ‘sensitive’ products were (in ascending order of
sensitivity):
• current accounts
• building/structural insurance
• building society savings accounts
• Post Office accounts
• bank savings accounts
• National Savings accounts.
In other words, there is a hierarchy of access to financial products, beginning with current accounts at the bottom. People who are on the margins of financial services markets, if they have any money to spare, tend to keep it in the form of liquid savings. Beyond that, they either have an occupational pension or have insured the structure of their home – both products that they will have been strongly encouraged to take out. Insurance provision for ill-health or loss of income is very rare among those who are least likely to have financial products. This is especially worrying given the fact that they are the very people most likely to need cover.
Notes
1 Based on the Family Resources Survey, which covers 23
different financial products. It does not, however, include either home contents insurance or consumer credit. These two types of product were, however, included in the Office of Fair Trading Omnibus data to which we were given access. Analysis of this data has confirmed the figures using the Family Resources Survey.
2 Home contents insurance is omitted from the analysis as
this data in the Family Resources Survey is incomplete.
3 The Family Resources Survey shows that a third of
households lack any of a wide range of types of policy, but does not ask all householders about home contents insurance. The Office of Fair Trading survey, however, found that 20% of all households had no contents insurance, a figure that is consistent with earlier research (Whyley et al, 1998).
3
The processes of
financial exclusion
There is no single explanation for households having no, or very few, financial products. Although the great majority have never really used financial services to any degree, about a quarter of households with no financial products have had them in the past. This echoes earlier research which has shown that a third of individuals lacking a current account had used one previously but closed it down (Kempson and Whyley, 1998), while half of households with no home contents insurance policy had been insured at some time in the past but not renewed the policy (Whyley et al, 1998). Equally, financial exclusion occurs for a variety of reasons and is neither a single nor a
straightforward process. It encompasses outright exclusion in the form of companies refusing to accept certain households as their customers, and people who self-exclude by making an active and unconstrained choice not to have any financial products. For most, however, the process is much less clear-cut – it is the combined result of marketing, pricing and product design which leads certain groups not to use any financial services.
It is also a dynamic process and includes people for whom financial exclusion is a temporary state, and others for whom it seems likely to be long-lasting, if not lifelong.
Households that have never used
financial services
About three quarters of households with no financial products have been without them for a considerable period of time1. They include:
• elderly people who have always lived on a low income;
• young householders who have not yet engaged with financial services;
• single (that is, never-married) women who became mothers at a very young age and are still caring for their children full-time;
• people who have always been on the margins of work;
• some ethnic minorities.
Several common traits are apparent among these five groups. First, there is a low level of awareness of financial products. Coupled with this is a mistrust of financial services, largely fuelled by adverse press stories about the mis-selling of financial products. Thirdly, because of who they are and where they live, no one has ever tried to sell them any financial products. As one woman put it, “You can’t get anything, not even mail order, round here”. Finally, these households tend to be
marginalised in most other respects – they do not work and they live on run-down council estates where few of their neighbours are in work either.
Elderly, low-income households
Some elderly householders, in their 70s and 80s, have always operated in a cash economy and have managed all their lives without using financial services. They are about one in seven of all households with no financial products.
Case study 1: Elderly low-income
households
A widow aged 78 had always dealt in cash, often keeping substantial amounts at home until it was needed. She had closed her building society account “because there is nothing to put in it”. She did have a life insurance policy, taken out for her grandchildren, which had been sold to her by a door-to-door salesman; the premiums were also collected from her home. She had never used credit because she “... was brought up in the belief that if you wanted something you saved for it and then when you had enough money you went and bought what you wanted.”
Typically, they have always had very low incomes and when younger had only one earner, generally in manual work, whose wages were paid in cash. Consequently, they have never needed a current account for wages and have operated a cash budget in order to keep control. Some may have been forced by employers to have an account for their wages and opted for a simple savings account; this was invariably closed down on retirement. Occasionally they have had life insurance policies, normally those sold door-to-door and generally taken out in the names of their children. However, they are often suspicious of financial services and have always been opposed to the use of credit. Finally, they have never had spare cash for savings, insurance or a private pension.
Young householders
Most young people acquire financial products gradually as their income rises, but many will have basic products such as a bank or building society account even before they set up their own household. Some young people, however, become householders without a secure income from employment and, consequently, have very little involvement with financial services. They represent about one in eight of households with no financial products. Two main factors limit their access.
First, they are considered a bad risk by many financial service providers, most commonly because they are in part-time or temporary employment. For example, one young woman who was working part-time to support herself
“I actually had difficulty in opening up a bank account. I tried Midlands and I also tried Barclays. And at the time I was working part-time and I had a problem opening an account. I think it was probably because I wasn’t working full-time – and National Westminster was the only bank that would open an account for me.”
This young woman, and others like her, will almost certainly start to make more use of financial services once she has found a secure job.
Second, some young people know very little about financial services and, as a consequence, do not seek to obtain products. They may have grown up in households that are on the margins of financial services, and their circumstances are such that they seem unlikely to use many, if any, financial products. This raises the importance of providing financial education in schools.
Single mothers
Unlike disengaged lone parents, who are more likely to be separated and divorced, lone mothers who have never engaged with financial services tend to be single and to have never co-habited with the father of their children. They are also very likely to have had their first child in their teens. Many are housed on hard-to-let council estates that are unattractive to financial service providers, come from families that use little in the way of financial products, and they themselves know very little about financial services. They account for about one in 10 of households with no financial products.
Case study 2: Single mothers
One single mother, who had worked on and off since the birth of her first child, had opened a savings account for her wages to be paid into, but had stopped using this when she gave up work to look after her youngest child. At 37, she had never applied for a current account because she thought she would not get one, and had never used credit in any form. She had almost no knowledge of potential sources of credit, including mail order, which is unusual for someone in her circumstances. She knew no one who had used anything other than the Social
These single mothers do not apply for financial services, such as a current account, consumer credit or insurance, in the belief that they will be refused them. Often this is based on received wisdom and, because few of their friends or neighbours have any financial
products either, they believe the neighbourhood to be red-lined. Some have had applications for a particular product rejected, and this fuels the more generalised belief that “nothing like that is available to people like me”.
Always on the margins of the labour market
The fourth group comprises slightly older households where the main wage-earner has been in and out of work. When they are in employment, it tends to be temporary, insecure or part-time.
Consequently, they are refused facilities such as bank accounts and credit when they apply for them, and on this basis do not even bother trying for others. Moreover, their circumstances are such that they can never afford to save or to take out insurance.
Households in these circumstances are the largest single group with no financial products. They comprise four out of 10 of the total. They include households of all types – single
householders, lone parents, and couples with and without children. They also span a wide age range from 30 to 70.
Case study 3: Marginalised workers
A 38-year-old man lives with his wife, three of their children and a six-month grandchild. He had started out with a “damn good job” but was made redundant. Since then he has “had hundreds of jobs” and has virtually given up hope of ever getting a decent job again. He had recently declined a job with a security firm as the wages were only £2.15 an hour (equivalent to an annual salary of £4,400 for a 40 hour week).
During a brief spell as a self-employed taxi driver, he had opened a building society account, but he had never really used it. They had been refused hire purchase and had “never had any dealings with the banks. We’ve just never had enough money to, really”. Likewise they had nothing in savings and no insurance of any kind. They did, however, borrow from two weekly moneylenders. When they
Kept out or opted out?
had a gas bill they could not pay they “were told to get in touch with [them] so we did, and the understanding was they only had unemployed people”.
Ethnic minorities
Ethnic minorities – and certain Asian
communities in particular – comprise the final group who have never really engaged with financial services, and represent a little under one in 20 of all households with no financial products. A number of interrelated reasons explain this.
Case study 4: Ethnic minorities
Despite having lived in Britain for 35 years, a 65-year-old Bangladeshi man had a remarkably poor understanding of British financial services provision. The only financial institutions he was aware of were banks, and the only financial product he had ever had was a savings account that was no longer in use. He described banks as ‘very fussy’, adding that there was a lot of paperwork, requiring so much personal information and checks of identification, that he did not want to open an account with them.
He preferred to rely on family and friends if they needed to borrow money or to replace possessions following a burglary. He also looked to his children to provide for him and his wife in their old age.
First, some people face language problems and difficulties with the paperwork required when applying for financial products. Among some groups, there is poor understanding of financial services in Britain, including what is available as well as how to get it. For followers of Islam, use of financial services is limited for religious reasons. Finally, there is, among some ethnic minorities, a cultural tradition of relying on the extended family network rather than using commercial sources of finance.
Combined, these reasons almost certainly explain why Pakistani and Bangladeshi households are more likely to be without financial products than are white households in similar socioeconomic circumstances (see Chapter 2). In contrast, other minority groups – such as African-Caribbeans – are more likely to lack financial products because they are on the
margins of the labour market or are single mothers. This, too, is consistent with the results of the modelling reported in Chapter 2.
Disengagement from financial
services
About a quarter of households with no financial products have in fact used them in the past, but have given them up. These split about evenly into those who have experienced a substantial drop in income and women who have been left without financial products following separation or divorce or the death of their partner. A minority of people in these circumstances are either refused products outright or have facilities withdrawn; most of them disengage because the products on offer are felt to be inappropriate or too costly for someone living on a very low income. The fact that state benefits and
pensions can be drawn in cash seems to further encourage people to operate a cash budget, a finding consistent with the statistical modelling reported in Chapter 2.
Disengagement following a drop in income
Many people decide to stop using financial services when they have experienced a drop in income, some because they want to keep control over their money, others because they get into financial difficulties.
Disengagement to keep financial control
When the main wage earner loses their job, households typically re-appraise their financial situation. For some this is an immediate
response as they attempt to accommodate levels of committed expenditure within a drastically reduced budget. A similar process of
disengagement occurs when the main, or sole, wage earner is unable to work through ill-health or disability.
Case study 5: Disengagement following
unemployment
A couple in their 40s had been dependent on state benefits since the husband was made redundant. They had progressively opted out of using financial services, suspending use of their current account
The processes of financial exclusion
insurance policy because they could not afford to keep up the payments, and felt that use of high street consumer credit was inappropriate in their present economic circumstances. They had, however, recently taken out a loan with a weekly collected credit company. Because they could make small weekly cash payments, they felt they were much less likely to fall into arrears, and it enabled them to keep their borrowing under control.
Depending on their incomes, some people give up financial products following retirement, although this is a more gradual process of disengagement than for either the unemployed or long-term sick or disabled. Women often suspend or close financial products when they give up work to have children. In cases where the woman has a partner, the household relies on financial products in his name. Single mothers, however, do not have this option and many choose to disengage from financial services when they leave work and start to claim Income Support. Disengagement also occurs following relationship breakdown, when women who have been accustomed to a
reasonable standard of living have to manage on a greatly reduced income.
Case study 6: Disengagement following
retirement
A couple in their late 60s had altered their whole way of managing money since retiring to suit their reduced income. They had stopped using almost all financial products, including their current account, and had only retained a building society savings account, which they used to raise cheques when necessary. “We haven’t got a bank account, we don’t pay anything direct debit. When you live on a pension, you’ve got to do it, sort of pay week by week because you’ve only got a basic pension to live on.”
Among all these people, there is a clear feeling that financial services are really only appropriate while in work. They deploy a range of
strategies to keep control of their budget that result in a gradual disengagement from financial services.
Their first strategy for making ends meet is to run down any available savings. Some close down their savings accounts; others retain a
Next, they either let life insurance policies lapse or cash them in, or they fail to renew annual policies, such as house and contents insurance. Faced with a need to re-balance the household budget, insurance policies are thought of as an unaffordable luxury. The only exception to this is life insurance for children, which parents try to retain, if at all possible.
At the same time they stop using commercial credit, and other credit facilities such as hire purchase are paid off and not replaced. Some households begin using moneylenders (weekly collected credit) or borrow from the Social Fund if they are eligible. These one-off loans give them greater control over their spending than either overdrafts or credit cards. And because the repayments are either collected weekly or deducted from benefit payments, they are less likely to fall into arrears.
Finally, they suspend the use of their current account and may close it altogether. On the whole, bank accounts are seen as useful for their associated facilities – standing orders, direct debits, overdraft facilities, cheque books and debit cards. But there is a strong feeling among this group that it is too easy to lose control if these facilities are used. Without them, the account is of such limited use that they cease to use it altogether.
The process of disengagement takes differing lengths of time, depending on the event that precipitates the drop in income. On the whole, it is slowest for those who retire, where the drop in income is usually anticipated and occurs at a stage in the life cycle when demands on the household budget are probably at their
minimum. People giving up work because of sickness or disability, who do not expect to return to full-time employment, are generally the quickest to disengage.
Disengagement in response to financial difficulties
Disengagement in response to financial difficulties occurs in broadly similar
circumstances, although it is much less common following retirement. It tends to occur among households that experience a sudden drop in income and are left with financial commitments that cannot be met. In contrast to those who disengage to keep financial control, rather than immediately closing down financial products,
these people begin to juggle their financial affairs, typically ‘robbing Peter to pay Paul’ and relying on credit to see them through. They often have no savings (or redundancy/
retirement lump sums) to mitigate the transition to a low income.
In contrast to those who want to keep control, the process of disengagement for households who are in financial difficulty is often imposed through an inability to keep up payments, and usually occurs at a later stage. The strategies employed by this group in order to regain control over their budget are also somewhat different.
Case study 7: Disengagement following
financial difficulties
A 50-year-old couple fell into financial difficulties when the husband became unable to work five years ago. When the wife was made redundant two-and-a-half years later, she tried to claim on an insurance policy to cover the repayments on a loan. This was only successful on appeal, by which time they owed money to a number of creditors and had been borrowing from a weekly collected credit company to make ends meet – even this company now refused them further credit. During this time, they had overdrawn their current account by £3 and incurred £38 bank charges. They had since stopped using the account entirely.
“I don’t use it because I can’t get a loan or an overdraft and I don’t have anything to put into my bank. I have a cheque book and a cheque guarantee card but, as I said, I don’t use them.”
As they are quite unlikely to have any savings, households in this group more typically rely on overdraft facilities and credit cards to make ends meet during the initial period following the income reduction.
In some cases, current accounts and credit facilities are withdrawn, in others charges imposed for unauthorised overdrafts or missed credit payments lead to closure/suspension of current accounts and of credit facilities. Having a history of debt makes it difficult for this group of people to regain access to many financial products.
Disengagement following relationship breakdown or widowhood
As well as income-related disengagement following relationship breakdown discussed above, women may also find themselves without access to financial services facilities following separation, divorce or the death of a partner. These comprise two main groups: women who cannot get financial products in their own right, and those who do not want to use them.
Left without facilities and cannot get them
Typically, this group comprises divorced or separated women who previously used all financial products in their husband’s name alone, or in joint names. After separation, they need to take out new financial services in their own right. While those in full-time work usually face no problems doing so, women who care for their children full-time and rely on Income Support for their income may find that they are denied access to financial services. They are often rehoused on hard-to-let estates and this, together with their economic
circumstances, can act as a barrier to accessing financial services. Those whose marriages end with money owed to creditors have the hardest time of all.
Case study 8: Disengagement following
relationship breakdown and cannot get
facilities
A young mother had recently separated from her husband when their house was repossessed. When married, as well as a mortgage they had had buildings and home contents insurance and had used a variety of credit sources. Following separation, she was rehoused on a hard-to-let council estate where she could no longer afford to insure her possessions. She could not get access to credit, nor could she get a current account in her own name. In fact, she was a very careful money manager and her husband had got them into financial difficulties.
Left without facilities and do not want them
These women are left without financial products in similar circumstances, although they include more women whose partner has died, often
The processes of financial exclusion
Case study 9: Disengagement following
relationship breakdown and does not
want facilities
A woman in her 60s had not worked for 12 years because of ill-health. Consequently, when she separated from her husband, almost all financial products were in his name. She decided against taking out replacement products due to her drop in income. She felt that a cash budget gave her far greater control – she drew her pension weekly in cash and made weekly payments towards all her bills there and then. The remaining money she managed on a daily basis.
They differ from the previous group in that they
choose not to take on financial products in their own name, because they prefer to manage their household budget in cash. Often they are women who have previously played only a minor role in household money management.
Individuals within households
So far we have concentrated on households with little or no use of financial services, on the grounds that many products are best viewed in that way. A home contents insurance policy, for example, covers all members of a household. But it is important to acknowledge that individuals within a household may not have products personally even though someone else may have them. The most common situation is among women, who rely on financial products, including current and savings accounts, that are held in their partner’s name.
Some will have had them in the past, but given them up. This is most common among women who give up work to raise a family and have a partner who manages all the household finances and has all the financial products needed by the household in his name.
Others will never have had financial products in their own name. The two most common cases are elderly women who have not worked since having children and women from some ethnic minority groups (Pakistani and Bangladeshi women in particular), where the cultural division of responsibilities means that women neither take paid employment nor do they play