Private Equity in the Global Economy:
Evidence on Industry Spillovers
Serdar Aldatmaz
A dissertation submitted to the faculty of the University of North Carolina at Chapel Hill in partial fulfillment of the requirements for the degree of Doctor of Philosophy in Business Administration (Finance) in the Department of Finance of the Kenan-Flagler Business School.
Chapel Hill 2013
Approved by:
Gregory W. Brown
Paolo Fulghieri
Christian T. Lundblad
Paige Ouimet
iii
Abstract
SERDAR ALDATMAZ: Private Equity in the Global Economy: Evidence on Industry Spillovers.
(Under the Direction of Greg W. Brown)
Using a novel dataset on global private equity investments in 19 industries across 48
countries, I find that following private equity investments employment, profitability, and
labor productivity increase for publicly listed companies in the same country and industry.
This suggests that positive externalities created by private equity firms are absorbed by other
companies within the same industry. These effects are more pronounced in country-industries
with higher levels of competition, where it is more likely that the competitive pressure from
private equity-backed targets forces industry peers to improve. Furthermore, the results are
concentrated in countries with moderate levels of innovative capacities, which are shown to
be the best absorbers of productivity spillovers in studies on spillovers from foreign direct
investments. I further find that capital expenditures of public firms also grow faster
subsequent to private equity investments. On the financial side, I provide evidence that
industry stock market returns increase after the industry receives venture capital, while
iv
v
Acknowledgements
I am greatly indebted for the guidance and support of my advisor Greg Brown. I am
also grateful to Chris Lundblad, Paige Ouimet, David Robinson, and Paolo Fulghieri for their
advice and support. I thank Anil Shivdasani, Morten Sorensen, Tim Jenkinson, Robert
Harris, Yiorgos Allayannis, Merih Sevilir, Inessa Love, Geoffrey Tate, Nick Gantchev, Pab
Jotikasthira, and Diego Garcia for useful comments and discussions. I also thank the
conference participants at the Global Private Investing Conference. Finally, I would like to
thank UNC's Institute for Private Capital, the UAI Foundation, and the Private Equity
Research Consortium for their support of this project, as well as The Burgiss Group for their
vi
Table of Contents
List of Tables ... vii
List of Figures ... viii
1.
Introduction ... 1
2.
Background ... 9
3.
Data and Methodology ... 15
3.1 Data ... 15
3.2 Empirical Strategy ... 21
4.
Results ... 25
4.1 Private Equity and the Real Economy ... 25
4.2 Spillovers across Countries and Industries ... 36
4.3 Private Equity and the Financial Economy ... 41
4.4 Robustness Checks ... 45
5.
Conclusion ... 49
vii
List of Tables
Table 1. Private Equity Investments around the Globe ...53
Table 2. Private Equity Investments across Industries ...59
Table 3. Descriptive Statistics ...60
Table 4. Univariate Comparisons ...61
Table 5. Private Equity and the Real Economy ...63
Table 6. Buyout versus Venture Capital ...64
Table 7. Private Equity and Investment ...65
Table 8. Industry Spillovers from Private Equity and Legal Strength ...66
Table 9. Industry Spillovers from Private Equity and Innovative Capacity ...67
Table 10. Industry Spillovers from Private Equity and Competitiveness ...68
Table 11. Private Equity and the Financial Economy ...69
viii
List of Figures
Figure 1. GlobalPrivate Equity Capital Invested ...72
Figure 2. U.S. and U.K.’s Share of Global Private Equity Capital ...73
1.
Introduction
Most of the existing studies on private equity find evidence for increased firm performance
following the transactions (Cumming et al. 2007, Kaplan and Stromberg 2009). Given all of
the research and publicity about private equity investments, it is surprising that little evidence
is available to determine whether they have on net a positive or negative impact on the
industries they invest in. Building on the idea of knowledge spillovers introduced by
Marshall (1890), a large literature in economics has examined how technological
advancements and productivity gains at some companies in an industry spill over onto the
other companies within the same industry.1 Similarly, the impact of private equity capital
may not be limited to the companies receiving investment; it might create positive and
negative externalities that have implications for the industry as a whole. Hence, how overall
industry dynamics change following private equity investments is an important question that
needs to be answered to properly frame the broader debate concerning private equity's role
for the economy.
Using a novel dataset on actual private equity investments between 1990 and 2011, this
paper explores the dynamic relationship between private equity capital and broad industry
growth. Focusing on how aggregate industry measures of publicly listed companies change
following a private equity capital investment into an industry, I am able to measure the
1 In a review of studies related to spillovers from multinational corporations onto local companies, Blomstrom
2
spillovers from target companies that receive actual private equity capital to the publicly
listed companies within the same industry.
Jensen (1989) argues that private equity is the superior business model when compared to
public equity as it provides a better alignment of incentives between owners and managers as
well as a more efficient management of resources. Following Jensen, many papers that study
the impact of private equity transactions on the target companies provide evidence for the
positive impacts on firm-level performance. However, the popular press, labor unions, and
policy makers remain concerned about the private equity industry's business model in terms
of its impact on the real economy.2 As such, how private equity investments affect industry
performance is a question that is of great importance not only to academic researchers but
also to practitioners and policy makers. On one hand, with the entrance of private equity
investments into an industry, firms not receiving investments could be forced to improve
efficiency by utilizing the new technologies and practices to compete with the more efficient
private equity-backed firms.3 Thus, there are potential industry-wide externalities from the
competitive pressure introduced by private equity. If companies are capable of absorbing the
spillovers from private-equity backed firms, the industry overall might experience
performance gains. On the other hand, if the companies that do not receive private equity
investment cannot keep up with the new technologies and the competitive pressure, the
2
Reports by the Financial Services Authority (2006) and the Service Employees International Union (2007) discuss concerns about private equity and its implications for the economy.
3
3
efficiency gains at the investment-receiving companies might drive demand away from their
competitors.4 Hence, the pressure might negatively affect the rest of the industry.5
As a motivating example, consider the buyout of the Hertz Corporation. The company
was bought out by a group of private equity firms in 2005 and its performance significantly
improved following the transaction. After the buyout of Hertz, the two main competitors in
the same industry, Avis Budget and Dollar Thrifty, also implemented new strategies to
increase efficiency, which most likely were triggered by the competitive pressure from the
more efficient private equity-backed Hertz. Indeed, over the two years following the buyout
of Hertz, profitability and productivity both increased for Avis Budget and Dollar Thrifty.6
Similarly, using a large sample of global private equity investments, I study if there are
productivity spillovers from private equity investments onto the public companies within the
same country and industry. I indeed find that private equity capital invested in an industry
leads to higher employment growth, profitability growth, and labor productivity growth
within the public firms in the same domestic industry: on average, a one standard deviation
increase in the amount of private equity capital invested (adjusted by industry sales) leads to
a 0.8% increase in employment growth, 1.3% increase in labor productivity growth, and
2.6% increase in profitability growth.
Given the different structures of buyout and venture capital transactions, I also compare
how the impact of private equity on the performance of public firms is different after buyout
4
Aitken and Harrison (1999), for example, find that the entrance of more efficient foreign companies negatively impacts the performance of local firms because they attract customers away from domestic firms. Djankov and Hoekman (2000), Feinberg and Majumdar (2001), and Kathuria (2002) are other examples of studies providing evidence for negative impacts of spillovers from foreign direct investments.
5
Even if the competitive pressure drives the most inefficient companies out of the market, that might still be beneficiary for the economy as a whole in the long-run where private equity-backed firms act as catalysts of a constructive destruction process.
6
4
versus venture capital investments. My findings indicate that buyout investments lead to
spillovers through financial engineering creating higher leverage and stronger governance,
while venture capital investments create positive industry-wide externalities through the
introduction of new technologies and innovation.
While it is generally a challenge in private equity studies to pin down which way the
direction of causality goes due to the potential endogeneity of private equity investments, the
implementation of the panel VAR to some extent mitigates the problem of reverse causality.7
I find no evidence that past values of employment growth, profitability growth, or labor
productivity growth are associated with the amount of private equity capital invested in an
industry. Thus, I am able to identify a causal link from private equity to the real economy to
the extent that private equity investments are exogenous after incorporating all the
information about how the industry did in the past. While this finding excludes reverse
causality stemming from past values of industry performance affecting private equity
investments, there might be other time-varying8 unobservables that are driving the findings.
Notably, one could argue that private equity companies have superior foresight and time their
investments based on their expectations about the industry prospects going forward. It would
admittedly be impossible to perfectly control for expectations and fully exclude the
alternative explanation of market timing. However, although no single finding would be
7
The ordering of the variables in the VAR model is important as it determines which variable affects the other variables contemporaneously and with a lag, or only with a lag. In the analysis throughout, I assume that private equity capital affects the industry variables both contemporaneously and with a lag, while it is impacted only with a lag. A caveat to this is, if private equity companies observe industry performance and quickly time their investment within the same year, the VAR where private equity capital is the first variable in the system will not capture this. However, all the results in the paper stay the same when the ordering of the variables is changed.
8 The panel VAR estimation allows for country-industry and time fixed effects, so any time-invariant
5
conclusive by itself, the evidence provided throughout the paper, including the different
findings for buyout versus venture capital as well as the cross-sectional findings, altogether
are indicative of a causal relationship where private equity investments lead to spillovers.9
Next, I explore the dynamic relationship between industry-wide investment among the
public firms and private equity, and find that higher levels of private equity capital lead to
higher growth in industry-wide capital expenditures suggesting that private equity companies
not only contribute to short-term performance advancement but can also facilitate long-run
growth through more real investment at the industry-level.10
Lastly, I focus on two financial variables: industry-wide net debt growth and stock
market returns. I find that net debt of the industry also grows faster following buyout capital
investments into the industry suggesting that the financial structures introduced by private
equity companies at the portfolio companies in buyout transactions also spill over onto the
other companies in the industry leading to increased levels of leverage. Furthermore, while
there is no evidence for private equity capital chasing returns, i.e. past values of industry
returns are not related to the level of private equity capital invested, overall stock market
returns increase following venture capital investments indicating that spillovers of
operational improvements have implications for firm values as well.
The dataset used in the paper is provided by The Burgiss Group and is unique in its
detailed coverage of private equity investments at the global level. The data are aggregated
using actual fund investments, both buyout and venture capital, in portfolio companies. It
9 See Section 5.6 for a discussion of the alternative market-timing hypothesis in greater detail.
10
6
covers a total private equity capital of $1.3 trillion invested in 48 countries across 19
industries from 1990 to 2011 and is the first dataset providing actual dollars of invested
private equity capital at the industry level across a large number of countries.11
While the existing evidence on private equity has been mostly on U.S. and European
data, studying global investments in a cross-country setting is important for two reasons.
First, while private equity has been largely a U.S.- and U.K.-only phenomenon pre-1990, the
share across the two countries out of the total amount of global private equity capital invested
has come down to around 60% in 2011; in other words, 40% of the total global private equity
capital is now being invested in countries other than the U.S. and the U.K. Abolishment of
entry barriers for foreign capital coupled with high growth potentials in developing countries
are most likely the main reasons behind this trend. Despite the fact that private equity has
become a global asset class, there is very little evidence on how private equity impacts
performance globally due to lack of good research quality data at the global level.
Second, the cross-section of countries allows me to study the different impacts of private
equity in countries and industries with different characteristics, which provides evidence
consistent with a causal effect of private equity on industry spillovers. Both the implications
of the private equity business model and how well the spillovers are absorbed within an
industry might be different depending on the institutional environment as well as the level of
technological advancement in a country. Strong legal institutions are necessary for private
equity companies to better implement the governance structures that make their portfolio
companies more efficient (Cumming and Walz 2009). As such, I predict and find that the
positive effects of private equity investments on the public companies within the same
11
7
industry are concentrated in countries with a stronger legal environment, measured by the
quality of legal institutions and intellectual property rights.12
For spillovers from new technologies to be more effective, the companies that do not
receive investment should be in need of new technologies, i.e. they should possess fewer
technological skills. At the same time, some level of existing technological skills is needed
for the spillovers to be absorbed. In line with this, the existing evidence on spillovers from
foreign direct investments (FDI) shows that productivity spillovers are strongest for
companies in countries with moderate levels of technological advancement.13
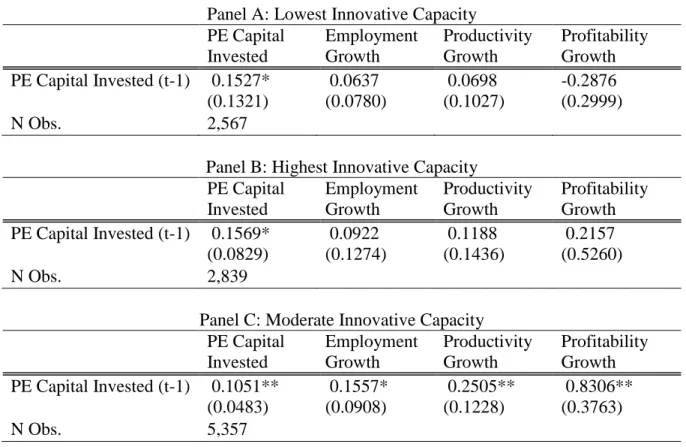
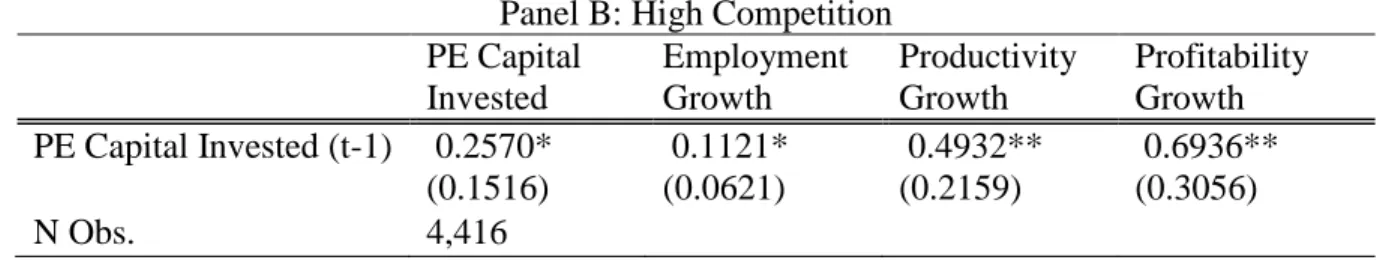
Lastly, I also explore how the results differ depending on the level of competition within
a country-industry. Spillovers resulting from the competitive pressure coming from the more
efficient private equity-backed companies are expected to be stronger in country-industries
that are more competitive, where the pressure would be highest. Indeed, I find that the
positive impact of private equity investments are more pronounced in country-industries with
higher levels of competition. These cross-sectional results altogether provide support for a
causal effect of private equity investments on industry spillovers as alternative stories such as
market timing would not predict these cross-sectional differences.
This paper contributes to several literatures in finance and economics. First, providing
evidence on the positive impact of private equity capital on industry performance at the
global level, it contributes to the large body of studies that examine how company
12
The protection of intellectual property rights is particularly important as it impacts how extensive the private equity companies would introduce new technologies at their portfolio companies. Mansfield (1994) finds that technology spillovers are weakest in countries with weak intellectual property protection.
13
8
performance changes post private equity transactions (Kaplan 1989, Cao and Lerner 2009,
Davis et al. 2009). With the evidence for positive spillover effects at the industry-level, the
paper supports and complements the existing firm-level evidence. Second, it contributes to
the existing spillover literature by exploring spillover of management practices, knowledge,
and technology from private equity-backed companies to the public companies within the
same industry. It provides evidence for a different channel for spillovers other than
multinational corporations, the most discussed channel in the literature.14 Lastly, it also
contributes to the large literature of finance and growth that examines the link between
financial development and economic growth of countries. Existing studies look at how the
development of a country's public and credit markets affects output growth by providing a
better allocation of capital (King and Levine 1993, Levine 2004). I explore the impact of a
different financial asset class, private equity, and show that its entrance into an industry also
enhances industry growth by creating positive externalities within the industry.
The remainder of the paper is organized as follows. The next chapter further discusses the
related literatures and how the paper fits in, together with a real example of industry
spillovers after a private equity transaction. Chapter 3 introduces the data and presents some
descriptive analysis, as well as outlines the empirical strategy, the panel VAR approach.
Chapter 4 presents the empirical results, and Chapter 5 concludes.
14 This is an important contribution as 'the degree to which other modes of international business (besides
2.
Background
According to Kaplan and Stromberg (2009), private equity companies improve their portfolio
companies using practices that can be summarized under three main headings: financial
engineering, governance engineering and operational engineering. Financial and governance
engineering refer to the structure of ownership and financing implemented at these
transactions that lead to better monitoring and incentive alignment to overcome agency
problems at the portfolio companies, while operational engineering refers to management
practices that large and experienced private equity firms use to improve operational
efficiencies of their portfolio companies. Firm-level performance after private equity
transactions has been examined extensively in the existing literature in studies looking at
transactions in the U.S., the U.K. or European Union countries.
In his seminal work, Kaplan (1989) tracks large management buyouts of publicly held
companies and finds evidence for improved operating performance at these companies as
well as increased market values. Similarly, Muscarella and Vetsuypens (1990) study reverse
leveraged buyouts (LBO), and find that profitability at target companies increase following
the transactions. More recently, Davis et al. (2009) show that U.S. firms receiving a private
equity investment experience higher subsequent productivity growth. Complementing the
existing evidence on operating performance, Cao and Lerner (2009) provide evidence for
superior stock market performance for reverse LBOs. Studying a sample of private
equity-backed companies in Western Europe, Acharya et al. (2009) also find evidence for
10
operating and stock market performance, its impact on employment receives the most
attention from the press, and labor unions.
Private equity companies are typically blamed for sacrificing jobs for short-term
profits. In one of the most detailed studies on this issue, Davis et al. (2011) examine
establishment-level job creation and destruction at U.S. establishments using data from the
U.S. Census Bureau. They find that private equity-backed companies have higher job
destruction at existing establishments, but at the same time higher job creation at new
establishments. Their conclusion is that the net impact of private equity transactions on
employment is very moderate. Similarly, Popov and Roosenboom (2008) find that venture
capital leads to higher new business creation in their study of 21 European countries over the
period 1998 - 2008.
Most of the existing studies on private equity transactions have found evidence for
superior subsequent performance at the firm-level. However, it is still unknown how private
equity transactions affect the other firms, which do not receive private equity capital, within
the same country-industry. In this paper, I study the performance of all the public companies
within a country-industry as a whole in an attempt to capture the spillovers from target
companies to the rest of the industry.
There is a large-established literature that has provided evidence for the existence of
productivity spillovers.15 For example, several studies on different countries, including Caves
(1974) on Australia, Globerman (1979) on Canada, and Blomstrom and Persson (1983) on
15
11
Mexico, have shown positive spillover effects from FDI to domestic industries (see
Blomstrom and Kokko, 1998 for a review). Similarly, Bernstein and Nadiri (1989) provide
evidence for research and development spillovers within an industry and find that overall
costs in an industry decline following improvements in technology as knowledge expands to
externality-receiving firms. On the other hand, Aitken and Harrison (1999) find that the
entrance of foreign companies negatively impacts the performance of local firms because
they attract customers away from domestic firms raising questions about the existence of
positive spillover effects.
Similar to FDI, private equity firms also introduce new technologies, know-how and
managerial expertise to the industry through their portfolio companies. These new practices
would then potentially spill over within the industry through different channels16 and lead to
industry-wide efficiency gains. As such, studying the impact of private equity on overall
industry dynamics is of first order importance to answer broader questions about private
equity and its implications for the economy.
This paper is closest to the recent study by Bernstein et al. (2012). In their study of 26
OECD countries between 1991 and 2007, they find that industries which had at least one
private equity transaction in the past five years grow faster in terms of employment and
productivity. They, however, do not find evidence for differences between industries with
high versus low amounts of private equity capital. There are several significant differences
between this paper and theirs. First, they look at the overall industry performance following a
private equity transaction, including the companies receiving private equity capital and
16
12
others, while I focus on aggregate industry measures of publicly listed companies only. This
allows me to more clearly identify the spillover effects from private equity-backed
companies to companies that do not receive private equity capital within the same industry.
Second, their measure of private equity is the existence of any private equity transaction in an
industry, whereas I look at actual dollars of private equity capital invested. Lastly, they study
a sample of OECD countries between 1991 and 2007, while I study 48 countries, including
both developed and developing nations. This allows me to provide the first evidence on the
impact of private equity investments in developing nations and also allows me to compare
how the spillover effects are different for countries and country-industries with different
characteristics, which also provides support for a causal effect.
The buyout of the car rental company Hertz was one of the biggest buyout
transactions in history. The company was acquired for $14 billion by a private equity
consortium consisting of the Carlyle group, Merrill Lynch's investment arm, and Clayton
Dubilier & Rice at the end of 2005. After the buyout, significant changes were made at the
company to cut costs and improve operational efficiency. For example, before the buyout
once a car was dropped off at a rental location, it was being cleaned and refueled at different
work stations, which the new management realized was creating too much idle time and
decreasing operational efficiency. To increase efficiency, cleaning stations were moved to
where the cars are being refueled resulting in a doubling of the number of cars that could be
processed every hour. In additional to operational changes, the private equity group also
changed the governance structure of the company and started to more closely monitor the
management.17 Shortly after the buyout, the private equity group filed for an initial public
17
13
offering for Hertz. This quick move raised concerns about the intentions of the private equity
companies backing Hertz, and critics argued that market-timing drove their decision. They
were criticized for being focused on short-term profits for their own sake rather than
operational improvements at the company that would facilitate future growth. Despite all
these critics, the company was taken public at a value of $17 billion suggesting that the
improvements made by the private equity group lead to a 21% increase in firm value.18
During the same time period, Avis Budget and Dollar Thrifty, the two biggest
competitors of Hertz, experienced significant performance gains after Hertz was bought out
by the private equity consortium. For example, in 2006 Avis Budget introduced a process
improvement initiative called "Performance Excellence", designed to make vehicle rental
processes more efficient, cut costs, and enhance the customer rental experience. Similarly,
Dollar Thrifty announced the implementation of several cost-saving initiatives, including
information technology outsourcing as well as more investment into improvement of existing
IT systems to increase efficiency. These efforts are most likely a response to the competitive
pressure from Hertz, suggesting the existence of spillovers from competitive pressure. In
fact, profit margins increased by 10% and 7%, while labor productivity, measured by sales
per employee, also increased by 5% and 6% at Avis Budget and Dollar Thrifty, respectively,
from 2006 to 2007. During the same period, employment did not change at these companies.
This specific example suggests that practices and technologies causing efficiency
gains at a private equity-backed company might spill over onto other companies within the
same industry over a very short period of time due to the competitive pressure, and lead to
overall performance gains at the firms that do not receive private equity capital. Hence, the
18
14
rest of the paper tries to answer if this is indeed the case on a study of 48 countries and 19
3.
Data and Methodology
3.1 Data
The private equity investment data comes from The Burgiss Group (Burgiss), a software
company providing record keeping and performance analysis services to the largest
institutional investors in the private equity universe. The major advantage of this dataset over
others is that Burgiss sources its data exclusively from limited partners, as opposed to general
partners (GP); so, the typical biases associated with GP-sourced datasets are not present.19
Recently, Harris, Jenkinson and Kaplan (2012) use Burgiss data and compare the existing
evidence on fund performance found using other commercially available private equity
datasets to the evidence from Burgiss. For detailed information about Burgiss and its
coverage of the private equity universe, see Harris et al. (2012) and Brown et al. (2011).20
The specific Burgiss data used in this paper has actual dollar amounts of private
equity capital invested globally, including both buyout and venture capital, at the
country-industry-year level over the period 1990 - 2011. The data cover over 77 countries and
provide aggregated company level private equity capital invested at the industry level based
on the Industry Classification Benchmark (ICB). So, an example of a unit of observation
19
GP-sourced databases on private equity have significant biases as GPs might strategically stop reporting. Burgiss sources its data entirely from LPs, and data are cross-checked across different investors in the same fund, which leads to a high level of integrity and completeness.
20
16
used in the analysis would be the $ amount of private equity capital invested in India in the
technology industry in 2000. This is the first dataset having actual dollar amounts of private
equity capital invested at this level of detail globally. As the dataset is unique and novel in its
coverage of private equity investments around the globe, some simple descriptive analysis is
to follow.
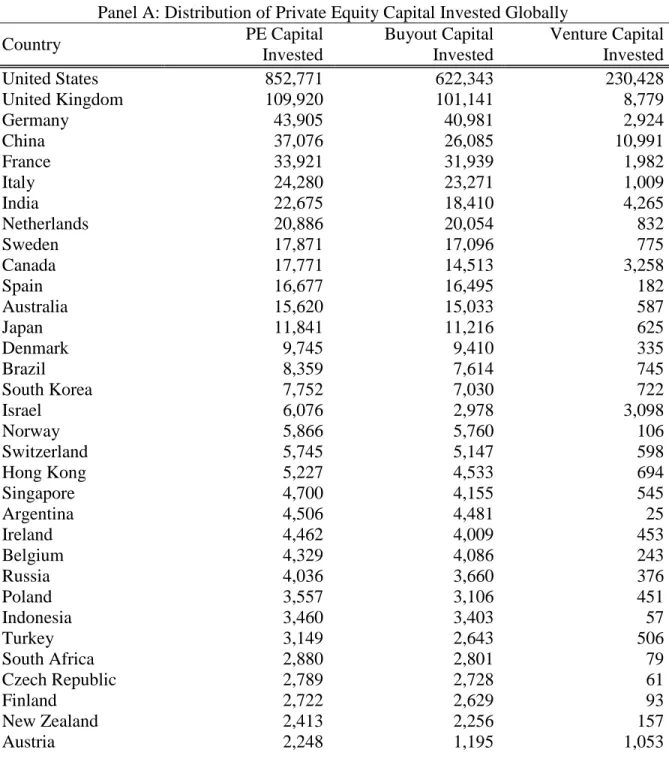
Table 1 presents the distribution of private equity capital invested globally among 48
countries in the sample between 1990 – 2011. Panel A ranks the countries based on the total
dollar amount of private equity capital received, with amounts in million U.S. dollars and
inflation adjusted to 2011. Column 1 shows that the U.S. and the U.K. have received the
highest amount of private equity capital over the time period. While venture capital makes up
about 25% of total capital invested in the U.S., its share is less than 10% for the U.K.
Developed European countries are also among the countries receiving large amounts of
investments. Similar to the U.K., more than 90% of the total amount of capital received is
buyout capital in these European countries. Another important observation to note is that
China and India rank 3rd and 7th, receiving more than $37 billion and $23 billion of private
equity investment, respectively. About 30% of the total amount of capital invested is venture
capital in China, whereas venture capital makes up 17% of the investments in India.
In Panel B, countries are ranked by the total amount of private equity capital received as a
percentage of their GDP.21 U.S. and U.K. are again on top of the list. Sweden and Denmark
rank 3rd and 4th while they were ranked only 9th and 14th in Panel A, so they actually
received a large amount of capital when compared to the size of their economies. Ireland,
Israel, Bulgaria, Singapore and Czech Republic also rank high based on the GDP adjusted
21 The ratio is calculated separately for each year between 1990 and 2011, and then the average is reported
17
numbers. China and India, on the other hand, go down the list due to their large economies.
Lastly, Panel C presents countries ranked by the amount of private equity capital received as
a percentage of a country's FDI inflow. U.S. is again on top of the list followed by Denmark,
Germany, and South Korea. India ranks 8th, while China ranks much lower due to the large
amount of FDI flowing into China. Figure 3 presents the time-series of the ratio of global
private equity investments to global FDI inflows. It showcases the increasing importance of
private equity investments as another source of international capital flows indicating the
importance of studying global private equity investments as a channel for productivity
spillovers. Overall, Table 1 shows that private equity has become global, and although U.S.,
U.K., and other big European countries are still big hubs for private equity investments,
emerging economies such as China, India, and Brazil also get a large portion of the total
private equity capital invested globally.
Table 2 provides the industry distribution of total private equity, buyout and venture
capital invested globally between 1990 -- 2011. The technology sector received the highest
amount of capital, followed by industrial goods and services, and health care. The technology
sector received more venture capital than buyout ($133 billion versus $124 billion), while a
very big portion of private equity capital invested in industrial goods and services is buyout
(only 7% of total invested capital is venture capital). The health care sector received $168
billion of private equity capital in total, with 40% of it being venture capital. In almost all the
other sectors, buyout capital makes up more than 90\% of the investments with the exception
of telecommunications where the share of venture capital is around 20%. Overall, Table 2
exhibits that venture capital went more into R&D intensive sectors such as technology and
18
The data on industry performance variables come from Datastream's Global Equity
Indices that provides accounting as well as market price data for different industries in 53
countries classified based on Industry Classification Benchmark (ICB), a classification
scheme categorizing over 70,000 companies and 75,000 securities worldwide. The
industry-wide measures are calculated using data from financial statements of a sample of publicly
listed companies whose stocks cover a minimum 75% of the total market capitalization in
every country-industry each year. The private equity investment data is matched to the
industry performance data at the country-industry-year level using the ICB classification.
Additional country-level variables used in the analysis come from World Bank's World
Development Indicators (WDI), which are then matched to the other data by country and
year. Country-level data on legal environment, namely quality of institutions and intellectual
property rights, and level of innovative capacity come from World Economic Forum's Global
Competitiveness Index database. The final matched dataset has around 11,000
country-industry-year observations covering 48 countries and 19 industries.
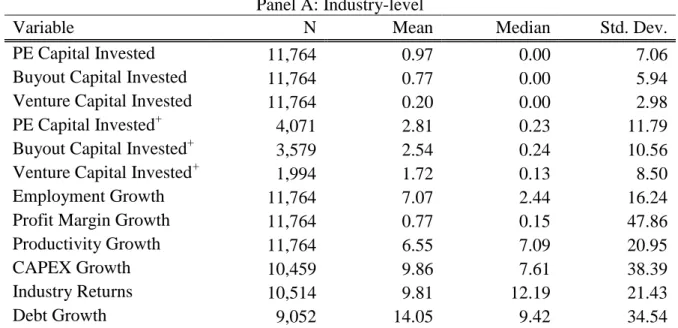
Table 3 presents summary statistics for the industry- and country-level variables.
Variable definitions are provided in Table A1. Over the sample period, industry-wide
employment grew at 7% on average, while median employment growth is 2.4%. Labor
productivity on average grows at 7%. These seem like high numbers for industry-wide
employment and productivity growth, but note that the sample includes developing
economies where industries can grow much more rapidly than mature economies like the
U.S. Average (median) net profit margin growth is 0.8% (0.15%) for the sample. The
average (median) growth for industry returns (annual change in the value of industry stock
19
variables. Average (median) GDP growth is 2.2% (2.5%) in the sample. Public market is a
measure of the liquidity of a country's stock markets, measured as the total value of stocks
traded as a percentage of GDP. The average (median) value of stocks traded is 48% (22%) of
GDP for the sample. Similarly, credit market is a proxy for the credit market development of
a country, measured by the total amount of credit given to the private sector as a percentage
of GDP. Private sector credit is on average 80% of a country's GDP in the sample.
The goal of this paper is to identify the impact of private equity investments on
industry level employment growth, productivity growth, and profitability growth to identify
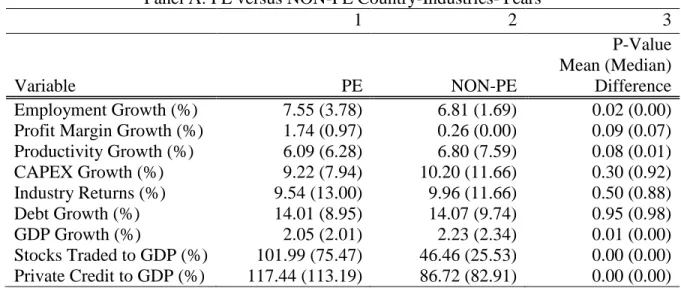
spillovers from private equity-backed companies to the rest of the industry. In Table 4, I
compare average and median employment growth, profitability growth and productivity
growth, along with some other variables, in subsamples of country-industry-years. Columns
1 and 2 of Panel A present mean (median) values for the subsamples created based on a
private equity indicator which takes the value of 1 at time t if the country-industry received
capital in that year, and 0 otherwise. Column 3 presents p-values for the mean (median)
difference between these subsamples from a t-test (Wilcoxon rank-sum test). Average
employment growth and profitability growth are both higher in country-industries with a
private equity investment, while average labor productivity growth is higher in the subsample
of country-industries that did not receive any private equity capital. The negative association
with productivity growth might reflect that private equity companies choose less productive
country-industries to invest where there is more room to grow. The average growth in capital
expenditures, net debt and industry returns are not significantly different among the
subsamples. Furthermore, countries that received private equity capital seem to have more
20
country characteristics suggest that private equity capital flows more into developed
countries, which typically have slower output growth and more developed financial markets.
This is consistent with the U.S. and U.K. receiving high amounts of capital and might be due
to the availability of better exit opportunities for the private equity companies in those
countries.
Next, I limit the sample to country-industry-years with positive amounts of private
equity capital invested, and compare means among subsamples of high versus low
investments. Results are presented in Columns 4, 5 and 6 in a similar fashion. Several of the
results are similar to the earlier comparison. Country-industries that received higher amounts
of private equity capital have faster growth in employment and profitability on average at the
time of investment, and the differences are larger in magnitude. Capital expenditure growth
is not statistically different among the subsamples, as in the earlier comparison. Some results
however are different from the conclusions drawn from the comparison of country-industries
with and without any investment. Labor productivity grows faster for country-industries
receiving higher amounts of investments, but the difference is not statistically significant.
Industries that receive higher amounts of private equity capital have higher industry returns,
and debt growth.
Overall a couple of conclusions can be made from the univariate comparisons.
Industries that receive private equity capital have higher employment and profitability
growth than industries that did not, and among the industries that received investment, the
ones with higher amounts of capital experience faster growth. Labor productivity growth
seems to be lower in industries with private equity investments, but among the industries
21
returns seem not to matter as for whether there is any private equity investment or not,
however among the industries with private equity investments, more capital is associated
with higher stock returns at time of investment.
These results suggest a positive relationship with the level of private equity capital invested
in an industry and employment growth as well as profitability growth and industry stock
returns. The relationship of private equity with productivity growth, on the other hand, seems
to be ambiguous.
Although these results are suggestive, it is very hard to make any conclusions about
the actual relationship between private equity and industry performance given the potential
endogeneity stemming from reverse causality: the decision of private equity companies to
invest in a specific industry in a specific country is most likely endogenous. So, even though
a multivariate analysis would allow to include additional controls, naive OLS regressions
would also be limited to determine the impact of private equity on industry performance.
Considering the endogeneity, a natural experiment or a good outside instrument for
the amount of private equity capital would be the ideal case to identify the causal impact of
private equity on industry dynamics. Unfortunately, neither natural experiments nor good
instruments are easy to come up with in this circumstance. Thus, in the absence of these I
make use of the time-series component of my data, and in an attempt to unravel the direction
of causality, I apply a Vector Auto-Regression (VAR) model on the panel of
country-industry-years. Next section discusses the panel VAR approach.
22
A VAR is a system consisting of N linear equations with N variables where each variable is
explained by its own lagged values together with the current and past values of the remaining
N - 1 variables in the system. After being introduced by Sims (1980), it has been widely used
to explain the dynamic behavior of multivariate economic and financial time-series. The
main advantage of this estimation methodology is that it treats all the variables in the system
as endogenous which leads to a better identification of the dynamic relationships between the
variables in the system. In the absence of exogenous instruments, a VAR estimation is useful
to deal with endogeneity as it uses lagged values of the variables as instruments.
Although the VAR approach is long-established, it has not been widely used on panel data
until recently. Love and Zicchino (2006) apply a VAR model on firm-level panel data from
36 countries in their study of the dynamic investment behavior of firms in an attempt to
isolate the impact of financial factors from fundamental factors that affect firm investment. I
follow their empirical methodology and apply a VAR on the panel of country-industry data
from 48 countries in the period of 1990 - 2011. In addition to utilizing the time-series
component of the data treating the variables in the system as endogenous, the panel VAR
also allows for unobserved individual heterogeneity by including country-industry fixed
effects in the estimation. More specifically, following Love and Zicchino (2006), I estimate a
panel VAR system of the following form:
, (1)
where
Xci,t : a three or four variable vector consisting of industry-level variables together with a
measure of private equity capital invested
23 τt: time fixed effects.
Country-industry fixed effects are included to control for any unobserved
time-invariant individual heterogeneity in the variables. In a single model specification, fixed
effects may be removed by demeaning all the variables in the model at the individual
observation level, which would be country-industry in this case. However, in this type of
VAR specification, where all variables are instrumented by their lagged values, fixed effects
when introduced by demeaning would be correlated with the regressors violating the
exclusion restriction of the instruments. To overcome this problem, I apply a forward-mean
differencing, also known as the “Helmert” procedure (Arellano and Bover, 1995), where only
the forward-mean for every country-industry-year is removed. After the Helmert
transformation, the model is then estimated using a system GMM where lagged values of the
regressors are used as instruments. The specification also includes time-fixed effects to
remove the effect of global macro shocks that might affect all the variables in the system.
In a VAR specification, the ordering of the variables in the estimation does matter.
The assumption is that every variable in the system affects the subsequent variables both
contemporaneously and with a lag, while later variables affect the previous ones only with a
lag. In other words, variables that appear earlier in the ordering are assumed to be more
endogenous. In the estimations throughout the paper, I assume that private equity capital
invested affects the industry variables both contemporaneously and with a lag, while it is
impacted only with a lag.22
The goal of the panel VAR methodology is to identify the direction of causality
between private equity capital invested in an industry and industry growth in terms of
22
24
employment, productivity, and profitability. It should be noted that as the industry measures
are aggregated from publicly listed companies in an industry, the effect that will be identified
would be a measure of spillovers from private equity-backed companies to the rest of the
4.
Results
In this section, I estimate a panel VAR as in equation 1, where the X vector includes the
amount of private equity capital invested in an industry adjusted by industry sales,
industry-wide employment growth, profitability growth and labor productivity growth. I am trying to
identify what the impact of private equity capital is on the growth in employment,
productivity and profitability of the public firms in an industry in an attempt to measure
technology and productivity spillovers from private equity backed-companies to the rest of
the industry.
4.1
Private Equity and the Real Economy
4.1.1 Private Equity, Employment, Productivity and Profitability
Most likely, employment, labor productivity and profitability are jointly determined in an
industry, and private equity companies observe past performance of an industry when
deciding whether or not they should make an investment. As such, all the variables are
endogenous. The VAR model allows me to cleanly identify the direction of causality
between my variable of interest, private equity capital invested, and the other variables in the
system to the extent that the amount of private equity capital invested in a country-industry is
exogenous after controlling for lagged values of industry performance in that country. If the
private equity companies bring in new technologies and management practices that lead to
26
industry absorb the resulting spillovers, we should observe a positive impact on industry
prospects. Whether one should be concerned about reverse causality or not depends on if
private equity capital invested is related to the past values of industry performance variables
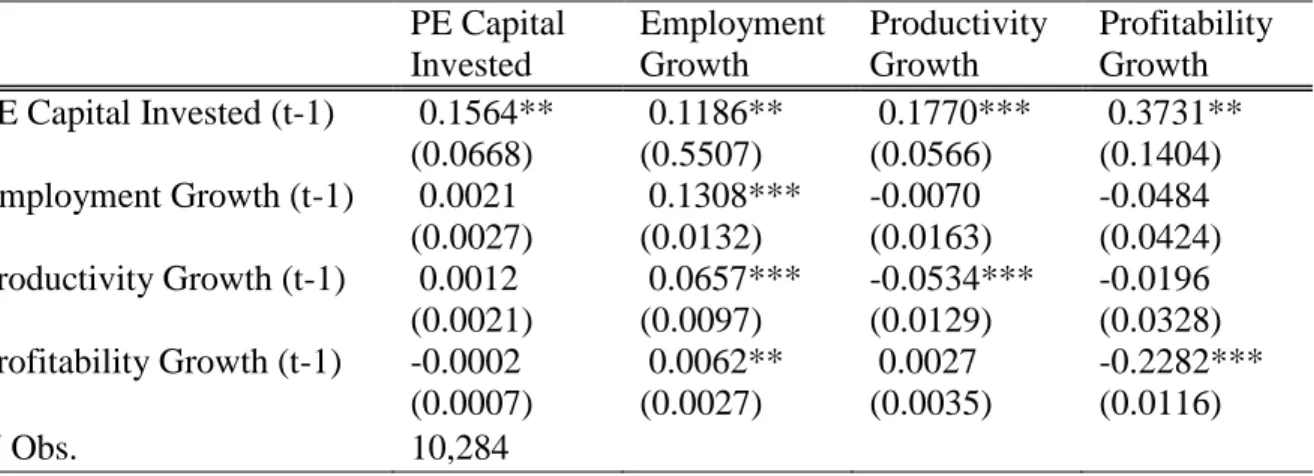
or not.23 Table 5 presents the results of the panel VAR estimation. The coefficients are from
the system GMM estimation where all the variables at time t are regressed on their own lag
together with the lags of the other variables in the model.24 The first column shows how the
amount of private equity capital invested at time t is affected by employment growth,
profitability growth and productivity growth at time t-1. All the coefficients are statistically
insignificant with the exception of the variable's own lag, suggesting that private equity
capital invested is not affected by how the industry did a year ago in terms of employment,
profitability, and labor productivity growth, after controlling for the amount of capital
invested at time t-1 and removing country-industry, and time fixed effects. The significant
coefficient on the amount of private equity capital at time t-1 suggests that private equity
capital is persistent, which is not surprising given the fact that private equity investments are
typically completed in rounds.
The second column presents the results from the part of the estimation where the
dependent variable is employment growth. Employment growth at time t is significantly
affected by productivity growth, and profitability growth at time t-1. After an industry
23
Reverse causality might also be stemming from private equity companies' predictions about the industry prospects. However, the cross-sectional evidence presented in Section 5.4 is consistent with a causal effect of private equity on industry spillovers, while an explanation of superior foresight would not have the same cross-sectional predictions.
24 Although the paper provides results with a one-year lag VAR only, results do not change when estimating
27
experiences faster growth in profitability and higher productivity, it also grows faster in
terms of employment subsequently. The main variable of interest for the purpose of this
paper is private equity capital invested. It indeed also has a significant and positive
coefficient: industries that receive more private equity capital experience faster employment
growth following the investment. As there are country-industry fixed effects in the
estimation, any unobserved time-invariant heterogeneity is removed. Basically, this result
says that on average employment in a country-industry grows faster following a private
equity capital investment compared to the level of employment growth in the same
country-industry in a year with no or limited private equity investment. Recall that employment
growth is total employment growth of the public companies, which most likely do not
receive private equity investment, in the industry. As such, note that the effect being
measured is the spillover effect. As the private equity-backed companies become more
efficient, the other companies within the same industry are also forced to improve their
operations as well in order to be able to compete, and hence they create more jobs resulting
faster growth in industry-wide employment.
The third column shows how labor productivity changes following a private equity
investment into the industry controlling for changes in employment and profitability together
with the growth in labor productivity from the previous year. Lagged employment and
profitability growth are not statistically significant. The coefficient on the amount of private
equity capital invested, however, is again positive and significant at 1% showing that overall
industry productivity grows faster following the flow of private equity capital into a part of
the industry. So, not only employment, but also labor productivity grows faster subsequent to
28
private equity companies introduce practices and technologies that increase operational
efficiency of their portfolio companies, and these efficiency gains spill over within the whole
industry leading to higher productivity in the rest of the industry as well.
Lastly, I look at how profitability changes. While the second and third columns have
shown the positive impact of private equity on labor productivity and employment growth,
they did not provide any evidence about the cost effectiveness of these improvements in an
industry. The higher growth in labor productivity suggests an increase in sales, but does not
show that this increase in sales is captured by higher profits. For example, if sales per
employee increases because employees put more work hours and are therefore being
compensated more aggressively, or more sales are reached through the use of advanced
technologies that are very costly to implement; profits may deteriorate as a result, which in
turn may lead to lower firm values. As such, it is important to see how profitability changes
as a response to the private equity investment within the industry.
The fourth column presents these results. While neither lagged employment growth
nor lagged productivity growth are significant after removing fixed effects and controlling
for lagged profitability growth, the amount of private equity capital has again a positive and
statistically significant coefficient: after an industry receives private equity investment,
profitability grows faster in comparison to years with no or low private equity capital.25
25 One might be concerned that profit margins increase due to a reduction in sales as profitability is measured
29
This result indicates that the gains in productivity and growth in employment are also
reflected in profits.26
Overall, the results in Table 5 show that following private equity investments into an
industry, public companies within the same industry that do not receive investment
experience higher employment, productivity and profitability. These results suggest that after
some companies in an industry receive private equity investment and become more efficient,
other companies within the same industry are also forced to improve. This might be resulting
from the competitive pressure from the private-equity backed companies as well as from
copying of the best practices implemented by the private equity companies. Although not
perfect, the panel VAR method controls for reverse causality to the extent that private equity
companies make their decisions about investing in a particular industry based on what
happened in the industry in the past. Past industry performance is not related to the amount of
private equity capital invested into the industry suggesting a causal effect where private
equity investments lead to spillovers within industries.
One caveat should be noted about these results. Although I provide evidence for
overall gains across the public companies within an industry, there is no direct evidence on
firm-level performance. However, the reported results indicate that private equity
investments create positive externalities within an industry. As such, the gains at the rest of
the industry suggest that private-equity backing leads to efficiency gains at the target
26
30
company first, which then are also absorbed by the other companies within the same
industry. Hence, this is consistent with the existing literature that has shown that private
equity leads to performance gains at the target companies. Kaplan (1989) and recently Guo et
al. (2011) both have shown that profitability increases after buyouts. Furthermore,
Lichtenberg and Siegel (1990) and Davis et al. (2009) provided evidence for productivity
gains following buyouts. The higher growth in industry-level productivity and profitability
confirm the findings of the aforementioned studies.27 These findings also complement the
large body of studies that have provided evidence for positive spillovers from foreign owned
companies onto local industries (Blomstrom and Kokko, 1998). Given the increased share of
private equity investments when compared to FDI as shown in Figure 3, it is important for
policy makers to consider private equity investments as an alternative source of productivity
and technology spillovers. Additionally, spillover effects within an industry and how the
overall industry, rather than an individual company, fares from private equity investments
should be taken into account when assessing the impact of private equity on the real
economy, and making policy decisions about promoting or limiting private equity capital.
4.1.2 Buyout versus Venture Capital
While the previous section has shown that private equity capital leads to performance gains
within the industry it is invested in, it did not differentiate between the two main asset classes
of private equity, buyout and venture capital. A buyout transaction is where the private equity
27 The existing evidence on firm-level performance gains range from 10% to 40% depending on the study and
31
firm typically acquires a target firm by purchasing all of the outstanding equity, often with a
significant amount of debt financing. The typical buyout transaction is financed with 60 to
90% debt (Kaplan and Stromberg, 2009). Leveraged buyouts first appeared in early 1980s,
almost disappeared in 1990s, but then reemerged in mid-2000s. Although buyouts are
typically criticized for loading up the target companies with leverage, as well as cutting jobs
and capital expenditures in an attempt to cut costs and increase profits, the existing evidence
shows that they make their targets more efficient. Higher levels of debt, and better incentive
structures put pressure on the managers to perform better; and together with stronger
corporate governance, buyouts lead to efficiency gains.
On the other hand, a typical venture capital transaction is an investment into a young
and new company without acquiring majority control. Venture capital investments typically
provide financing for small businesses that otherwise cannot get financing due to high
informational asymmetries. As such, venture capital prevents young companies from having
to forgo positive investment opportunities. Additionally, venture capital investments are
typically associated with an increase in the target company's innovative potential by allowing
for more research and development investments. Kortum and Lerner (2000) provide evidence
that venture capital investments indeed spur innovation, and this result is replicated in many
other studies using U.S. and European data.28
Given the very different structures of these two transactions, they might also differ in
terms of their impact on industry dynamics. To explore if buyout and venture capital have
different impacts on industry dynamics, I repeat the panel VAR analysis from Table 5, but
separately for buyout and venture capital. Panel A and Panel B of Table 6 present the results
with buyout and venture capital, respectively. The results in Panel A indicate that the earlier
28
32
results about the impact of total private equity capital invested on industry employment and
profitability are replicated when using buyout capital only. So, buyout capital invested in an
industry leads to higher employment and profitability growth. I do not find any evidence in
line with the critics arguing that buyout transactions lead to job cuts, at least at the industry
level. As for productivity, I do not find evidence for faster growth after buyout transactions.
This suggests that buyout transactions lead to improvements in profitability through cutting
costs and financial engineering, but their impact on labor productivity is not significant.29
Panel B presents the results with venture capital. The first thing to note is that the coefficient
on lagged private equity is larger for venture capital suggesting that venture capital is more
persistent than buyout investments. The impact of venture capital invested on employment
growth and profitability growth is not statistically different from zero. So, unlike buyouts, I
do not find evidence for profitability gains or faster employment growth resulting from
venture capital investments into an industry. Industry-level labor productivity, on the other
hand, grows significantly faster following a venture capital investment. The finding that
profitability does not increase following venture capital investments, despite the significant
increase in productivity, might be due to costly investments in new technologies that lead to
higher innovation. The result that venture capital does not lead to higher employment might
be the result of a crowding out effect. Companies receiving venture capital create new
technologies, which initially might crowd out the existing businesses and lead to employment
declines. So, while new businesses are created, employment at existing businesses might
decline at the same time mitigating the positive effect on overall industry employment, at
least in a one-year window.
29 This could be interpreted as buyouts leading to higher profits by cutting costs, but not through increases in
33
Venture capitalists typically make investments into small companies that are very
research and development intensive and have high growth opportunities, but cannot get
financing through other means as they are small and young. In that sense, venture capital
investments are more aimed to eliminate financing constraints of the target companies.
Therefore, in the short-term there are no employment or profitability spillovers onto the rest
of the industry. Nonetheless, if venture capital leads to innovation and productivity
spillovers, it in the longer-term should also lead to higher profitability and employment
growth. In untabulated panel VAR's with 2- and 3-year lags I find that it is indeed the case.
The amount of venture capital invested at time t-2 and t-3 leads to higher employment
growth as well as higher profitability at time t. This supports the argument that venture
capital facilitates innovation of new technologies that lead to productivity spillovers, but are
not immediately reflected in higher profits or employment. However, in the longer-term both
profitability and employment grow faster following venture capital investments in an
industry.30
To summarize, while buyout investments can quickly lead to an increase in profits by
utilizing financial engineering skills, a longer time is needed for the increased productivity to
be reflected in higher profits and employment growth after venture capital investments. The
lack of significant productivity spillovers from buyouts suggests that the operational and
financial improvements introduced by private equity companies in buyout transactions are
more focused at reducing costs and increasing profits, but do not necessarily lead to higher
sales growth. The large impact of venture capital on productivity growth is consistent with
30
34
the existing evidence on venture capital that has shown a positive relationship between
venture capital and subsequent innovation (Kortum and Lerner, 2000; Mollica and Zingales,
2007). It is also consistent with the recent study of Gonzales-Uribe (2012), which shows that
venture capitalists spur innovation through a better diffusion of knowledge. Furthermore, the
larger effect on industry productivity might also be related to the absorptive capacity of the
industries receiving venture capital investment. Venture capital investments are made more
into high R&D industries, which are shown to better absorb spillovers due to higher levels of
technical knowledge and human capital in the FDI spillovers literature (Kogut and Chang,
1991).
4.1.3 Private Equity and Investment
Some of the existing studies have found that private equity companies lead to a reduction in
capital expenditures at the portfolio companies (Kaplan 1989). While this might cut costs and
increase profitability in the short-run, it raises concerns about future cash-flows being
sacrificed for short-term operational gains. While it is an important concern, studies looking
at stock market performance of private equity-backed companies that are taken public
provide evidence for superior returns, which indirectly suggests that long-run prospects are
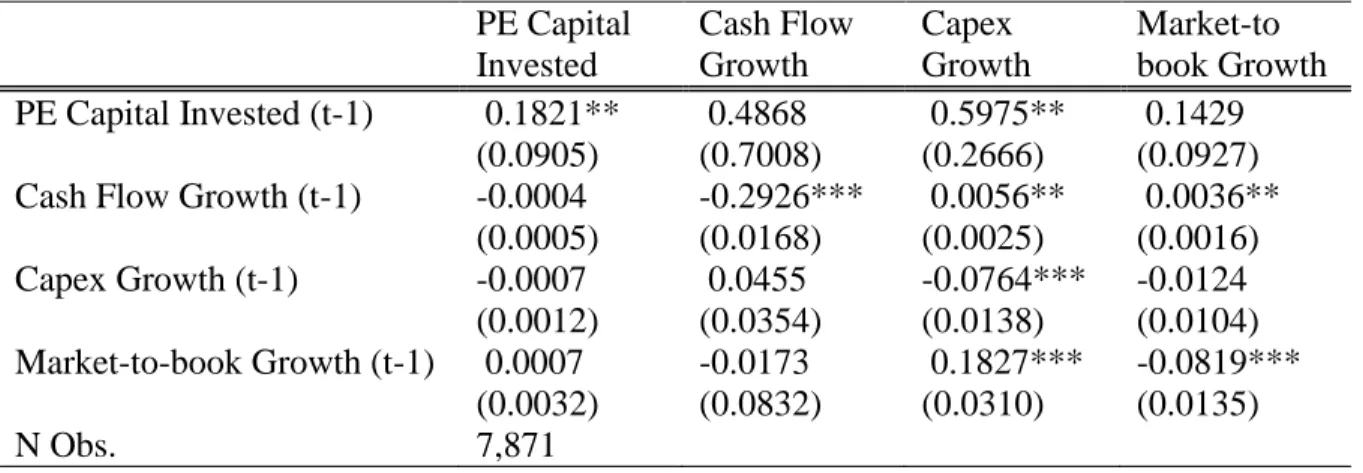
not hurt. In line with this argument, I estimate a panel VAR similar to Love and Zicchino
(2006) to examine how industry-level investment is affected by private equity. Indeed, I put
growth in free cash flow, growth in capital expenditures, growth in market-to-book, and the
private equity measure into the same system of equations to detect the dynamic relationship