IMPROVING EMERGENCY DEPARTMENT THROUGHPUT BY ADOPTION OF AN ADMISSIONS PREDICTOR TOOL AT TRIAGE
Benjamin Ovitt Linthicum
A project submitted to the faculty at the University of North Carolina at Chapel Hill in partial fulfillment of the requirements for the degree of Doctor of Nursing Practice in the School of
Nursing.
Chapel Hill 2018
Approved by:
© 2018
ABSTRACT
Benjamin Ovitt Linthicum: Improving Emergency Department Throughput by Adoption of an Admissions Predictor Tool at Triage
(Under the direction of Debbie Travers)
Emergency departments are increasingly busier and busier. An area of concern for many
hospitals is how to deal with the resulting overcrowding and related throughput problems. This is because delayed throughput is seen as a measure of quality due to its association with negative
patient outcomes.
In this quality improvement project I sought to use an admissions predictor tool at triage to improve emergency department throughput by changing the process by which patients are
identified and then processed for admissions. A new process was put into place where a patient who was predicted highly likely for admission by the predictor tool would have a bed requested
for them immediately after triage but prior to further emergency department evaluation. This would allow for parallel processing of emergency department evaluation during the inpatient bed assignment process.
A second goal for the project was to add to the collective evidence regarding the use of an admission predictor tool. This includes the practicality of its use as well as potential ways in
which the tool could be improved upon or otherwise used beyond the early bed request process. I found the admissions process to be much more complex than initially anticipated and due to this complexity only one patient out of 281 patients screened underwent the new early bed
identified. I found areas for improvement, of the admission predictor tool, namely the inclusion
of comorbidities.
I was able to find a new use for the predictor tool. By calculating an admissions
probability on all patients in the emergency department, not already identified for admission, the tool was used to predict bed needs for the whole department at one time. This aggregate
prediction tool can be useful in planning hospital operations to meet the bed needs of patients’
ACKNOWLEDGEMENTS
I would like to most especially thank my wife Kristin and my children Harper and Alex
for their support during this project and my studies. They have been very understanding of the time away from them I have spent.
I am sincerely grateful for the support of my chair and advisor Dr. Debbie Travers. She
has provided support, advice, knowledge, direction, and patience beyond what is expected. I truly am lucky to have worked with such a wonderful person and look forward to continued
collaboration in the future. I would also like to thank my other committee members, Dr. Sara Hubbell and Dr. Abhi Mehrotra for their attention to detail, perspectives, and most importantly their time.
This project would not have been possible without the support and championship of Joanne Lowry. As the lead medical admissions officer she is the go to person for so many
people; still she took a vast amount of time to show interest in this projects success. We spent countless hours together trying to make it work.
Lastly, I would like to thank all the members of the Friday afternoon Triage Research
Team. This is an incredibly talented group of people and represents they type of collaborative forward thinking team that should be emulated. This project is just a small piece of the
incredible work being done by this group. So special thanks to Drs. Nilay Argon, Tommy Bohrmann, Jeff Strickler, Rebecca Kitzmiller, Kenny Lopiano, Abhi Mehrotra, Debbie Travers, and Serhan Ziya, as well as fellow student members Wanyi Chen, Jackie Ring, Elaine James, and
TABLE OF CONTENTS
LIST OF TABLES ... x
LIST OF FIGURES ... xi
LIST OF ABBREVIATIONS ... xii
CHAPTER 1: INTRODUCTION ... 1
Problem Statement ... 1
Purpose of Project ... 2
Significance to Healthcare... 3
Review of Literature ... 3
Search Strategy... 3
Themes from Review of Literature ... 4
Theme 1: Admissions Predictor Tools or Methods ... 4
Theme 2: Issues Surrounding Emergency Department Throughput and the Impact of Boarding Patients ... 8
Theme 3: Implementation of an Admissions Predictor Tool ... 9
Summary of Review of Literature... 11
Theoretical Framework ... 11
CHAPTER 2: METHODS ... 18
Design ... 18
Setting and Resources ... 18
Study Population ... 19
Step 2: Initiating the Admissions Process ... 20
Data Collection and Evaluation ... 21
Step 1: Identifying Patients for Inclusion in Project ... 21
Step 2: Data Collection ... 21
Step 3: Qualitative Data Collection ... 22
Step 4: Data Analysis ... 22
PDSA Changes to Methods ... 23
CHAPTER 3: RESULTS ... 25
Description of Patients Screened ... 25
Description of Study Sample ... 26
Description of the APT in Practice ... 27
Description and Comparison of APT v.2 and v.3 in Patients with APT Score 70% or Greater ... 29
Description and Comparison APT v.2 and v.3 in of Patients with a Score of 85% or Greater ... 32
The BeRT Process ... 34
Aggregate Prediction Use of APT ... 34
User Experience with the Aggregate Prediction ... 35
Qualitative Data Theme 1: Use of the APT as a Tool to Control Patient Flow ... 35
Qualitative Data Theme 2: Using the Aggregate APT would Not be Helpful... 36
CHAPTER 4 DISCUSSION ... 37
What was Learned about Using the APT to Inform an Early Bed Request Process ... 38
Strengths of the Study and BeRT Process ... 39
Barriers to the Implementation of the BeRT Process ... 42
Solutions to Implementing BeRT Process ... 44
Additional Lessons Learned about the APT ... 44
New Aggregate Use of the APT ... 46
Limitations ... 47
Future Work ... 47
APT and BeRT Process ... 47
APT Improvements ... 48
Aggregate Predictions Using the APT ... 48
CHAPTER 5: CONCLUSIONS ... 50
APPENDIX 1: PRISMA 2009 FLOW DIAGRAM ... 51
Included ... 51
Eligibility ... 51
Screening ... 51
Identificantion ... 51
APPENDIX 2: STUDY SITE ED CORE MEASURES ... 52
APPENDIX 3: INFORMATION TABLE OF DATA GATHERED FOR PATIENTS ENROLLED IN STUDY ... 53
APPENDIX 4: QUALITATIVE INFORMATION REGARDING IMPLEMENTATION ... 54
APPENDIX 5: HYPOTHETICAL PRESENTATION OF AGGREGATE APT SCORE ... 55
APPENDIX 6: QUALITATIVE INFORMATION REGARDING THE AGGREGATE PREDICTION APT SCORE ... 56
APPENDIX 8: PATIENTS PREDICTED FOR ADMISSION BUT NOT
LIST OF TABLES
Table 1: Distribution of APT v.2 screening predictions ... 25
Table 2: Distribution of APT v.3 screening predictions ... 25
Table 3: Actual medical versus non–medical admissions ... 31
Table 4: Actual medical versus non–medical admissions ... 33
LIST OF FIGURES
Figure 1: Distribution of study sample age ... 26
Figure 2: Distribution of Study Sample ESI Categories ... 27
Figure 3: Distribution of ESI level for patient actually admitted ... 29
Figure 4: Distribution of ESI level for patient not admitted ... 29
Figure 5: Actual admission rates based on an APT v.2 threshold of 70% or greater ... 30
Figure 6: Actual admission rates based on an APT v.3 threshold of 70% or greater ... 31
Figure 7: Actual admission rates based on an APT v.2 threshold of 85% or greater ... 32
LIST OF ABBREVIATIONS
APT Admissions predictor tool
BeRT Bed request after triage CC Chief complaint
CICU Cardiac intensive care unit
CMI Case mix index
CMS Center for Medicare and Medicaid services
DNP Doctor of Nursing Practice DVT Deep vein thrombosis ED Emergency Department
EDWIN Early warning system for overcrowding in the emergency department FAM Family medicine service
FIFO First-in-first-out
EHR Electronic health record ESI Emergency Severity Index
ICU Intensive care unit
IHI Institute for Healthcare Improvement
LVAD Left ventricular assistive device MAO Medical admissions officer MDA Geriatrics medicine service
MDB Nephrology medicine service MDC Cardiology medicine service
MDH Hospitalist medicine service
MDI Intensive care medicine service MDU General medicine service
MDW General medicine service MED Observation medicine service
NEDOCS National emergency department overcrowding score
PDSA Plan-do-study-act PLC Patient logistics center
SRE Head and neck surgery service SRG Gastrointestinal surgery service
SRH Acute and trauma surgery service SRS Cardiac Surgery Service
STOR Statistics and Operations Research
UNC University of North Carolina
CHAPTER 1: INTRODUCTION
Problem Statement
Every year Emergency Departments (EDs) are busier and busier. The most recent national data available are from 2014, a year in which there were 141.4 million ED visits in the
United States, which was up from 136.3 million from 2011 (Centers for Diesase Control and Prevention, 2014; CDC&P, n.d.). This often results in overcrowding that has been linked to
numerous negative patient outcomes to include delayed interventions, poor satisfaction, and most importantly increased mortality (Johnson & Winkelman, 2011).
How to deal with this ever-increasing volume is a common challenge facing EDs
nationwide. Emergency departments strive to decrease the time it takes to process patients, or in other words, improve throughput. Throughput of patients is a marker of efficiency and is used as
a measure of quality of care coordination and patient engagement by the Centers for Medicaid and Medicare Services (Centers for Medicaid and Medicare Services, 2014). This makes improving throughput important not just an internal and patient centered goal, but also one
associated with regulation and reimbursement. Currently, The Joint Commission does not require measurement or reporting of specific ED throughput metrics, but does make certain
recommendations that patients wait no more than 4 hours in the ED after the decision to admit them has been made (Joint Commission, 2012, 2013). This is commonly known as boarding time. This is a wasteful time when patients occupy space in the ED without receiving services.
that boarding of admitted patients in the ED negatively impacts ED operations (Fogarty,
Saunders, & Cummins, 2014).
Exactly how to improve throughput remains a source of scholarly inquiry. Numerous
strategies have been attempted to improve throughput. They include operational changes such as immediate bedding of patients thereby bypassing triage or conversely placing a provider in triage, as well as interventions that focus on technology to improve registration and
communication (Wiler et al., 2010). There have also been attempts to improve flow by adding a nurse specifically to manage the flow of the ED (Murphy, Barth, Carlton, Gleason, & Cannon,
2014). These interventions have generally been successful at least to some degree, but tend to look more generally at all patients in the ED or flow within the ED. They do not focus on
admitted patients. This project was designed specifically to focus on improving throughput of admitted patients.
Purpose of Project
The purpose of this Doctor of Nursing Practice (DNP) scholarly project was to improve the throughput of the ED by utilizing a tool to predict which patients would be admitted based on
information collected at triage in order to start the inpatient bed request and admission team assignment as soon as possible. Currently, standard practice is the admitting process takes place
after patients have been evaluated by an ED provider, had diagnostics completed and have been determined by that provider to require admission. While sometimes this is a quick process, most often it can take hours. For the purposes of this project, it was assumed that using parallel
processes (ED evaluation, inpatient bed and admission team assignment) could expedite patients’ throughput in the emergency department. I sought to decrease non-value added time of patients
occupying an ED bed without receiving service, which was hypothesized to be a sizable
importance to the larger goal of this project which was to improve throughput not just for the
patients who receive early bed request, but for all patients in the ED (Krall, Guardiola, & Richman, 2016; Wiler, Bolandifar, Griffey, Poirier, & Olsen, 2013).
For this DNP project, a locally developed predictor tool was utilized using data specific to the population of the implementation site within the ED at the University of North Carolina Hospitals. The tool uses data specific to this site. The goal of this project was to improve ED
throughput on the local level and add to the collective evidence about the practicality and benefit of using such a tool and an early bed request process named Bed Request after Triage (BeRT).
Significance to Healthcare
If successful in improving throughput at the project site, this tool and process could have
served as a model for other EDs to follow. This strategy could provide an additional tool in the arsenal of ED operators interested in improving throughput.
Review of Literature
In order to inform this project and place it within the greater context of ED throughput
work a literature review was conducted. Search Strategy
PubMed was searched without limitations using the terms (flow OR throughput) AND (admission) AND (ED OR “emergency department”) with results of 538. After sorting these
results by relevance and then screening the abstracts, I found 15 articles clearly related to this problem and more specifically examples of several attempts to implement admissions prediction tools at triage in order to mitigate the problem (Bradman, Borland, & Pascoe, 2014; Crilly et al.,
predicting admission or alternative strategies for dealing with boarding times. Articles were not
excluded based on age but all were published within the past 10 years. Similarly, size of the institution was not considered with regards to exclusion or inclusion of articles. Those 15 found
to be most applicable to this project are included in this review of literature and are subdivided into the themes. Appendix 1 is a PRISMA flow diagram describing this process.
Themes from Review of Literature
Several themes applicable to this particular project begin to develop as the literate surrounding the subject was examined. Themes included: the relationship between boarding of
admitted patients in the ED and crowding, the development of some sort of admissions predictor, the way in which these predictors where implemented, and issues surrounding poor ED
throughput and impact of boarding patients.
Theme 1: Admissions Predictor Tools or Methods
In the literature there appears to be very limited attempts to develop a way of predicting
admission outside the traditional method of ED provider opinion after diagnostic evaluation and testing. Perhaps this is because use of such a tool is only one way of attempting to reduce
overcrowding. Probably more likely is that developing such a tool is a very complicated undertaking.
The simplest version of predicting admission early in the ED visit is utilizing the opinion
of those involved in the ED visit. This includes the opinions of providers and nurses. Typically, the decision to admit a patient is done by the provider after the patient is examined and
Several studies have looked at using ED personnel to predict admission at triage
(Bradman et al., 2014; Stover-Baker, Stahlman, & Pollack, 2012; Vaghasiya, Murphy, O'Flynn, & Shetty, 2014). Nurses were found to predict admission with relatively good accuracy and in at
least one case outperform an admission predictor tool (Bradman et al., 2014). Still, there is concern for over-predicting admission when utilizing the strategy of ED provider opinion. Over prediction, or having too many false positives, is a potential problem of nurse opinion being used
to predict admissions (Stover-Baker et al., 2012). Likely when asked, nurses and others may try to predict admission more often than not in an effort to try to please the investigator. There may be some implicit bias in just asking the question, “Do you think this person will be admitted?” If
the case appears borderline to the nurse being asked the question, they may err on the side of saying, “yes.” The nurse may be motivated to capture all admissions and be willing to over
predict in order to do this. The nurse may prefer to over predict than under predict in an effort to appear more accurate as well in order to capture all potential patients. To the individual nurse
this makes sense, but from a systems standpoint the over prediction may lead to a breakdown in usefulness of predicting admissions. Too many false bed requests would simply create a further
throughput issue by adding additional strain on the admissions process.
One may ask if nurses in triage are the best-qualified group to predict admissions given that providers typically are the personnel within the ED who regularly make the admissions
decision. In fact, physicians do perform slightly better given the limited literature in this area (Vaghasiya et al., 2014). Registrars (Attending Physicians) and Consultants (Resident
area that nurses are primarily responsible for. If utilizing ED personnel opinion only, then nurses
would be a satisfactory method of doing so and this would not require a redistribution of
personnel resources. With regards to process change it is not clear if the health system would be
willing to change their processes based on triage nurse opinion alone, even if it is validated. For this reason, a validated standardized tool may provide more consistency to allow for such a process change.
Another way of predicting admission is to look simply at demographic data (Sun et al., 2011). This type of tool takes into account information already known about the patient at
arrival, particularly if the health system and medical record system includes complete patient information. This type of information would include age and ethnicity, and perhaps some
information about medical history. It would not include information related to the ED visit itself. It relies on information already known about the patient and does not gather any additional
information at the time of triage. For instance, this tool type does not differentiate between a
patient who is presenting to the ED for a stubbed toe or shortness of breath. There are several advantages to this type of tool. From an ease-of-use perspective, it does not require the gathering
of much information. From an operational perspective, it would allow prediction of admission as early as possible. As soon as the person registers in the ED a prediction could be made. It would not require any information gathering from triage. The concern with this type of tool is that it
may be too general and likely not intuitive for clinicians to use.
For a clinician, the expected way of predicting admission would include more than
the standard process of deciding admission. A study of admissions predictor data conducted at
the same site of this project attempted to identify predictors of admission for elderly patients, and found that certain chief complaints, Emergency Severity Index (ESI) level, and specific vital
signs were predictive of admission (LaMantia et al., 2010). ESI level is a 5 level system for expressing patient acuity with level 1 requiring immediate resuscitation through level 5 which are stable patients. Both demographic and clinical data were found to be helpful, as most
clinicians would expect. LaMantia and colleagues (2010) also utilized logistic regression to identify the predictors much in the same way the tool for this project’s admission tool was
developed. At least one other article has shown the advantage of using similar statistical models to develop predictor tools over expert opinion (Peck et al., 2012).
Ultimately, whatever the prediction method utilized for this type of project, it must be accurate yet not over predict admissions. The tool used for this particular project has been tested in a computer simulation and was shown to improve throughput (Riederer, 2016). The tool is
called the Admissions Predictor Tool (APT) and predicts admission utilizing data available at the completion of triage, including a mix of demographic data such as age, but also is tailored to
include information about the visit itself such as chief complaint (Travers et al., 2016). Specifically, the APT uses age, chief complaint, and ESI level to calculate a probability of admission based on past patient presentations with these same variables. The APT was
developed using all visits (N=65,503) at a tertiary care medical center ED during a one year period by a multidisciplinary team consisting of professionals with expertise in operations,
predicts 19 admissions per day from triage with only 1 false prediction. The tool has recently
undergone further pilot testing (Ring, 2018).
Theme 2: Issues Surrounding Emergency Department Throughput and the Impact of Boarding Patients
There are numerous issues surrounding throughput in the ED. The ED is a place of finite resources with a nearly limitless potential for input of patients. It has a finite capability not only to process patients but also to output those patients either by discharge or admission. This
project was specifically designed to impact ED throughput by more efficient use of the resource of time. There is a large amount of literature regarding ED throughput. A portion of it is
reviewed here as it relates to this project.
With regards to how poor throughput and its surrogate ED overcrowding relates to
patient care, it is of paramount importance to understand how crowding impacts patient
outcomes. One thorough review of the literature demonstrates quite well that ED overcrowding impacts several patient outcomes including patient satisfaction and more importantly mortality
(Johnson & Winkelman, 2011). This review examined 23 studies that looked at patient
outcomes and ED overcrowding. The authors grouped these outcomes into three themes. These
are delayed interventions, patient satisfaction, and mortality. Delays in interventions associated with increased overcrowding included pain control, antibiotic administration, EKGs, and percutaneous cardiac interventions. These delayed interventions cause, poor outcomes, real
suffering, and decreased quality of care. Patient satisfaction decreases with ED overcrowding based on this review. Most importantly, ED overcrowding was found to be associated with
This project addressed the throughput of admitted patients and does not specifically
intervene to address the throughput of discharged patients. Nationally, it is known that academic EDs tend to have more difficulty processing admitted patients (Horwitz, Green, Fau-Bradley, &
Bradley, 2010). This is likely because EDs have greater control of the discharging of patients, while admitting patients require more coordination with other hospital departments and
processes. Larger hospitals like academic centers have a greater number of departments and
teams within those departments. Within the UNC system this can be clearly demonstrated. UNC Rex, a community hospital in the system, has just one medicine team that admits patients
to inpatient floor beds, while UNCH proper has 13. Still, those admissions policies and
processes can be changed to decrease the length of stay for admitted patients (Kang, Nembhard,
Rafferty, & DeFlitch, 2014).
Although my project focused on admitted patients, it was thought that it might still impact the length of stay of discharged patients. There is a growing body of evidence that
demonstrates when admitted patients are boarded the length of stay for discharged patients also increases (Fogarty, Saunders, & Cummins, 2014; Kang et al., 2014). The reasoning is simple, if
there are admitted patients boarding in the ED this ties up ED resources caring for these patients and it does not allow the ED to process other patients. This project had a real potential to impact the throughput of not only the admitted patients it seeks to process more efficiently, but
discharged patients as well.
Theme 3: Implementation of an Admissions Predictor Tool
immediate bedding of patients/quick registration, advanced triage protocols, provider in triage, “fast track” service lines, and improved communication methods. However, the science of
implementation of these types of changes is not often reported in the literature as it relates to ED
overcrowding. Still, within the health sector there are numerous models for implementers and change agents to use, such as the Institute for Healthcare Improvement (IHI) Model for
Improvement (IHI, n.d.).
As reviewed in theme 1, there have been several attempts in the literature to develop ways of predicting admission. However, it appears there has been much less published on the
implementation, adoption, and subsequent impact of those tools. There is evidence that
implementing changes to admission processes can impact length of stay (Kang et al., 2014), but
this project was specifically looking at early identification of admitted patients in addition to process changes.
Process changes, combined with the use of the predictor tool would seem to improve
throughput but the limited information reported in the available literature is not clear. The two examples of the implementation of similar tools suggest that the tools may be helpful but data
collection seems to be one challenging issue of evaluating implementation (Peck et al., 2013). Similar to the issue of data collection is that given the multitude of factors that impact patient length of stay it is difficult to specifically attribute improvements in length of stay to the
predictor tool alone (Crilly et al., 2015).
Given the weakness of the information regarding how to implement and evaluate an
tool, it is a novel tool, different from previous attempts to predict admission. As a result, a large
portion of this project was about discovery of the best ways to utilize this particular tool. Summary of Review of Literature
There is ample evidence that ED length of stay for admitted patients can be impacted by thoughtful interventions and that the impact of these boarding patients will benefit other ED patients in terms of not only length of stay, but potentially also important patient outcomes such
as mortality. There have been attempts to predict admission at triage using various strategies. The tool used in this project is novel but similar to other tools. However, this tool was developed
specifically at the site of implementation and thereby it was thought increasing its chance of successful adoption. There is limited information on how to implement and measure the impact
of this type of admission predictor tool and this project will expand the scholastic knowledge regarding such future attempts at adoption. Overall, the literature on the subject was helpful in considering the ways in which to develop this project and consider its impact.
Theoretical Framework
With this project I aimed to decrease boarding time thereby improving ED efficiency, but
I predicted this change would also improve flow for all patients, not just those who have been admitted. I utilized portions of Queuing Theory to guide this project. Queuing theory is the
study of waiting in lines. It is the mathematical way of expressing this wait. This is a strategy that is supported in the literature and based on Queuing Theory principles (Kang, Nembhard, Rafferty, & DeFlitch, 2014).
Essential I of the Essentials of Doctoral Education for Advanced Nursing Practice focus on the scientific underpinnings of practice (American Association of Colleges of Nursing, 2006).
understand nursing knowledge but also incorporate knowledge from other disciplines in order to
positively impact patient care or patient care delivery systems. In the case of this DNP project, Queuing Theory comes from the sciences of Operations Research and Statistics. The Admission
Predictor Tool used in this project was developed with the aid of faculty and graduate students from the University of North Carolina at Chapel Hill Department of Statistics and Operations Research (STOR). This project truly pulled from multiple scientific traditions, including systems
engineering, operations research, and business/healthcare management.
Queuing Theory has been used in EDs but also other areas of healthcare with success. It
has been used in areas to improve efficiency as varied as pre-anesthesia areas (Zonderland, Boer, Boucherie, de Roode, & van Kleef, 2009) and inpatient pharmacies (Bahadori,
Mohammadnejhad, Ravangard, & Teymourzadeh, 2014). The project site, UNC ED, has been simulated using queuing simulation models in an attempt to better anticipate overcrowding (Ahalt, Argon, Ziya, Strickler, & Mehrotra, 2016). Even though it is not familiar to nursing, its
use has the propensity to greatly impact nursing and the systems in which nurses operate.
The application of a non-nursing theory to a DNP project is not novel but was an exciting
prospect. It certainly is in the spirit of Essential I of the Essentials of Doctoral Education for Advanced Nursing Practice. This project, although justifiably a DNP project in that it impacts delivery of patient care, could just as easily have been the project of a systems engineer, business
school graduate, or physician. It sought to impact a system not just an individual patient, yet the ultimate goal was improved patient care. Improving care and care environments using available
Queuing Theory serves a purpose in both defining the problem and guiding the
intervention of this project. In the case of this DNP project the two are intimately related. Defining the reasons for long waits in the ED and how to address the causes of those waits are
both described well in the terms of Queuing Theory.
Queuing Theory deals with the systems and processes of a queue. It was originally developed more than 100 years ago in order to help explain telephone switchboard operations at
a time when one had to wait for a telephone line when making a call (Bhat, 2010). This theory attempts to describe and predict the multifaceted issues surrounding queues. It is largely a
mathematical theory, however this theory has numerous applications from transmission of data over fiber optic cables, to vehicular traffic patterns, to waiting in line at an airline counter (Bhat,
2010). Essentially, wherever there is a process where things or people have to take turns,
Queuing Theory can be utilized. An ED with its multiple queues is perfect for application of the theory.
The theory can get very complicated but at its simplest core it is about how many people are waiting in a queue. Mathematically, the number of people waiting is equal to those who arrive minus those who have been processed over a given time. This is known as Little’s Law
(Bhat, 2010). It is a simple concept but important to a deeper understanding of the theory at work. What this mathematical concept means is that in a given system you have to either
decrease the number of arrivals or improve the processing capacity in order to avoid having people wait. The theory becomes more complicated as a more variables are introduced and there
order of arrival, known as first in first out (FIFO), is one method, however in some situations it is
more efficient to bundle patients together and processes them simultaneously (Bhat, 2010). The most basic way that Queuing Theory guided this DNP project is by use of Little’s
Law. There are only two essential variables that impact the number of patients waiting: 1) the number of people coming into the system and 2) the number of people leaving the system. Thus, ED crowding interventions address either patients arriving at the ED or being dispositioned from
the ED. Little’s Law addresses well the problem of long ED waits and boarding of admitted patients. The intervention of early identification of admitted patients is addressing specifically
the number of people leaving the system. The hypothesis is that this intervention will result in more rapid patient extrication from the system resulting in less people waiting at any given time. The limitation of Little’s Law is that it does not describe how to have people exit the system
quicker but it leaves the user of the Law free to decide upon the best option for the given situation.
Another way that Queuing Theory can be described is by use of the notation: A/B/s: (d/e)
A is the arrival pattern, B is the service-time distribution, s is the number of servers, d is
the maximum number who can be contained in the system at one time, and e is the queuing discipline (Lee, 1966). E or the queuing discipline is of particular interest to my project’s
intervention. This is where, in Queuing Theory, one must decide how you will process patients. In our daily lives we are used to first in first out (FIFO) lines. This is a how most queues operate
process patients. Rather, each system is different in terms of goals and processes, so the best
way for one system to operate may not be the best way for another.
In the ED, there is a degree of FIFO processing but for the most part EDs consider acuity
of patients when deciding on whom to process next. Sicker patients wait less time than less sick patients, e.g., a person having a heart attack waits less in the queue than a person with a sprained ankle. Only if two patients, both with sprained ankles, are waiting does FIFO processing occur.
However, for the admissions process the queuing discipline is different. Here patients are processed in a first-in first-out (FIFO) queue. This means that patients identified for admission
first are processed in order of identification. Given this FIFO process, early prediction of admission could result in less queuing time for admitted patients because their admissions
queuing time will be built into their ED service time, as opposed to occurring one after the other. Understanding what e represents in the queuing model allows for an understanding of how impacting it will impact patient waiting times and throughput.
Applying Queuing Theory, bottlenecks such as admission processes are viewed as large contributors to delays of a system. These are places in the system where there are a limited
number of servers (s) or limited number of patients who can be served at one time (d). Queuing Theory has been applied in studies that identify those bottlenecks and address them within the ED (Abujudeh, Vuong, & Baker, 2005). In development of the Admission Predictor Tool, the
team from STOR developed a model of the ED in order to predict admissions and test the impact of early admissions identification (Riederer, 2016). This type modeling is common in statistics
and operations research, and has been applied successfully in order to improve overall
different staff or changing processes in order to improve flow prior to actual implementation.
Multiple scenarios can be tested much quicker and without impacting patients or staff prior to any institutional change. They are a cost effective way of trialing changes to systems.
The model developed by the STOR team members predicted that if patients were identified for admission early and thereby processed quicker by the admissions team, then all patients in the ED would move through the system quicker (Riederer, 2016). Viewing this in the context of Little’s Law explains this phenomenon: increasing departures from the system results
in decreased waiting. This is also consistent with the A/B/s: (d/e) description of Queuing
Theory, whereby d is the number of people who can be contained in the system. If it is constant, as it is the ED at any given point, then decreasing this number can improve efficiency of they
system. Interestingly, in one study, a Queuing Theory based model was used to demonstrate that an ED would have to literally double its capacity to eliminate waits completely (Haghighinejad et al., 2016).
Queuing Theory anticipates that by impacting the queuing discipline this project will decrease wait times. This is what the Riederer (2016) model has done, but the real world is much
more complicated.
It would be virtually inconceivable to develop a project like this DNP project without considering Queuing Theory. Once one starts to consider waiting times, processing of patients,
or improving efficiency one is using Queuing Theory consciously or unconsciously. Quite literally, any intervention that could be attempted to improve ED throughput would be addressed
Beyond order, utilizing Queuing Theory makes the project easier to communicate with
other disciplines. The theory is used in Operations Research but also familiar to those who work in areas of business and management. Framing this project in a theory that has uses in multiple
CHAPTER 2: METHODS
Design
This project was designed as a quality improvement initiative. The purpose of this Doctor of Nursing Practice (DNP) scholarly project was to improve the throughput of the ED by
utilizing a tool to predict which patients would be admitted in order to start the inpatient bed request and admission team assignment as soon as possible as well as lay the groundwork for
future quality improvement changes with similar methods on a larger scale. This project focused on a limited implementation of a novel way to identify patients for admission and a process to expedite their bed assignment to the hospital. This new parallel processing of ED evaluation and
inpatient bed assignment/inpatient team assignment would occur for patients identified by the APT. The project was to trial the feasibility of this method of admission. Similar quality
improvement projects within this organization have been trialed on a limited basis for feasibility in much the same manner and have led to wholesale adoption once the trial has proven
successful. An example of this is a provider in triage model of patient care. This project utilized
data collection methods similar to other quality improvement projects with not necessarily a goal of statistical significance but rather a goal of seeing operational metric improvement.
Setting and Resources
The setting of this project was the ED of the University of North Carolina Hospitals
In addition to a high rate of admissions the setting of this project, UNCH struggles with
excessive boarding times. Based on available Medicare (2017) data the facility has a longer boarding time compared to local hospitals, including a nearby academic center that has a
comparable patient population, as well as compared to national averages. Appendix 2 includes details from Medicare; UNCH has a median boarding time of 237 minutes, while the nearby academic ED’s is 148 minutes and the national average is 131 minutes.
The resources required for this project included the bed request team, the admissions teams, and myself (a DNP student & nurse practitioner who practices in the UNCH ED). The
bed request team consists of the house supervisors and Bed Control. These individuals work in coordination with a medical admissions officer (MAO) who is a liaison between the ED and the
medicine admitting teams that consist of physicians and advanced practice providers.
The MAO, who is a nurse, receives information about an intended admission from either an ED provider or another provider such as a community physician and coordinates with the
medical teams to assign a particular team to the patient. The MAO then places a verbal order for the patient to be admitted to an inpatient bed or the admission team evaluates the patient and then
places the order. This then signals the bed request team to find the patient an appropriate bed. The location of the bed at UNCH is regionalized to a particular part of the hospital based on the particular inpatient team that will be caring for the patient. Once assigned a bed and after having
been seen by the admission team, the patient is transported to an inpatient unit. Study Population
The sample involved in this project was a convenience sample of patients who present to the ED with medical complaints during the project enrollment period. These were distinct
They did not include typical surgical patient problems such as trauma or injuries. The medical
teams at UNCH only covers adult patient so only adults (19 years old or greater) were included. Also not included in this project were patients who likely will need psychiatric evaluation such
as those presenting with chief complaints of suicidal ideation or hallucinations. Admission of this population has its own unique challenges and the APT was not developed to address prediction of these patients.
Procedures
This project was formulated using a two-step process. The first step was to identify those patients who the Admission Predictor Tool suggests a high probability of admission. The second step was to expedite the actual admissions process by initiating a bed request after triage (BeRT).
Step 1: Predict Admissions
I physically sat with the MAO in the ED one or two days per week over the two-month study period. The predictor tool was run using a laptop computer on all adult patients who present to the ED with medical complaint during this time frame. This was done using only data
located within the EHR and did not require any additional information or interaction with the patient. The tool utilized only data routinely collected in the triage and registration process. The
patients were initially considered predicted for admission if the tool indicated a 90% or greater probability of admission.
Step 2: Initiating the Admissions Process
Once a patient was identified as having a high probability of admission, the plan was to work with the MAO to initiate the admissions process, which we called Bed Request after Triage
(BeRT). Early identification of a high likelihood of admission without early initiating of this process would not likely positively improve patient flow. This initiation of admission required
inpatient team to care for the patient. This process required the knowledge of the MAO as the
various teams have different guidelines for which patients they admit. Further, there are restrictions placed on residents regarding the number of patients they can admit during a given
time period and the MAO helps to track this. Initially for this project we limited patient enrollment to two of the admissions teams, MDU (General Medicine) and MDA (Geriatrics Medicine). These two teams where chosen because Med U tends to have consistent attending
coverage by hospitalists who understand the admission process well and MDA services the elderly, who were more likely to be admitted based on the APT.
Data Collection and Evaluation
Step 1: Identifying Patients for Inclusion in Project
I initially included patients in this study who had a 90% or greater probability of
admission based on the APT. The admission probability was calculated by entering the patient’s chief complaint, age, and ESI level into the APT web application on a laptop computer at the conclusion of triage. I collected data on all medical patients with an APT score of 70% or
greater. These data were intended to be analyzed in order to inform potential future expansions of the APT and BeRT process.
Step 2: Data Collection
Data surrounding the admissions process and the impact on those quality metrics were of
particular importance for this project. Routinely UNCH ED gathers data regarding door-to-admission time. These data are collected on all patients who present to the ED and are admitted. These data are seen as a metric of the quality of timeliness of care received at the facility. Door
the standard process. See Appendix 3 for the data elements that were collected on all medicine
patients with an APT threshold 70% or greater. Step 3: Qualitative Data Collection
In addition to the time based data I also planned to gather impressions of those involved in the new process. I intended to collect qualitative data in the form of open-ended questions
from the MAO, bed control, and admission team providers as well as ED providers involved in the care of the patients who underwent the BeRT process. This includes ED resident and
attending physicians as well as MDA and MDU residents and attendings. This was to be collected after the trial period is over in order to gather general impressions of the process. Given that this project was a trial, the goal was to understand what went well and what could be
improved upon. These questions could have been used to help further improve the BeRT process if it were fully adopted after this project was completed. See Appendix 4 for a list of the
intended questions. A list of staff members, as listed above, involved in each patient who undergoes the BeRT process was to be maintained in order to identify those patients who can be surveyed after the trial period has ended. Completion of the survey was to be completely
voluntary.
Step 4: Data Analysis
After the quantitative and qualitative data had been gathered it was to be analyzed to better understand the impact of the APT and BeRT.
The quantitative data were to be analyzed to see if there were patterns that arose from the trial period that may have improved or hindered the process. For instance, the process may have
not to the 90% cut off yet still benefit from being included in a future implementation of this
process.
The qualitative surveys were planned to be analyzed to look for themes that may have
emerged. It may have been that the BeRT process was viewed favorably by one group but not another. Staff members may have had ideas for refinement. This qualitative data would be useful in improving the process and making a full-scale implementation successful.
PDSA Changes to Methods
In this project I applied a widely used healthcare quality improvement approach, the healthcare quality Plan-Do-Study-Act (PDSA) cycle (IHI, n.d). Each PDSA cycle includes intervention planning, implementation, and then evaluation. After being evaluated the
intervention may be continued as initially envisioned or if there is a possible improvement identified then the change is made and another cycle starts.
When this project was originally planned it was thought that the best use of the APT would be to identify individual patients highly likely to be admitted, and then initiate an expedited admissions process using the Bed Request after Triage (BeRT) process. The
successful implementation and evaluation of this process was conceived as a key part of the project and consistent with the goal of improving patient throughput in the ED. As a result, I
conducted several iterative cycle changes to the project methods in order to seek improved implementation of the BeRT process.
The first change was the addition of a revised version of the APT. The initial APT
planned for implementation was actually the second version of the APT or APT v.2. A third version of the APT or APT v.3 became available just as I started the implementation of my
site. APT v.2 has 69 chief complaints and is based data from 64,326 patient visits over 1 year.
APT v.3 has 385 chief complaints and is based data from 221,102 patient visits over 4 years. In this study I ran both versions of the APT on each patient, and collected data on study subjects if
either version meet or exceed the threshold of 70% admission probability.
The second and third changes occurred simultaneously. After 2 weeks of patient enrolment, there were no patients who were successfully processed with the BeRT methods. I
then made the decision to expand the inclusion criteria to include to all medicine services
including Family Medicine, not just MDU and MDA. The other change I made was to lower the
requirement for initiation of the BeRT process from a threshold of 90% to a threshold of 85% for either APT. This was intended to increase the potential number of patients who could undergo
the process.
The final PDSA cycle was undertaken because of continued lack of patients for whom I was able to initiate the BeRT process. This was a major change in which I focused on using the
APT on all current ED patients likely to be admitted, who had not yet been identified for admission. I computed an APT score for all patients with medical chief complaints currently in
the waiting room or in the process of ED evaluation the, and their predictive scores were averaged to produce an aggregate prediction score of future admissions. I developed a method to report out this aggregate prediction to the MAO, ED administrative staff, and ED attending
providers. A hypothetical sample of this table is presented in appendix 5. My goal was to evaluate whether this aggregate prediction of likely admissions was feasible and helpful in
CHAPTER 3: RESULTS
Description of Patients Screened
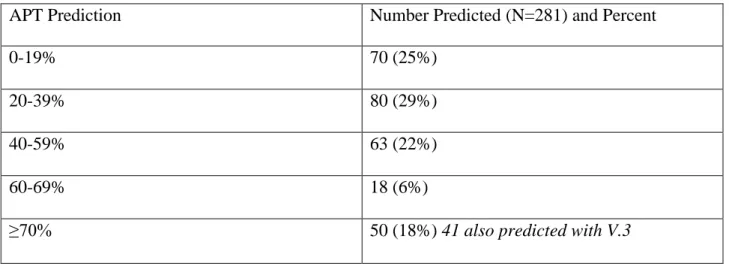
Between October 11, 2017 and December 15, 2017 a total 281 patients met inclusion criteria and were screened using both the APT v.2 and APT v.3. Table 1 and table 2 show the
distribution of those predictions for APT v.2 and APT v.3, respectively. Table 1: Distribution of APT v.2 screening predictions
APT Prediction Number Predicted (N=281) and Percent
0-19% 70 (25%)
20-39% 80 (29%)
40-59% 63 (22%)
60-69% 18 (6%)
≥70% 50 (18%) 41 also predicted with V.3
Table 2: Distribution of APT v.3 screening predictions
APT Prediction Number Predicted (N=281) and Percent
0-19% 83 (30%)
20-39% 88 (31%)
40-59% 45 (16%)
60-69% 14 (5%)
A total of 60 patients were predicted for admission at 70% or greater by at least one
version of the APT and included in this study. Of these, 41 were predicted with both versions, while the remaining 19 were predicted with only one version of the APT. Nine were predicted
for admission only by APT v.2 and 10 were solely predicted by APT v.3. Additional data were collected on the 60 included patients. These data included the APT score, age, chief complaint, significant event timestamps, admission team, and other information recorded in Appendix 3.
Description of Study Sample
Figure 1: Distribution of study sample age
The mean age of the 60 patients included in the study was 67.6 and the median age was
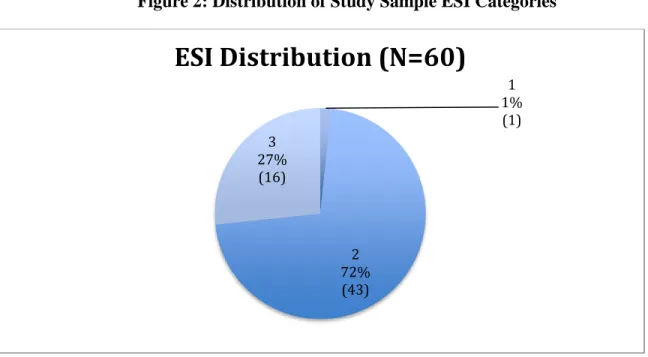
69.5. Figure 1 includes a bar graph of the ages of the study sample. Of these 60 patients, 27 were female and 33 were male. No patients with ESI level 4 or 5 were predicted for admission and included. Only patients with ESI level 1, 2, and 3 were predicted for admission. This
includes one patient who was level 1, 43 who where level 2, and 16 who where level 3. Figure 2 displays the distribution of the ESI levels.
0 5 10 15 20
20-29 30-39 40-49 50-59 60-69 70-79 80-89 90-99
Sa
mp
le
Size
Age Groups
Distribution of Age of Patients
Predicted >70% with APT
Figure 2: Distribution of Study Sample ESI Categories
Among patients predicted for admission, the most common chief complaint was shortness of breath (N=12), and chest pain (N=7) and weakness (N=6) where the second and third most
common chief complaints, respectively. Of the patients admitted the most common admitting service was the MED team (N=8) that manages patients in the Observation Unit.
Description of the APT in Practice
Of the 60 patients predicted for admission a total of 48 were actually admitted. Their sex,
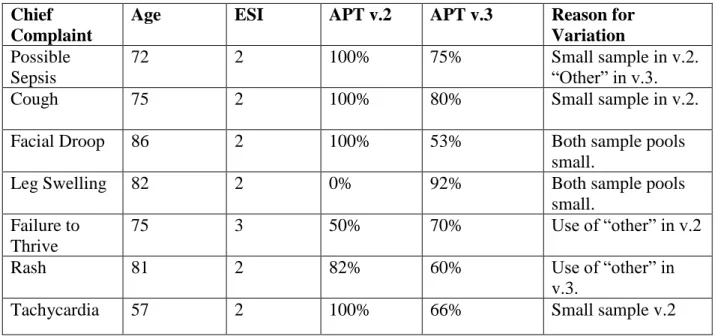
age, presenting chief complaint, ESI level, APT scores, admitting diagnoses, and admitting team are provided in appendix 7. Several participants had high APT scores up to and including 100%,
but those scores were based on small samples (<10). If the prediction was based on a small sample size then the patient did not undergo the BeRT process because of concerns regarding the reliability of the prediction.
The admitting diagnoses and the presenting chief complaints were similar for many of the 60 patients. The admitting diagnoses often were the exact same as the presenting chief
complaint. For instance, participant 116 presented with hemoptysis (a cough that produces 1
1% (1)
2 72% (43) 3
27% (16)
blood) and was admitted with the exact same diagnoses. For other participants the admitting
diagnosis could reasonably be inferred from the chief complaint. Participants 104 and 125 both had chief complaints of leg swelling and their admitting diagnosis was deep vein
thrombosis or DVT (blood clot in the leg).
Appendix 8 includes the sex, age, chief complain, ESI level, APT score, final diagnoses, and miscellaneous information for those patients who were predicted for admission but not
admitted. Participant 205 eloped from the ED prior to his evaluation being completed so it is possible he could have been recommended for admission. Participant 210 who was ill with
active cancer and complications from it was seriously considered for admission but was not ultimately admitted after shared decision making with him, his family, his oncology team, and
the ED team. Participant 203 was evaluated by the Family Medicine team for admission but ultimately discharged.
The APT scores of the patients who were admitted and those that were not admitted were
similar. Both groups were primarily in the 70s-80s%. The average APT score for patients who were admitted was 78% and the average APT score for those not admitted was 75%. The
admitted patients tended have a higher probability for admission based on APT v.2 than APT v.3 with 27 (56%) having a higher prediction based on APT v.2. The opposite was true for patient not actually admitted. Of those not admitted 7 (58%) had a higher APT v.3 score.
One notable difference that can be found between these groups was the triage category. The group that was actually admitted had a lower rate of triage 3 level patients compared to the
Figure 3: Distribution of ESI level for patient actually admitted
Figure 4: Distribution of ESI level for patient not admitted
Description and Comparison of APT v.2 and v.3 in Patients with APT Score 70% or Greater
The sample size each version of the APT uses as a basis to make a prediction is different. APT v.2 is based on 1 year of data while APT v.3 is based on 4 years of data. Also, the chief
complaints of APT v.3 are more inclusive leading to less use of the category “other” to describe 1
2%
2 77% 3
21%
ESI Distribution (N=48)
1 0%
2 50% 3
50%
the chief complaint. APT v.2 uses 69 chief complaints including a category “other” and APT v.3
uses 385. Due to these differences, some patients were predicted for admission with one version of the APT but not the other. Of the 60 patients included in this study as having being predicted
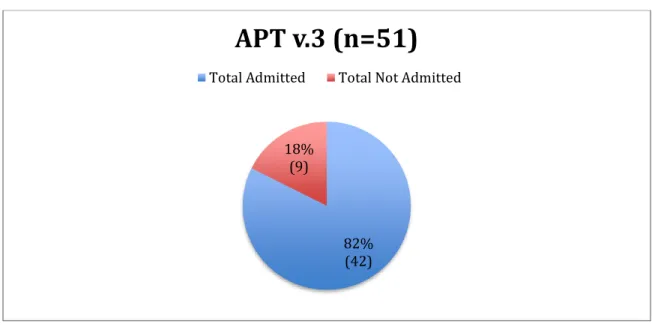
for admission 41 were predicted at 70% or greater by both versions of the APT. The remaining 19 were predicted by only one version of the APT. There were 50 patients with an APT v.2 score of 70% or greater and 51 patients with and APT v.3 score of 70% or greater. Using an APT
threshold of 70 % as a minimum for inclusion resulted in higher actual admission rates than 70%. The APT v.2 prediction resulted in an actual admission rate of 78% (figure 3), and APT v.3
resulted in an actual admission rate of 82% (figure 4).
Figure 5: Actual admission rates based on an APT v.2 threshold of 70% or greater
78% (39) 22%
(11)
Figure 6: Actual admission rates based on an APT v.3 threshold of 70% or greater
Both versions of the APT identified both floor and ICU admissions. The percent of patients identified for admission who were admitted to the ICU was slightly higher in the APT
v.2 group. The APT v.2 flagged patients had a 21% rate of ICU admission whereas the APT v.3 group had a 17% rate of ICU admission.
With regards to my ability to identify potential medical admissions based on triage data,
using both APTs there were several patients who did not get admitted to a medical service. This was more common with APT v.3. This was 14% of the patients for APT v.3 and 5% of the
patients for APT v.2. The table 3 surmises this information.
Table 3: Actual medical versus non–medical admissions
70% Threshold Meeting APT v.2 Meeting APT v.3
Total Admitted 39 42
Medical Admit 37 36
Non-Medical Admit 2 6
82% (42) 18%
(9)
Description and Comparison APT v.2 and v.3 in of Patients with a Score of 85% or Greater
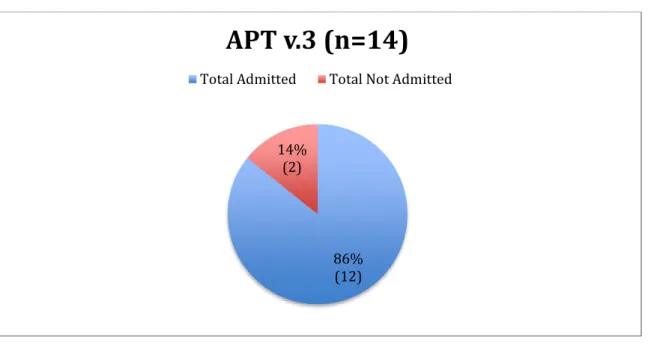
APT v.2 identified more patients as having a score 85% or greater than APT v.3. A total
of 24 patients were identified using APT v.2 and 14 with APT v.3. As with the 70% threshold, using an 85% score as a minimum for inclusion resulted in higher actual admission rates, albeit to a lesser extent. For APT v.2 87% of the patients were admitted and for APT 86% of the
patients were admitted. See figures 7 and 8
Figure 7: Actual admission rates based on an APT v.2 threshold of 85% or greater
87% (21) 13%
(3)
Figure 8: Actual admission rates based on an APT v.3 threshold of 85% or greater
With regards to the percentage of ICU admissions, using the threshold of 85% both versions of the APT had a higher rate of ICU admissions than at the 70% threshold. Using APT
v.2 24 % of the predicted admissions went to the ICU and with APT v.3 25% went to the ICU. My ability to identify medical admission based on triage data was greater using the 85%
threshold than 70%. The total numbers of patients was smaller but with APT v.2 only 2 patients were not admitted to a medical service and with the APT v.3 version, all patients were admitted to a medical service. See the Table 4.
Table 4: Actual medical versus non–medical admissions
85% Threshold Meeting APT v.2 Meeting APT v.3
Total Admitted 21 12
Medical Admit 19 12
Non Medical Admit 2 0
86% (12) 14%
(2)
The BeRT Process
The sole patient to undergo a modified BeRT was a 67-year-old male with a chief
complaint of chest pain and an ESI category of 2. This patient had an APT v.2 score of 86% and an APT v.3 score of 75%. He presented to the ED at 12:37. The MAO agreed that he would likely be admitted and most importantly, because he had a Left Ventricle Assistive Device
(LVAD), he could only be assigned to the cardiology heart failure (MDD) team. He was identified by the APT at 13:04 but the patient did not get an actually bed request until 14:01
because the inpatient team came to evaluate the patient at 13:34 and wanted to place the order themselves. His inpatient bed was assigned at 18:20, and then he was changed to a different in patient bed at 20:40. He did not end up leaving the ED until 21:39 for a total ED length of stay
of 9 hours 2 minutes or 542 minutes. His boarding time after bed request was 7 hours 31 minutes or 459 minutes. This compares to an overall mean boarding time of 371 minutes for all
medicine services this day but shorter than the mean boarding time for the MDD service itself that same day of 526 minutes.
Aggregate Prediction Use of APT
In consultation with my doctoral committee, I added an aggregate prediction of ED
admissions calculation starting on November 9, 2017. On 15 separate occasions between November 8 and December 15 I calculated an APT v.3 score on all patients in the ED with a medical complaint who had not yet had a disposition decision (admit or discharged). I then
calculated an aggregate prediction admission score for these patients by multiplying the average admission probability for patients by the total number of patients. The number reflected the
This information was combined with other data available to the MAO and physician including
bed availability and expected transfers to the hospital.
I present an example of the aggregate prediction ED admission score here. At 1500 on
December 7 the ED had a census of 73 patients with 20 patients that had been identified by the ED providers as needing admission and were awaiting inpatient beds. The NEDOCS score was 200. This is the validated measure of ED overcrowding with a maximum score of 200. The
hospital had 1 available Medical ICU bed, 1 available Medical Step down bed, and no available Medical floor beds. The APT predicted that another 6.29 patients currently in process in the ED
would also require admission. This information reinforced the hospital’s decision to remain of ED to ED transfer diversion given that the ED overcrowding was expected to worsen based on
the aggregate prediction I provided.
User Experience with the Aggregate Prediction
I was not able to collect qualitative data about the experience with the BeRT process as planned, because there was only one patient who underwent the BeRT process. However, I did collect qualitative data from eight ED attending physicians and two MAOs regarding the
aggregate prediction use of the APT. These qualitative data were analyzed and grouped into two themes.
Qualitative Data Theme 1: Use of the APT as a Tool to Control Patient Flow
The lead MAO in particular felt there was value in aggregate prediction use of the APT.
She said of the tool and its aggregate prediction use, “This is where your tool could be really useful. I could see it being used as part of the PLC (Patient Logistics Center) in bed planning.”
Some of the junior attending physicians echoed this as well. One said, “As a new attending, having the most information I can about our capacity is really helpful.” Another said
she would like to see this predictive tool integrated into the EHR. The same attending thought it
could be useful to have the score displayed in the EHR and there be an agreed upon threshold for the ED to stop accepting transfers from outside hospitals. The current method for this is for the attending to call the administrator on call from the hospital and obtain permission to stop
accepting transfers.
Qualitative Data Theme 2: Using the Aggregate APT would Not be Helpful
Converse to the opinions of the previous theme, some attending physicians were not as enthusiastic having and aggregate prediction of patients expected to be admitted. One attending
in particular, with > 25 years experience, expressed hesitancy to use the tool in this way saying, “I just accept everyone (transfers) and figure that we can just sort it out later.” He felt that the
ED and the hospital where in a state of constant capacity strain and that one tool would not make any significant improvement to a system that was so strained. Another attending, with about 10 years experience expressed some concern that the aggregate use of the APT would not capture
CHAPTER 4 DISCUSSION
Through this project, I added to the evidence about the use of the APT on actual patients
in the ED, including the practical aspects of APT implementation. While previous studies have addressed prediction of admission for possible future use (Barak-Corren, Fine, & Reis, 2017; Barak-Corren, Israelit, & Reis, 2017; Bradman et al., 2014; Stover-Baker, Stahlman, & Pollack,
2012; Vaghasiya, Murphy, O'Flynn, & Shetty, 2014), none of these studies sought to make use of this prediction for actual operations. In this project I translated evidence into practice by
acting on this prediction through an early bed request process and subsequently by an aggregate prediction of future inpatient bed needs.
The purpose of this study was to improve the throughput of the ED by investigating the
feasibility of using the APT at triage to identify patients likely to be admitted to expedite ED throughput through the use of a BeRT process. The goals were to positively impact patient flow
and to lay the groundwork for future implementation of APT and BeRT process.
I was only able to directly improve throughput for the one patient who underwent the BeRT process. This patient had an approximately 30 minute shorter ED stay than other patients
admitted to the same service that particular day. However, by using the aggregate prediction of admission I was further able to impact the throughput of patients by reinforcing the hospitals
decision to remain on diversion during times of ED overcrowding thereby allowing the hospital to focus on throughput of patients currently in the ED.
Academic EDs tend to have more difficulty processing admitted patients (Horwitz,
which is reflected in a scoring system developed by CMS. To address the varying complexity of
patients address different hospitals, CMS (n.d.) calculates a score called the Case Mix Index (CMI) in order to normalize the different outcomes of patient care that occurs between different
hospitals. Although the CMI is designed to address payment, the variation of different CMI scores could be used to understand the higher levels of complex processes that occur within academic centers. The study sites’ CMI is the second highest in the local area and only lower
than another local academic medical center. See appendix 9 for local CMI data. The complicated admitting process at the study site proved to greatly limit this project’s goal of
impacting patient flow. Yet the study was able to meet its goal of laying the groundwork for future implementation plans.
What was Learned about Using the APT to Inform an Early Bed Request Process
Only one of the 60 patients predicted for admission actually underwent the BeRT
process. Even for this patient it was a modified BeRT process. Three patients were excluded from the BeRT process because even though they had a high APT score, their admission
prediction was based on a small number of patients and the MAO and I did not feel confident in
using the APT to initiate the BeRT process. For example, a 75-year-old female with a cough had an APT v.2 score of 100%. However, this prediction was based on only a total of 3 patients.
The smaller patient samples were all predictions made using APT v.2.
Another sever patients were excluded from the BeRT process who had a high enough APT score but there was uncertainty about the level of care the patient would require. At the
time of the APT calculation for these patients, the MAO was concerned that the patient may or may not require an ICU bed, thus making an early bed request not feasible without the
chief complaint of hypotension. The patient did not undergo the BeRT process because it was
felt that her blood pressure was so low that she could require advanced medical care only available in the ICU. However, after fluid resuscitation in the ED, she stabilized and was
admitted to a floor bed on the Oncology (MDE) service.
Beyond what level of care a patient may or may not need, uncertainty about which admission team would care for the patient resulted in other patients not undergoing the BeRT
process. At UNCH the various medical teams are regionalized, and in order to place a bed request the patient must have a known team. Regionalization is locating all the patients of a
particular service in a particular area. For example, in order to be assigned to a 4th floor bed a patient must be either on a pulmonary service or an infectious disease service. On six separate
occasions patients had a chief complaint of chest pain (or angina) and had an APT v.2 score of 86%. Because the results of testing performed in the ED helps guide the medicine team assignment, five of these patients did not undergo the BeRT process. Testing may include
cardiac enzymes that help to determine if a patient has had a myocardial infarction or not. By convention, at the study site patients with a confirmed heart problem are admitted to the
cardiology team whereas patients who have a suspected but not confirmed heart problem are admitted to another medical team. In the end, two of these patients were discharged from the ED; two where assigned to the medicine observations unit, one was admitted to the cardiology team,
and the final one was the patient who did undergo the BeRT process. Strengths of the Study and BeRT Process
The major strength of this project and the implementation of the BeRT process was the presence and buy-in of the MAO team. They proved to advocates for advancing the idea of the