A STATISTICAL TEST OF CULTURAL HETEROGENEITY
Autumn McClellan
A thesis submitted to the faculty of the University of North Carolina at Chapel Hill in partial fulfillment of the requirements for the degree of Masters in the Department of Sociology.
Chapel Hill 2012
Approved By:
Judith Blau
Ted Mouw
ii
ABSTRACT
AUTUMN MCCLELLAN: A Statistical Test of Cultural Heterogeneity (Under the direction of Judith Blau)
David Harding’s theory of cultural heterogeneity (2010) seeks to amend existing
theories of neighborhood mechanisms, such as social isolation and social organization theories,
by (re)introducing a cognitive view of culture that allows for individual agency, divergent
outcomes, and influence of conventional or mainstream cultural models. Constructed based on
interviews, Harding’s theory of cultural heterogeneity has yet to be tested using quantitative
methods. After operationalizing cultural heterogeneity, I use nationally representative data from
the National Longitudinal Study of Adolescent Health and multilevel mixed-effects logistic
regression to test the effect of cultural heterogeneity on the probability of graduating high
school, a common measure of educational attainment. My results suggest that cultural
heterogeneity does have an effect on educational attainment, but not in the direction specified
by Harding’s theory. Further research is needed to conceptually clarify cultural heterogeneity in
iii
TABLE OF CONTENTS
LIST OF TABLES iv
LIST OF GRAPHS v
Chapter
I. INTRODUCTION 1
II. LITERATURE REVIEW 4
Neighborhood Effects 4
Peer Effects 10
Hypotheses 12
Influences on Educational Aspirations and Attainment 13
III. DATA AND METHODS 16
Variables 16
Operationalizing Cultural Heterogeneity 18
Model Specification 18
Iv. ANALYSIS AND RESULTS 20
School-Level Analysis 21
Individual-Level Analysis 21
V. DISCUSSION AND CONCLUSIONS 24
APPENDIX 27
iv
LIST OF TABLES
Table
1. Neighborhood SES Construction 27
2. College Aspirations by Neighborhood Disadvantage 27
3. Summary Statistics 28
4. Correlation of Means and Standard Deviations of Respondents’ Peers’ Aspirations 28
5. Aggregate OLS Regression of HS Graduation Status 28
6. Odds Ratios of College Aspirations 29
7. Odds Ratios of College Aspirations, Sample Limited to
“Mean of Peer College Want” < 4.5 30
8. Odds Ratios of College Aspirations, Sample Limited to
“Mean of Peer College Want” < 4.3 31
9. Odds Ratios of HS Graduation Status 32
10. Odds Ratios of HS Graduation Status, Sample Limited to
“Mean of Peer College Want” < 4.5 33
11. Odds Ratios of HS Graduation Status, Sample Limited to
v
LIST OF GRAPHS
Graphs
1. Scatterplot of Mean and Standard Deviation of Peer Aspirations,
I. Introduction
Many theories have sought to explain how neighborhood context exerts an effect on
educational attainment. Prominent explanations include social isolation theory (Wilson 1987) –
wherein residents of neighborhoods characterized by high concentrations of poverty and male
joblessness (Wilson 1996) develop cultural repertoires that differ from those of the middle-class
or mainstream societies from which they are isolated – and social disorganization theory (Park
and Burgess 1925), which describes how neighborhood fragmentation and instability lead to
difficulties establishing and maintaining order. These theories often lead to characterizations of
poor neighborhoods as dominated by deviance or subcultures. While youth in poor
neighborhoods are undoubtedly exposed to models of social and criminal deviance, and
probably encounter these models much more frequently than their more affluent counterparts,
these cases do not typify residents of poor neighborhoods. Furthermore, residents of poor
neighborhoods are exposed nonetheless to mainstream or conventional ideas, which have
considerable influence on residents’ lives.
Drawing on a cognitive view of culture, David Harding’s theory of “cultural heterogeneity”
(2010) contends that there are various cultural models, including contradictory or overlapping
models, present in any social context from which an individual may draw upon. By recognizing
that individuals from the same neighborhood could call upon any number of available scripts in
a given situation, the cognitive view of culture accounts for the role of agency, which in turn
may lead to divergent behaviors and divergent outcomes. Harding claims that poor
neighborhoods are more likely to experience cultural heterogeneity, or “the presence of a
2
It is important to recognize that cultural heterogeneity may occur in a variety of domains,
and cultural heterogeneity itself is not necessarily hazardous. For example, a more affluent
neighborhood may offer social support for a diversity of religions and many would agree that
cultural heterogeneity in this domain is beneficial for residents. Cultural heterogeneity matters
when 1) cultural models are truly contradictory, not just diverse, 2) when various competing
models receive social support, and 3) when different models actually lead to different pathways
(Harding 2010). Thus, in the domain of education, cultural heterogeneity not only matters, but
can have serious negative consequences for residents.
Because culturally heterogeneous neighborhoods recognize a greater number of paths as
acceptable, there is less available information about any one path. As the number of socially
supported models increases, there will be fewer individuals who have taken any one path
(Harding 2010). This in turn leads to fewer examples of how to achieve success in each model.
Problems relating to the knowledge of cultural models, or dilution, are evident in an educational
context:
For example, college enrollment requirements and admission and financial-aid
procedures will be more difficult to figure out when fewer neighbors have
previously successfully completed the process. Those who want to follow a
script for college attendance and know the broad contours of that script will be
less likely to know in detail the actions required to successfully realize the script
(Harding 2010, p. 157).
With more cultural models to navigate, adolescents may become overwhelmed or
confused by the information they receive. Additionally, those from disadvantaged
neighborhoods suffer from smaller social networks and lower quality networks that provide
3
reliable information even if they reach out to their social networks to make sense of their
educational situation.
Contrary to Harding’s argument, cultural heterogeneity could be beneficial, even in
domains in which cultural heterogeneity is said to matter, like education and romantic
relationships. Neighbors can also serve as role models of what not to do (Newman 1999, as cited
by Harding 2009). With various socially supported pathways, youth have access to not only what
the pathways are, but also what the consequences of choosing these various pathways may be.
While there may be local support for a particular cultural model, youth have access to
mainstream paradigms and can compare what is locally available with what is more widely
accepted. It could be the case that cultural heterogeneity has no effect on educational
aspirations, or even boosts aspirations as youth strive to be successful in a discordant
environment.
The purpose of this research is to investigate Harding’s claim that cultural heterogeneity
can have negative consequences in the domain of education. As Harding’s theory was generated
based on interview data with sixty (60) adolescent boys, there exists no quantitative analysis to
support his claims. Using the National Longitudinal Study of Adolescent Health, I construct an
operational definition of cultural heterogeneity and use logistic regression and multilevel
mixed-effects models to predict the odds of graduating high school. I conclude with a discussion of
Harding’s conceptualization and offer possible approaches for future data collection and
II. Literature Review
The concept of cultural heterogeneity is a recent addition to the neighborhood effects
literature, which broadly contends that the characteristics of where one lives can have an
impact on opportunities and achievement, net of personal and family characteristics. I will also
review the literature on peer effects, which emphasizes the influence of those with similar social
standing on an individual’s own attainment, as the basis for a counterargument to the way in
which cultural heterogeneity affects educational aspirations and attainment. Aspirations and
attainment are key variables of interest for both neighborhood and peer effects scholars. I will
review some traditional theories of neighborhood effects and describe how Harding’s theory of
cultural heterogeneity is situated within the body of literature. Then, I will use the work of peer
effects scholars to formulate a counterargument of the way in which cultural heterogeneity
operates as a mechanism. Finally, I will explore the variables that are considered important
predictors of educational aspirations and attainment in both literatures.
Neighborhood Effects
Many theories have sought to explain how neighborhood context exerts an effect on
educational attainment, including the collective socialization perspective, social isolation theory,
and social disorganization theory; these theories hypothesize that low neighborhood SES has an
effect on educational attainment beyond the effects of individual- and family-level
characteristics.
The norms and values that children are exposed to lead to aspirations and behaviors;
5
interactions with non-parental adults from their neighborhood (Brooks-Gunn et al. 1997, Lynn
and McGeary 1990, Crowder and South 2003). Therefore, youth living in neighborhoods
characterized by poverty, low educational attainment, and joblessness will be less likely to gain
employment and complete school themselves (Crowder and South 2003). Harding’s theory of
cultural heterogeneity considers these interactions to be the source of cultural models. Cultural
models can come from direct interaction with and observation of family members, friends, and
non-family adults, such as teachers and neighbors (Harding 2010, p. 146).
However, Harding’s theory stands in opposition to another prominent theory in the
literature – social isolation theory. Poor neighborhoods are not devoid of mainstream values as
social isolation theory suggests, but rather mainstream and deviant values coexist under the
cultural heterogeneity framework. While examining the residential inequalities of white and
black Americans in the inner-city, William Julius Wilson (1987) concluded that black Americans
were more likely to live in areas of concentrated poverty, which become abandoned by working-
and middle-class residents (Wilson 1996), thus creating a neighborhood abandoned of
conventional norms and values, or a community that is “socially isolated.” Wilson (1987) defines
social isolation as "the lack of contact or of sustained interaction with individuals and
institutions that represent mainstream society" (p. 60). Residents in these isolated
neighborhoods are said to establish their own norms and values; “… in a neighborhood with a
paucity of regularly employed families and with the overwhelming majority of families having
spells of long-term joblessness, …the relationship between schooling and postschool
employment takes on a different meaning,” and leads to “a shockingly high degree of
educational retardation,” (Wilson 1987, p. 57). According to Wilson, social isolation prevents
youth from experiencing the collective socialization of working- and middle-class adults. Wilson
6
increasingly socially isolated, thus decreasing the probability of achieving the necessary
educational skills and gaining meaningful employment for residents living in concentrated
poverty. Harding (2010) counters that, in contrast to social isolation theory, even youth from the
poorest neighborhoods still have access to mainstream norms and values and do not experience
social isolation or form deviant subcultures; the young men he interviewed often evoke
middle-class values, such as graduating high school, attending college, and delaying fatherhood in order
to complete these goals (p. 133). Harding contends that institutions such as the media, religion,
politics, and educational systems introduce mainstream or middle-class values to the cultural
repertoires of youth in all neighborhoods, poor or otherwise (p. 146, 143).
Whereas the focus of social isolation theory is on the absence of mainstream values,
social disorganization theory gives attention to the multiple values, mainstream and deviant,
present in poor neighborhoods. Presumed to result from structural characteristics of a
neighborhood, such as high rates of poverty, racial/ethnic heterogeneity, and residential
mobility, social disorganization is defined by Park and Burgess (1925) as "the inability of a group
to engage in self-regulation.” More recently, Sampson et al. (1997) propose “collective efficacy”,
or the willingness of neighbors to work together toward a common goal (such as lower crime
rates), as a causal mechanism of the structural characteristics that leads to social
disorganization. That is, when collective efficacy is low, structural disadvantages, such as
population turnover, lack of resources, and racial/ethnic heterogeneity, will emerge and
produce a socially disorganized neighborhood. The instability of a socially disorganized
neighborhood is said to lead to deviant subcultures and heterogeneous norms and values in a
child’s social world (Shaw and McKay 1942). Harding (2010) criticizes the deviant subculture
model as empirically inaccurate and overly deterministic – because deviance never receives
7
neighborhoods as deviant. Harding identifies the social disorganization framework, which
incorporates both a deviant subculture model and heterogeneous norms and values, as
inconsistent as well by pointing to the incompatibility of the two theoretical outcomes, saying
“If individuals draw from multiple cultural lifestyle models, how can subcultures hold such sway
over behavior, action, or decision making?” (p. 140).
Rather than characterizing residents of poor neighborhoods as dominated by deviance
or subcultures as the social isolation and social disorganization theories do, Harding’s work
seeks to revive the role of culture in the discourse on neighborhood contextual effects. By
recognizing that individuals from the same neighborhood could call upon any number of
available scripts in a given situation, the cognitive view of culture that Harding calls for (2010, p.
141) accounts for the role of agency, which in turn may lead to divergent behaviors and
divergent outcomes that we see in poor neighborhoods in domains such as education and
romantic relationships. According to Harding (2010), disadvantaged neighborhoods are more
likely to experience cultural heterogeneity, or “the presence of a diverse array of competing and
conflicting cultural models” (p. 143). Admittedly, Harding is not the first to identify the
heterogeneous cultural models present in poor neighborhood (see Park and Burgess 1925, Shaw
and McKay 1942, Anderson 1999), but his perspective differs in that he conceptualizes cultural
as fragmented and composed of "disparate bits of information and... schematic structures that
organize that information" (DiMaggio 1997, p. 263). When viewed through this paradigm,
individuals can choose from the variety of cultural models that are available, or in Harding’s
words, “socially supported.” Social support for a cultural model need not be universal, only that
support for that model be present enough to maintain visibility (Harding 2010).
Culturally heterogeneous neighborhoods offer some level of social support for a variety
8
receives social support in most neighborhoods, but in a culturally heterogeneous neighborhood,
you might also find support for the “graduate high school and attend community college” or
“drop out of high school, earn a GED, and then attend college” models as well. When an
adolescent in a culturally heterogeneous neighborhood faces obstacles in the pursuit of a
particular model, there are other socially supported models to which he or she can “shift.”
Youth in culturally homogenous neighborhoods are not afforded as many socially supported
models, and therefore face greater pressure to proceed according to the conventional cultural
models. In domains in which 1) cultural models are truly contradictory, not just diverse, 2) when
various competing models receive social support, and 3) when different models actually lead to
different pathways, cultural heterogeneity matters and can produce detrimental outcomes for
residents (Harding 2010). Thus, in the domain of education, cultural heterogeneity not only
matters, but can have serious negative consequences for residents.
With multiple socially supported pathways present, youth who reside in these
neighborhoods are likely to suffer from “dilution,” “simultaneity,” and “model shifting,” three
consequences of cultural heterogeneity outlined by Harding (2010). Dilution refers to problems
of knowledge concerning cultural models; with numerous cultural models in play, the details of
any one cultural script will be less clearly defined or developed (p. 157). Too much information
can become overwhelming for youth, especially if the adults in their social network are equally
as unfamiliar in the steps necessary to achieve a particular goal. With so much information
available, youth from poor neighborhoods may employ multiple scripts concomitantly without
recognizing or reconciling contradictions between them; Harding uses the term “simultaneity”
to refer to problems caused by holding multiple cultural models at the same time (p. 158). The
final consequence of cultural heterogeneity is “model shifting,” or problems of weak
9
In a recently published study, Berg et al. (2012) used data from the Family and
Community Health Study (FACHS), a panel study design with two waves of data collected from
communities in and near Atlanta, Georgia and Waterloo and Des Moines, Iowa in 1997 and
1999. FACHS was designed to identify neighborhood and family processes that influence African
American children’s development. Neighborhoods, defined as census tracts, were considered
for recruitment if the percentage of African American families was 10% or higher and the
percentage of families with children living below the poverty line was between 10% and 100%.
Berg et al.’s study is structured by Shaw and McKay’s (1942) concept of heterogeneous culture
and considers the renewed interest that Harding has brought to the topic. To operationalize
heterogeneous culture, they scaled responses to a series of questions about violence and
aggressive social interaction and used a formula for ordinal concentration (see Blair and Lacy
2000) to measure heterogeneity. Berg et al. (2012) found that disadvantaged neighborhoods
exhibit greater cultural heterogeneity, and adolescents who are exposed to heterogeneous
cultural models are more likely to engage in violent behavior and less likely to act in accordance
to the frames they articulate, or in Harding’s language, more likely to “model shift.”
If Harding’s theory of cultural heterogeneity is correct, we would expect to see more
diversity, that is, more cultural heterogeneity, in educational aspirations and attainment in poor
neighborhoods than in more affluent ones. If cultural heterogeneity not only matters, but can
have serious negative consequences in the domain of education, we would expect cultural
heterogeneity to have a negative effect on educational aspirations and attainment such that
youth from poor neighborhoods will be less likely to want to go to college and less likely to
10 Peer Effects
As the premier study of its time, the Coleman Report (Coleman et al. 1966) examined
data from over 600,000 students and teachers across the United States. Researchers found a
wealth of evidence that one’s peers matter, specifically that “… a pupil’s achievement is strongly
related to the educational backgrounds and aspirations of the other students in the school.”
Coleman later reiterated the study’s results, saying, “… the educational resources provided by a
child's fellow students are more important for his achievement than are the resources provided
by the school board,” (Kahlenberg 2001, p. 26). An individual’s peers may have an effect on
aspirations and attainment through peer-to-peer instruction, through changes in classroom
atmosphere such as classroom disruption, or through social and cultural capital that students
bring from home (Hoxby 2000).
Since that time, researchers have continued to find evidence that a student’s peers
matter. By examining IQ scores of elementary students in Montreal, Henderson et al. (1978)
found strong peer group effects that persist over time. While individual student performance
rises as the average classroom IQ does, the effect in nonlinear, such that individual gains slowed
as the mean IQ rose. Hoxby (2000) found a positive effect of peers’ reading scores on a student’s
own scores for third to sixth grade public school students in Texas, such that a one-point
increase in peer scores raises an individual’s score between 0.15 and 0.4 points. After controlling
for preschool resources, family characteristics, and a child’s skills at the beginning of preschool,
Henry and Rickman (2007) found a direct, positive effect of the ability of level of peers on a
child’s cognitive skills, pre-reading skills, and expressive language skills. Evidence of peer effects
have even been found at postsecondary institutions; using randomly-assigned roommate data
from the graduating classes of 1997 and 1998 at Dartmouth College, Sacerdote (2001) found
11
with a 0.05 increase in one’s own GPA, on the traditional 4.0 GPA scale. While this effect may
seem small to some, Sacerdote points out that it is a modest effect given the heavy
pre-screening for admission that takes place at an elite institution such as Dartmouth. He concludes
that, “even within a group of highly selected college aged students, peer effects are important
to understanding student outcomes. Peer effects may be even more critical and long lasting
earlier in a student’s life (i.e. junior high or high school) or in a context where there is more
student heterogeneity,” (Sacerdote 2001, p. 703).
Studies abroad have found similar results. Using data for all secondary schools in
England for four cohorts, Lavy et al. (2012) simulated the effects of tracking students into two
classes perfectly segregated along the lines of student’s ability, i.e. the first group would include
pupils who are above the median of the ability distribution, and the second those below the
median. They found that being placed in the lower-ability class would definitely worsen future
academic achievement, whereas being placed in the higher-ability class would improve future
achievement. In Trinidad and Tobago where secondary school placement is based on test scores
and a list of four ordered secondary schools choices chosen by the student, Jackson (2009)
found a causal effect of attending a higher achievement school on the number of exams passed.
That is, a 0.5 standard deviation increase in peer test scores (which roughly approximates the
mean difference in peer achievement between a student’s top choice and third choice school)
leads to passing about 0.61 more school exit exams. Based on these findings, researchers have
suggested that the best way to enhance the overall performance of a student population is to
mix, rather than segregate, students of different abilities (Henderson et al. 1978; McPherson
and Schapiro 1998; Argys, Rees, and Brewer 1996).
While the negative effects of being surrounded by low-achieving peers may seem
12
many high-achieving peers. That is, a high-achieving student surrounded by other high-achieving
peers will not recognize their “absolute ability,” but rather their ability relative to their peers.
Students in high-achieving environments take fewer advanced math and science classes than
students of similar “absolute ability” in lower-achieving environments (Attewell 2001), and
students in these higher-achieving environments may be less likely to select into competition for
high status careers (Davis 1966). This relative deprivation, or “frog pond effect,” has been linked
to lower aspirations, achievement, and attainment among achieving students in
high-achieving environments (Attewell 2001; Davis 1966; Lynn and McGeary 1990), such that “It is
better to be a big frog in a small pond than a small frog in a big pond,” (Davis 1966, p. 31).
Hypotheses
While youth from poorer neighborhoods are said to be more likely to experience
cultural heterogeneity (Harding 2007), it does not necessarily mean that cultural heterogeneity
produces the negative outcomes associated with said neighborhoods. Peer effects scholars have
identified negative effects for individuals located in low-achieving and high-achieving
environments. If classrooms of comparable ability, or homogeneous environments in general,
are associated with negative outcomes regardless of mean achievement or ability, perhaps
heterogeneous environments would be more beneficial to students. In other words, a greater
variety of socially supported cultural models may raise the overall educational aspirations and
attainment of youth as they are exposed to models of both what to do be successful and what
not to do.
My research will first investigate if poor neighborhoods have more cultural
heterogeneity as Harding suggests. I will then be working with two sets of competing
hypotheses: the first is based on Harding’s suggestion that cultural heterogeneity will have a
13
evidence from peer effects and proposes that cultural heterogeneity will have a positive effect
on aspirations and attainment.
Hypothesis 1: Poor neighborhoods have more cultural heterogeneity.
Hypothesis 2: Cultural heterogeneity has a negative effect on educational aspirations.
Hypothesis 3: Cultural heterogeneity has a negative effect on educational attainment.
Hypothesis 4: Cultural heterogeneity has a positive effect on educational aspirations.
Hypothesis 5: Cultural heterogeneity has a positive effect on educational attainment.
Influences on Educational Aspirations and Attainment
In this study, I will use educational aspirations and attainment as dependent variables.
Educational attainment is an important determinant of life chances, and perhaps no credential is
more important than a high school diploma. Dropping out of high school is a problem for both
individuals and the larger society, and earning a high school diploma is a critical requirement for
social mobility (Ensminger and Slusarcick1992). Researchers have considered a variety of factors
that can affect the probability of graduating high school, including individual, family,
neighborhood, and peer characteristics.
The notion that educational aspirations influence attainment has been long
documented (Kao and Tienda 1998; Sewell et al. 1969, 1970; Campbell 1983). Individual and
family characteristics are often utilized to predict aspirations and attainment. Based on data
from three panels of the National Education Longitudinal Study of 1988 (NELS:88), Kao and
Tienda (1998) found family income and parental education attainment to be statistically
significant predictors with a positive effect on aspirations. Hossler and Stage (1992) also find a
positive, statistically significant effect of parental education on student aspirations and a
14
Both neighborhood and peer effects researchers have found evidence of gendered
effects on educational aspirations and attainment within their respective fields. In a review of
neighborhood effects on by Leventhal and Brooks-Gunn (2000), they conclude that “the
beneficial effects of neighborhood high SES on adolescents' achievement may be more
pronounced for boys than girls. This pattern suggests that adolescent boys may be more
susceptible to environmental influences than are adolescent girls.” Researchers have also found
gender differences in aspirations, such that females tend to have higher aspirations than males
of their same age and race (Kao and Tienda 1998).
Peer effects researchers have also documented gender differences. Lavy et al. (2012)
found that academically weak students adversely affect the learning of both boy and girls, but
the presence of academically strong students has a positive effect for female learning and a
negative, although statistically insignificant, effect for males. In a cross-cultural review of “frog
pond effects,” Marsh (2005) concludes that frog pond mechanisms are more pronounced for
males, such that males’ self-concepts, and therefore academic performance, is more negatively
affected by the presence of high-ability peers than are females’ academic self-concepts and
performance.
Neighborhood effects researchers believe that the characteristics of one’s surrounding
community can have an effect on educational outcomes, even after controlling for individual
and family characteristics. Some factors are believed to have a negative effect, while other
aspects are thought to have a positive effect on educational aspirations and attainment; i.e.,
neighborhoods can have advantaging and disadvantaging characteristics. However, researchers
have not agreed on a clear definition of what qualifies a neighborhood as advantaged or
disadvantaged. Most, if not all, agree that that the presence of poverty, especially concentrated
15
look for characteristics associated with high levels of poverty, such as crime and other signs of
disorder (Kling, Ludwig, and Katz 2005; Morenoff and Sampson 1997; Ross and Mirowsky 2001),
female-headed households (Massey 1996, Wilson 1996), and joblessness (Wilson 1996,
Ainsworth 2002) to indicate neighborhood disadvantage. Varying measures exist for
neighborhood advantage too. Massey (1996) gives a clear definition of affluence, a lá James
Smith (1988), as the proportion of “persons living in families whose incomes are at least four
times the poverty level for a family of four,” (p. 398). Researchers also consider the high
prevalence of college-educated residents (Ainsworth 2002), persons employed in professional
and managerial occupations (Ainsworth 2002), and home ownership (Ross and Mirowsky 2001)
III. Data and Methods
This analysis uses data from the National Longitudinal Study of Adolescent Health
(hereafter, Add Health) Waves I and III. Add Health consists of a sample of 80 high schools and
52 middle schools from the US that were selected with unequal probability of selection.
Incorporating systematic sampling methods and implicit stratification into the Add Health study
design ensured this sample is representative of US schools with respect to region of country,
urbanicity, school size, school type, and ethnicity (Harris et al. 2009). The data collection for
Wave I took place between 1994 and 1995, and Wave III between 2001 and 2002. Respondents
were approximately 12-21 years old during the Wave I in-home interview and 19-28 in Wave III.
Add Health is well suited for this analysis because it provides not only a wealth of
information regarding adolescents’ personal and family characteristics, but also contains data on
youth’s peers, a necessary component for determining the effects of peers and the cultural
models to which a respondent is exposed. Add Health also contains geocode-linked data to
census tract information, which is important for studying the contextual effects of
neighborhoods. While census tracts are not a perfect operationalization for a respondent’s
neighborhood (Huber 1991), they are the most commonly used measure (Jargowsky 1997) and
neighborhood boundaries reported by residents reflect the actual size of census tracts (Sampson
1997). Also, as a longitudinal dataset, it overcomes criticisms of cross-sectional data as ignoring
the cumulative nature of educational development (Lynn and McGeary 1990).
Variables
The dependent variables in this analysis are a five-point ordinal scale of individual
17
Wave III. Obtaining a high school diploma increases one’s opportunities for social mobility
(Ensminger and Slusarcick1992), and it is also an important step toward earning a college
degree, which researchers predict will become the only feasible way to a middle class lifestyle
(Carnevale et al. 2010; Carnevale et al. 2011). I will also use aspirations to predict attainment, a
relationship that has been consistently established in the literature (Kao and Tienda 1998;
Sewell et al. 1969, 1970; Campbell 1983). The measure of college aspirations – “College Want” –
comes from Wave I of Add Health when respondents were still in high school; the questionnaire
item reads “On a scale of 1 to 5, where 1 is low and 5 is high, how much do you want to go to
college?” I use this variable not just as a measure for individual educational aspirations, but also
to construct an operationalization of cultural heterogeneity (see below). High school graduation
status is measured at Wave III.
I account for individual- and family-level effects on high school graduation status by
using biological sex, family income, mother’s education, and father’s education, all collected at
Wave I. Parents’ education is measured on a 10-point ordinal scale from “never went to school”
to “professional training beyond a 4-year college/university.”
For neighborhood-level variables, I constructed two separate scales for disadvantaging
and advantaging neighborhood characteristics. The scale items and Cronbach's alpha are listed
in Table 1 (see Appendix). The value of the Cronbach’s alpha for the neighborhood disadvantage
scale is 0.8152 and 0.9108 for the neighborhood advantage scale, which, according to
conventional standard, represent good to excellent levels of internal consistency (George and
Mallery 2003).
To measure the effect of peers on individual aspirations and attainment, I use the
average college aspirations of all the students in an individual’s school, measured on the same
18 Operationalizing Cultural Heterogeneity
I will be operationalizing respondents’ cultural heterogeneity within schools, which I
believe this to be the truest setting in which to measure cultural heterogeneity and test its
effects on educational attainment. Many schools reflect the neighborhoods from which students
originate, and students spend a significant amount of time at school where they will be exposed
to cultural scripts regarding education from teachers, administrators, and fellow students. To
construct a variable to measure cultural heterogeneity, I grouped students by school and
calculated the mean and standard deviation of “College Want” for a respondent’s school peers,
excluding the respondent themselves in the estimate; this calculation is done for each student,
yielding similar yet slightly different results for each student in a particular school. These
variables represent the cultural models a student is exposed to without being influenced by the
student’s own cultural model. The standard deviation of a respondent’s peers’ college
aspirations is analogous to the cultural heterogeneity that a respondent encounters. Add Health
also contains data on respondents’ friends; respondents were asked to nominate up to five
female friends and five male friends. Future research could use these nominated friends as
alternative approach to measuring cultural heterogeneity.
Model Specification
First, I investigate the claim that poor neighborhoods experience more cultural
heterogeneity. I will then present a regression model wherein students are aggregated into the
schools from which they were sampled. This will provide a baseline assessment of the effects of
average peer aspirations and cultural heterogeneity on school graduation rates. I will then
investigate individual-level outcomes using ordered logistic regression to analyze college
aspirations, an ordinal variable, and logistic regression to analyze high school graduation status,
19
heterogeneity, as well as individual-, neighborhood-, and peer-level characteristics on college
aspirations and graduating high school. I will also employ multilevel mixed-effects logistic
regression to account for the fixed effects of the aforementioned variables on educational
attainment, as well as the random effects within schools. I, however, cannot estimate multilevel
mixed-effects models for educational aspirations due to software limitations. Therefore, I will
only be using ordered logistic regression to estimate the individual-, family-, neighborhood-, and
peer-effects on college aspirations.
In each of these models, I first present statistics on the full sample of 6,829 respondents
in 132 high schools. In subsequent models, I chose to limit the sample to adjust for ceiling
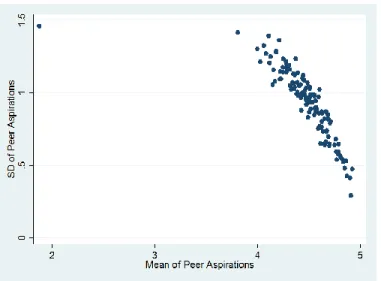
effects; as a discrete variable trending toward the upper limit, the mean and standard deviation
of college aspirations are more correlated near the top of the distribution (Dorius 2012, Dorius
2008). The standard deviation of such a variable becomes limited in the values it can assume as
the mean increases; see Graph 1 for an illustration and Table 4 for the individual- and
school-level correlations between the mean and standard deviation of peer aspirations. In the
aggregate regression analysis, Models 2 and 3 restrict the sample to those schools with mean
college aspiration values less than or equal to 4.5 and 4.3, respectively. In the individual-level
IV. Analysis and Results
The summary statistics for the full and limited samples can be found in Table 3 (see
Appendix). On average, 85% of the sample has graduated from high school by Wave III of data
collection. The average family income of respondents is $52,341, and the average level of
education for both mothers and fathers is a high school degree or GED. Students in the sample
have high college aspirations; on a scale of 1 to 5, with 5 being the highest, individual student
aspirations average to 4.474 with a standard deviation of 0.997. Within-school aspirations vary
much less with a standard deviation of 0.227. In terms of neighborhood disadvantage, which
ranges from 0 to 1, students’ scale scores fall between 0.1000 and 0.645; for the neighborhood
advantage scale, scores range from 0.031 to 0.815. Finally, cultural heterogeneity, which is
constructed as the standard deviation of a student’s peers’ college aspirations, varies from no
heterogeneity within the school to a maximum standard deviation of 1.458 points on the same
5-point scale as the other college aspiration variables.
Harding theorizes, “… adolescents in more disadvantaged neighborhoods exhibit greater
heterogeneity in college goals…” (Harding 2010, p. 154). According to Harding’s theory, we
would expect to see greater variation in the responses of students from disadvantaged
neighborhoods; in Table 2, I present the distribution of responses to “College Want” by quintiles
of the disadvantaged neighborhood scale. The majority of students, regardless of their level of
neighborhood disadvantage, report strong desires to go to college. However, respondents from
the most disadvantaged neighborhoods, those in the fifth quintile, do exhibit greater variation in
their responses than do those from the more advantaged quintiles, as seen by higher than
21 School-Level Analysis
To investigate the general impact of cultural heterogeneity on graduating high school, I
collapsed the data by schools and ran an aggregate regression model predicting graduation; the
results are listed in Table 5 (see Appendix). Even after adjusting for ceiling effects, there is no
evidence that the standard deviation of peer responses, or cultural heterogeneity, has a
negative effect on high school graduation, as Harding’s theory would predict. Even in Model 3,
where the correlation between the mean and standard deviation of peer aspirations is -0.4110,
the operationalization of cultural heterogeneity exhibits a positive effect on graduation and fails
to reach significance. While the 25 cases in Model 3 may cast some doubt on the calculation of
statistical significance, the mean of peer aspirations does reach significance (p<0.001). In other
words, as the mean aspirations of an individual’s school peers rise one-point, graduation rates
rise by 39 percent, a strong effect that is unlikely to be observed by chance. To gain a better
understanding of how cultural heterogeneity and peers influence attainment and aspirations, I
turn to an individual-level analysis.
Individual-Level Analysis
To examine how these independent variables affect college aspirations, I used ordered
logistic regression, and the odds ratios are presented in Table 6. According to Model 1, the odds
of higher individual aspirations are 9.3 times higher for every one-unit increase in mean peer
aspirations, a statistically significant effect. The effect of cultural heterogeneity, as measured by
the standard deviation of peer aspirations, exerts a positive, although statistically insignificant,
effect on aspirations. As individual- and family-level variables are added to the analysis in Model
2, the effect of average peer aspirations increases slightly and remains significant. The effect of
cultural heterogeneity increases and gains significance, such that for a one-unit increase in
22
The individual- and family-level variables are all statistically significant to the 0.01 level and
exert the expected, positive effects on educational aspirations. In the full model, Model 3,
individual- and family-level variables continue to exert positive, statistically significant effects on
college aspirations. Advantaging neighborhood characteristics also have a statistically significant
(p<0.1), positive effect. Interestingly, disadvantaging neighborhood characteristics also exert a
positive, statistically significant (p<0.05) effect; theoretically, low neighborhood SES should have
a negative effect on aspirations. Average peer aspirations and cultural heterogeneity both
continue to have positive, statistically significant (p<0.01) effects on college aspirations, which
lends support to Hypotheses 4 and 5 and stand in contradiction to Hypotheses 3 and 4.
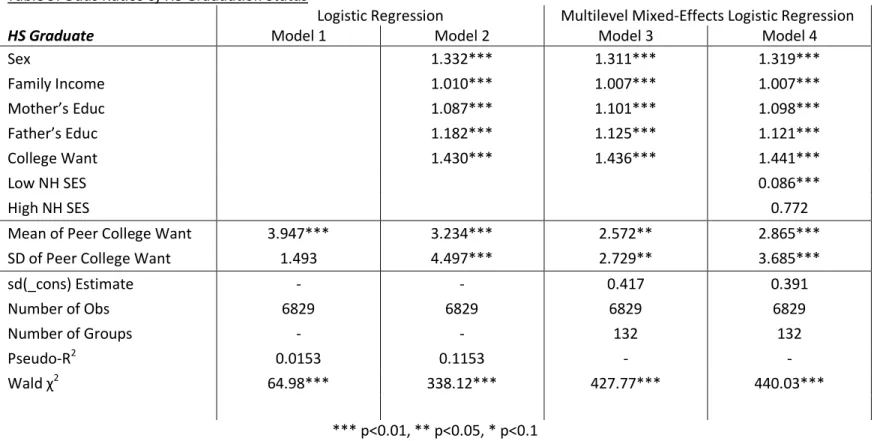
Using logistic and multilevel mixed-effects logistic regression, I estimate the individual-,
neighborhood-, and peer-level effects on high school graduation (see Table 9 for Odds Ratios).
High average peer aspirations have a strong positive effect on the probability of graduating high
school; in Model 4, as average peer aspiration rise one-unit, the odds of graduating increases by
287%. One’s own aspirations matter as well; the likelihood of graduating high school increases
by 144% for each one-point increase in aspirations. The operationalization of cultural
heterogeneity, the standard deviation of a respondent’s peers’ aspirations, becomes statistically
significant in later models, but has the effect of increasing the probability of graduating high
school, not decreasing as Harding’s theory suggests. Disadvantaging neighborhood
characteristics have a strong positive effect, whereas advantaging characteristics are not
significant. I tested for interaction effects between neighborhood characteristics and cultural
heterogeneity, but the results were not statistically significant.
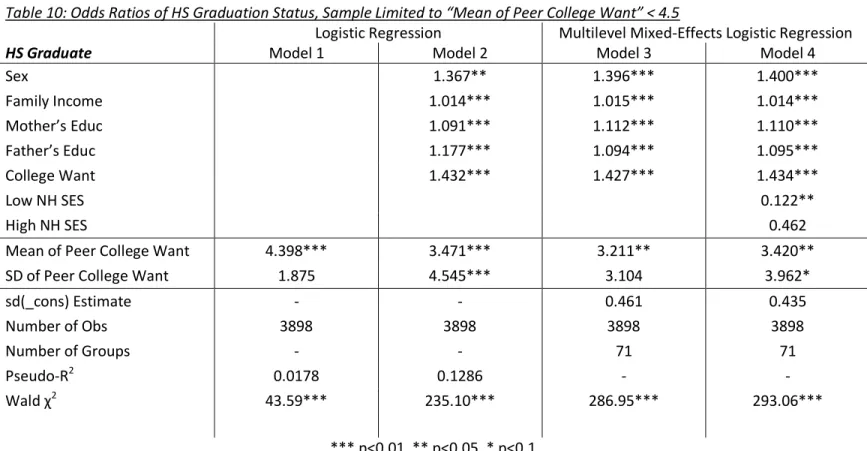
To control for possible ceiling effects, I again limit the sample by mean peer aspirations.
Tables 7 and 8 provide the odds ratios for the limited samples for college aspirations, and Tables
23
the sample is limited, the correlation between the mean and standard deviation of peer
aspirations becomes weaker (see Table 4). This allows one to better separate the contributing
effects of the mean from those of the standard deviation. In Table 7, mean peer aspirations
have a strong, statistically significant effect on individual aspirations, the standard deviation of
peer responses, or cultural heterogeneity, has a positive, although insignificant, effect on
aspirations. Family income and parent’s education all have positive, statistically significant
effects on college aspirations. When the sample is limited to mean aspirations less than or equal
to 4.3 (Table 8), the effect of cultural heterogeneity on aspirations does reach significance, and
again, it is a positive effect, the opposite direction of Harding’s hypothesis.
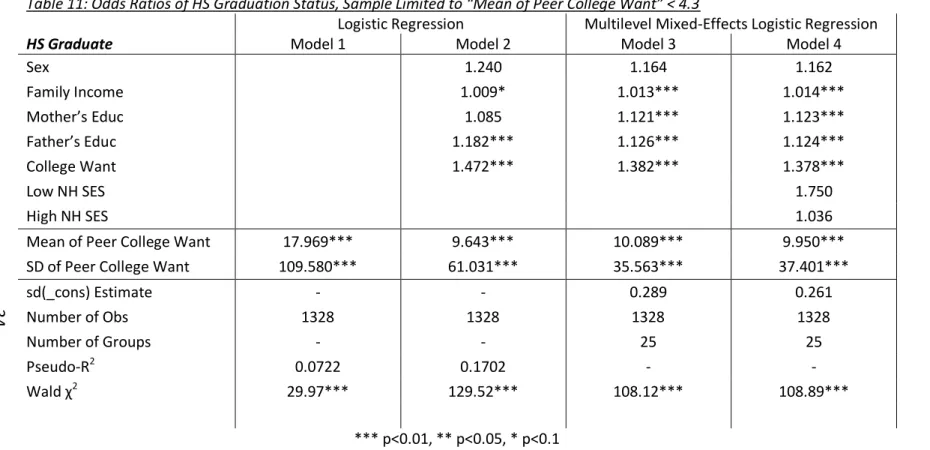
Tables 10 and 11 provide the odds ratios for the limited samples for the multivariate
analysis of high school graduation status. In both of the limited models that predict high school
graduation, the operationalization of cultural heterogeneity, “SD of Peer College Want,” reaches
statistical significance in later models, but the effect on high school graduation is contrary to
that proposed by Harding. In fact, Model 4 in Table 11 shows that one standard deviation
increase in the standard deviation of peer aspirations, i.e., cultural heterogeneity, increases the
odds of graduating high school by 3,740%! Average peer aspirations, family characteristics, and
individual aspirations are all statistically significant as well, but it is average peer aspirations that
have strongest effect of the remaining variables; a one-point increase in average peer
aspirations increases the odds of graduating high school by 995%.
The results of my individual-level analyses indicate support for Hypotheses 4 and 5,
which state that cultural heterogeneity will have a positive effect on educational aspirations and
attainment. These hypotheses stand in direct opposition to Hypotheses 2 and 3, which were
developed from Harding’s (2010) theory of cultural heterogeneity and specify that cultural
V. Discussion and Conclusions
My analysis shows a strong, statistically significant effect of cultural heterogeneity on
the probability of graduating high school, however, the effect is in the opposite direction
hypothesized by Harding. While personal and family characteristics were often statistically
significant predictors of college aspirations and earning a high school diploma, it was mean peer
aspirations and cultural heterogeneity that had the strongest effects on the variables of interest,
and both peer aspirations and cultural heterogeneity had positive effects on aspirations and
attainment.
A recent publication by Berg et al. (2012) addressed hypotheses related to cultural
heterogeneity and found disadvantaged neighborhoods to be more culturally heterogeneous,
and exposure to culturally heterogeneous models increased adolescents’ likelihood to engage in
violent behavior and to “model shift.” My research differs not only in the conclusions drawn, but
also methodologically. Berg et al. employed a different method for operationalizing cultural
heterogeneity, constructing scaled responses to a series of questions about violence and
aggressive social interaction and using a formula for ordinal concentration (see Blair and Lacy
2000) to measure heterogeneity. Furthermore, their sample only included African American
respondents, and their sample was not drawn to be nationally representative as the Add Health
dataset was. Furthermore, Berg et al. tested hypotheses related to violence, whereas this study
focuses on educational outcomes. Despite these differences, the Berg et al. study provides
evidence that the investigation of cultural heterogeneity and its effects are worth studying, and
the conflicting conclusions of their study and my own demonstrate the need for more research
25
It is possible that the operationalization of cultural heterogeneity that I have created
does not capture the concept Harding proposes. Harding (2010) describes cultural heterogeneity
as the “multiple cultural models that are present in… neighborhoods,” (p. 134), but my analysis
has defined cultural heterogeneity in terms of the variation within schools. While schools are
not neighborhoods, the two domains are closely related. Many schools reflect the
neighborhoods they are located within, and we can expect that whatever cultural frames or
scripts are present within the school are also present in the students’ neighborhoods. Even for
schools where the majority of students do not come from the surrounding neighborhood, we
can think of the school as a neighborhood-of-sorts; students spend approximately seven hours a
day at school, and cultural models that are expressed and reinforced within the school are
bound to influence a student’s perception of what pathways receive some degree of social
support.
My operationalization of cultural heterogeneity could also be limited in that it only takes
into account the diversity in cultural models reported by students, whereas Harding’s theory
speaks to the broad array of institutions that transmit cultural messages. However, I contend
that if social support exists in the broader community for a particular cultural model, then
students would reflect that in their survey responses; basic socialization theory states that
children will acquire the norms, values, and behaviors of the society in which they are
embedded. Conversely, if students are not detecting social support that actually exists for
cultural models, then the social support is inconsequential; one cannot be influenced by
information one does not know.
Finally, Harding’s theory was generated primarily from in-depth, unstructured
interviews with adolescent boys. Some researchers have found evidence that “adolescent boys
26
Brooks-Gunn 2000; Kling, Ludwig, and Katz 2005). It may be the case that the mechanism of
cultural heterogeneity operates differently for males and females or somehow differs in its
educational consequences for each gender. Future work should focus on how cultural
heterogeneity has affects adolescent males and females separately.
Harding’s theory of cultural heterogeneity, while compelling, is not statistically
supported by this research. Perhaps a different operationalization of cultural heterogeneity is
needed, or survey items could be constructed with the goal of measuring cultural heterogeneity
rather than using post hoc operationalizations. Harding use of cultural heterogeneity lacks
conceptual clarity as well as a complete specification of the dimensions that must be taken into
account; in that way, we move toward a better understanding of this qualitatively-generated
27
APPENDIX
Graph 1: Scatterplot of Mean and Standard Deviation of Peer Aspirations, School-Level (n=132)
Table 1: Neighborhood SES Construction
Table 2: College Aspirations by Neighborhood Disadvantage
“On a scale of 1 to 5, where 1 is low and 5 is high, how much do you want to go to college?”
Neighborhood Disadvantage Scale Quintiles 1 (percent) 2 (percent) 3 (percent) 4 (percent) 5
(percent) Row Obs
1st 2.43 1.67 6.68 10.77 78.45 659
2nd 2.99 2.62 9.11 13.10 72.18 3,810
3rd 3.80 3.14 9.75 12.89 70.41 1,210
4th 4.42 3.28 10.35 12.63 69.32 792
5th 4.19 2.79 11.73 11.45 69.83 358
All 3.31 2.71 9.27 12.70 72.02 6,829
Scale Item Cronbach’s
alpha
Low NH SES
Proportion of female-headed households (no husband present) with children
0.8152 Proportion of non-elderly (less than 65 years old) below the
poverty line
Proportion of male residents at least 16-years-old who did not work at least 35 hours a week for at least 48 weeks of the year (male underemployment)
High NH SES
Proportion of resident at least 25-years-old with a college degree or more
0.9108 Proportion of residents who are employed in managerial and
profession specialty occupations
28 Table 3: Summary Statistics
Variable N Mean SD Min. Max.
HS Graduate 6,829 0.851 0.356 0 1
Sex 6,829 1.536 0.499 1 2
Family Income 6,829 52.341 47.249 0 880
Mother’s Educ 6,829 5.694 2.324 0 9
Father’s Educ 6,829 5.635 2.438 0 9
College Want 6,829 4.474 0.997 1 5
Low NH SES 6,829 0.217 0.075 0.100 0.645
High NH SES 6,829 0.249 0.128 0.031 0.815
Mean of Peer
College Want 6,829 4.463 0.227 1.875 5
SD of Peer
College Want 6,829 0.951 0.223 0 1.458
Table 4: Correlation of Means and Standard Deviations of Respondents’ Peers’ Aspirations
Table 5: Aggregate OLS Regression of HS Graduation Status
Full Sample Limited, Mean of “College Want” < 4.5
Limited, Mean of “College Want” < 4.3
Model 1 Model 2 Model 3
Individual-Level -0.8946 -0.7357 -0.4110
School-Level -0.7705 -0.6331 -0.5544
Full Sample Limited, Mean of “College Want” < 4.5
Limited, Mean of “College Want” < 4.3
HS Graduate Model 1 Model 2 Model 3
Mean of Peer College Want 0.288*** 0.310*** 0.393***
SD of Peer College Want 0.085 0.062 0.388
Constant -0.545* -0.600 -1.307***
Number of Obs 132 67 25
R2 0.3038 0.3588 0.7233
Table 6: Odds Ratios of College Aspirations
Ordered Logistic Regression
College Want Model 1 Model 2 Model 3
Sex 1.462*** 1.459***
Family Income 1.005*** 1.005***
Mother’s Educ 1.138*** 1.138***
Father’s Educ 1.072*** 1.070***
Low NH SES 3.539**
High NH SES 2.157*
Mean of Peer College Want 9.337*** 9.725*** 9.488***
SD of Peer College Want 1.413 2.674*** 2.692***
/cut 1 6.907 9.504 9.843
/cut 2 7.502 10.107 10.445
/cut 3 8.581 11.215 11.553
/cut 4 9.349 12.015 12.354
Number of Obs 6829 6829 6829
Pseudo-R2 0.0273 0.0541 0.0548
Wald χ2 215.13*** 388.47*** 385.47***
*** p<0.01, ** p<0.05, * p<0.1
Table 7: Odds Ratios of College Aspirations, Sample Limited to “Mean of Peer College Want” < 4.5 Ordered Logistic Regression
College Want Model 1 Model 2 Model 3
Sex 1.547*** 1.544***
Family Income 1.006*** 1.007***
Mother’s Educ 1.154*** 1.154***
Father’s Educ 1.052** 1.052**
Low NH SES 4.233*
High NH SES 2.469
Mean of Peer College Want 9.624*** 8.947*** 8.804***
SD of Peer College Want 1.345 1.660 1.642
/cut 1 7.014 8.753 9.206
/cut 2 7.592 9.339 9.793
/cut 3 8.661 10.442 10.896
/cut 4 9.380 11.197 11.652
Number of Obs 3898 3898 3898
Pseudo-R2 0.0245 0.0529 0.0537
Wald χ2 117.52*** 241.14*** 241.41***
*** p<0.01, ** p<0.05, * p<0.1
Table 8: Odds Ratios of College Aspirations, Sample Limited to “Mean of Peer College Want” < 4.3 Ordered Logistic Regression
College Want Model 1 Model 2 Model 3
Sex 1.747*** 1.731***
Family Income 1.005* 1.007**
Mother’s Educ 1.196*** 1.211***
Father’s Educ 1.047 1.045
Low NH SES 20.470***
High NH SES 3.059
Mean of Peer College Want 15.959*** 13.456*** 14.213***
SD of Peer College Want 20.783*** 15.290*** 21.471***
/cut 1 12.643 13.615 15.294
/cut 2 13.102 14.086 15.768
/cut 3 14.097 15.129 16.817
/cut 4 14.832 15.913 17.605
Number of Obs 1328 1328 1328
Pseudo-R2 0.0396 0.0720 0.0757
Wald χ2 61.02*** 122.49*** 126.16***
*** p<0.01, ** p<0.05, * p<0.1
Table 9: Odds Ratios of HS Graduation Status
Logistic Regression Multilevel Mixed-Effects Logistic Regression
HS Graduate Model 1 Model 2 Model 3 Model 4
Sex 1.332*** 1.311*** 1.319***
Family Income 1.010*** 1.007*** 1.007***
Mother’s Educ 1.087*** 1.101*** 1.098***
Father’s Educ 1.182*** 1.125*** 1.121***
College Want 1.430*** 1.436*** 1.441***
Low NH SES 0.086***
High NH SES 0.772
Mean of Peer College Want 3.947*** 3.234*** 2.572** 2.865***
SD of Peer College Want 1.493 4.497*** 2.729** 3.685***
sd(_cons) Estimate - - 0.417 0.391
Number of Obs 6829 6829 6829 6829
Number of Groups - - 132 132
Pseudo-R2 0.0153 0.1153 - -
Wald χ2 64.98*** 338.12*** 427.77*** 440.03***
*** p<0.01, ** p<0.05, * p<0.1
Table 10: Odds Ratios of HS Graduation Status, Sample Limited to “Mean of Peer College Want” < 4.5
Logistic Regression Multilevel Mixed-Effects Logistic Regression
HS Graduate Model 1 Model 2 Model 3 Model 4
Sex 1.367** 1.396*** 1.400***
Family Income 1.014*** 1.015*** 1.014***
Mother’s Educ 1.091*** 1.112*** 1.110***
Father’s Educ 1.177*** 1.094*** 1.095***
College Want 1.432*** 1.427*** 1.434***
Low NH SES 0.122**
High NH SES 0.462
Mean of Peer College Want 4.398*** 3.471*** 3.211** 3.420**
SD of Peer College Want 1.875 4.545*** 3.104 3.962*
sd(_cons) Estimate - - 0.461 0.435
Number of Obs 3898 3898 3898 3898
Number of Groups - - 71 71
Pseudo-R2 0.0178 0.1286 - -
Wald χ2 43.59*** 235.10*** 286.95*** 293.06***
*** p<0.01, ** p<0.05, * p<0.1
Table 11: Odds Ratios of HS Graduation Status, Sample Limited to “Mean of Peer College Want” < 4.3
Logistic Regression Multilevel Mixed-Effects Logistic Regression
HS Graduate Model 1 Model 2 Model 3 Model 4
Sex 1.240 1.164 1.162
Family Income 1.009* 1.013*** 1.014***
Mother’s Educ 1.085 1.121*** 1.123***
Father’s Educ 1.182*** 1.126*** 1.124***
College Want 1.472*** 1.382*** 1.378***
Low NH SES 1.750
High NH SES 1.036
Mean of Peer College Want 17.969*** 9.643*** 10.089*** 9.950***
SD of Peer College Want 109.580*** 61.031*** 35.563*** 37.401***
sd(_cons) Estimate - - 0.289 0.261
Number of Obs 1328 1328 1328 1328
Number of Groups - - 25 25
Pseudo-R2 0.0722 0.1702 - -
Wald χ2 29.97*** 129.52*** 108.12*** 108.89***
*** p<0.01, ** p<0.05, * p<0.1
35
REFERENCES
Anderson, Elijah. 1999. Code of the Street: Decency, Violence and the Moral Life of the Inner City. New York: W.W. Norton.
Argys, Laura M., Daniel I. Rees, and Dominic J. Brewer. 1996. “Detracking America’s Schools: Equity at Zero Cost?” Journal of Policy Analysis and Management. 15, no.4: 623 – 645.
Attewell, Paul. 2001. "The Winner-Take-All High School: Organizational Adaptations to Educational Stratification." Sociology of Education 74(4):267-95.
Berg, Mark T., Eric A. Stewart, Rodney Brunson, and Ronald L. Simons. 2012. “Neighborhood Cultural Heterogeneity and Adolescent Violence.” Journal of Quantitative Criminology. 28, no. 3: 411 – 435.
Blair, Julian and Michael G. Lacy. 2000. “Statistics of Ordinal Variation.” Sociological Methods
Research. 28, no. 3: 251 – 280.
Brooks-Gunn, Jeanne, Greg J. Duncan, and J. Lawrence Aber, eds. 1997. Neighborhood Poverty: Context and Consequences for Children, Volume I. New York: Russell Sage Foundation.
Campbell, Richard T. 1983. "Status Attainment Research: End of the Beginning or Beginning of the End?" Sociology of Education. 56, no. 1: 47 – 62.
Carnevale, Anthony P., Nicole Smith, and Jeff Strohl. 2010. “Help Wanted: Projections of Jobs and Education Requirements through 2018.” Center on Education and the Workforce, National Research Center for Career and Technical Education, and Career Technical Education.
Carnevale, Anthony P., Nicole Smith, James R. Stone, Pradeep Kotamraju, Bruce Steuernagel, and Kimberly A. Green 2011. “Career Clusters: Forecasting Demand for High School through College Jobs 2008-2018.” Center on Education and the Workforce. Georgetown University: Washington, D.C.
Coleman, James S., Ernest Q. Campbell, Carol J. Hobson, James McPartland, Alexander M. Mood, Frederic D. Weinfeld, and Robert L. York. 1966. Equality of Educational Opportunity. Washington, DC: U.S. Government Printing Office.
Crowder, Kyle and Scott J. South. 2003. “Neighborhood Distress and School Dropout: The Variable Significance of Community Context.” Social Science Research. 32, no. 4: 659 – 698.
Davis, James A. 1966. "Campus as a Frog Pond - Application of Theory of Relative Deprivation to Career Decisions of College Men." American Journal of Sociology 72(1):17-31.
36
Dorius, Shawn F. 2008. “Global Demographic Convergence? A Reconsideration of Changing Intercountry Inequality in Fertility.” Population and Development Review. 34, no. 3: 519 – 537.
Dorius, Shawn F. Forthcoming 2012. “The Rise and Fall of Worldwide Education Inequality from 1870-2010: Measurement and Trends.” Sociology of Education.
doi:10.1177/0038040712456558
Ensminger, Margaret E. and Anita L. Slusarcick. 1992. “Paths to High School Graduation or Dropout: A Longitudinal Study of a First-Grade Cohort.” Sociology of Education. 65, no. 2: 95 – 113.
George, Darren, and Paul Mallery. 2003. SPSS for Windows Step by Step: A Simple Guide and
Reference. 11.0 Update (4th ed.). Boston: Allyn & Bacon.
Harding, David J. 2007. “Cultural Context, Sexual Behavior, and Romantic Relationships in Disadvantaged Neighborhoods.” American Sociological Review. 72, no. 3: 341 – 364.
Harding, David J. 2009. “Violence, Older Peers, and the Socialization of Adolescent Boys in Disadvantaged Neighborhoods.” American Sociological Review. 74, no. 3: 445 – 464.
Harding, David J. 2010. Living the Drama: Community, Conflict, and Culture Among Inner-City Boys. Chicago: University of Chicago Press.
Harris, Kathleen Mullen, Carolyn T. Halpern, Eric Whitsel, Jon Hussey, Joyce Tabor, Pamela Entzel, and J. Richard Udry. 2009. The National Longitudinal Study of Adolescent Health: Research Design [WWW document]. URL:
http://www.cpc.unc.edu/projects/addhealth/design.
Henderson, Vernon, Peter Mieszkowski, and Yvon Sauvageau. 1978. “Peer Group Effects and Educational Production Functions.” Journal of Public Economics.10, no. 1: 97 – 196.
Henry, Gary T. and Dana K. Rickman. 2007. “Do Peers Influence Children’s Skill Development in Preschool?” Economics of Education Review. 26, no. 1: 100 – 112.
Hossler, Don and Frances K. Stage. 1992. “Family and High School Influences on the
Postsecondary Educational Plans of Ninth-Grade Students.” American Educational Research
Journal. 29, no. 2: 425 – 451.
Hoxby, Caroline M. 2000. “Peer Effects in the Classroom: Learning from Gender and Race Variation.” Working Paper no. 7867, National Bureau of Economic Research, Cambridge, MA.
Huber, Joan, ed. 1991. Macro-Micro Linkages in Sociology. Newbury Park, CA: Sage.
37
Jargowsky, Paul A. 1997. Poverty and Place: Ghettos, Barrios, and the American City. New York: Russell Sage Foundation.
Kahlenberg, Richard D. 2001. All Together Now: Creating Middle-Class Schools Through Public School Choice. Washington, D.C.: Brookings Institution Press.
Kao, Grace and Marta Tienda. 1998. “Educational Aspirations of Minority Youth.” American
Journal of Education 106, no. 3: 349-384.
Kling, Jeffrey, Jens Ludwig, and Lawrence Katz. 2005. “Neighborhood Effects on Crime for Female and Male Youth: Evidence from a Randomized Housing Voucher Experiment.”
Quarterly Journal of Economics 120, no. 1: 87-130.
Lavy, Victor, Olmo Silva, and Felix Weinhardt. 2012. “The Good, the Bad, and the Average: Evidence on Ability Peer Effects in Schools.” Journal of Labor Economics. 30, no. 2: 367 – 414.
Leventhal, Tama, and Jeanne Brooks-Gunn. 2000. “The Neighborhoods They Live In: The Effects of Neighborhood Residence on Child and Adolescent Outcomes.” Psychological Bulletin. 126, no. 2: 309-337.
Lynn, Laurence E. Jr. and Michael G.H. McGeary, eds. 1990. Inner-City Poverty in the United States. Washington, D.C.: National Academy Press.
Marsh, Herbert W. 2005. “Big Fish Little Pond Effect on Academic Self-concept: Cross-cultural and Cross-Disciplinary Generalizability”, paper presented at the AARE Conference. URL: http://www.aare.edu.au/05pap/mar05389.pdf
McPherson, Michael, and Morton Schapiro. 1998. The Student Aid Game: Meeting Need and Rewarding Talent in American Higher Education. Princeton, NJ: Princeton University Press.
Newman, Katherine S. 1999. No Shame in My Game: The Working Poor in the Inner City. New York: Vintage and Russell Sage.
Park, Robert and Ernest Burgess. 1925. The City. Chicago: University of Chicago Press.
Sacerdote, Bruce. 2001. “Peer Effects with Random Assignment: Results for Dartmouth Roommates.” The Quarterly Journal of Economics. 116, no. 2: 681 – 704.
Sampson, Robert J. 1997. “Collective Regulation of Adolescent Misbehavior: Validation Results from Eighty Chicago Neighborhoods.” Journal of Adolescent Research. 12, no. 2: 227 – 244.
Sampson, Robert J., Stephen W. Raudenbush, and Felton Earls. 1997. “Neighborhoods and Violent Crime: A Multilevel Study of Collective Efficacy.” Science. 277, no. 5328: 918 – 924.
38
Sewell, William H., Archibald O. Haller, and Alejandro Portes. 1969. "The Educational and Early Occupational Attainment Process." American Sociological Review. 34, no. 1: 82 – 92.
Sewell, William H., Archibald O. Haller, and George W. Ohlendrof. 1970. "The Educational and Early Occupational Attainment Process: Replication and Revision." American Sociological
Review. 35, no. 6: 1014 – 1027.
Shaw, Clifford R. and Henry D. McKay. 1942. Juvenile Delinquency and Urban Areas. Chicago: University of Chicago Press.
Wacquant, Loic J.D., and William Julius Wilson. 1989. “The Cost of Racial and Class Exclusion in the Inner City.” Annals of the American Academy of Political and Social Sciences. 501, no. 1: 8-25.
Wilson, William Julius. 1987. The Truly Disadvantaged: The Inner City, the Underclass, and Public Policy. Illinois: University of Chicago Press.
Wilson, William Julius. 1996. When Work Disappears: The World of the New Urban Poor. New York: Alfred A. Knopf