Deep Sequencing of the HIV-1
env
Gene Reveals Discrete X4 Lineages
and Linkage Disequilibrium between X4 and R5 Viruses in the V1/V2
and V3 Variable Regions
Shuntai Zhou,aMaria M. Bednar,aChrista B. Sturdevant,b*Blake M. Hauser,aRonald Swanstroma,b,c,d
UNC Lineberger Comprehensive Cancer Center,a
Department of Microbiology and Immunology,b
Department of Biochemistry and Biophysics,c
and UNC Center for AIDS Research,d
University of North Carolina at Chapel Hill, Chapel Hill, North Carolina, USA
ABSTRACT
HIV-1 requires the CD4 receptor and a coreceptor (CCR5 [R5 phenotype] or CXCR4 [X4 phenotype]) to enter cells. Coreceptor tropism can be assessed by either phenotypic or genotypic analysis, the latter using bioinformatics algorithms to predict tropism based on theenvV3 sequence. We used the Primer ID sequencing strategy with the MiSeq sequencing platform to reveal the structure of viral populations in the V1/V2 and C2/V3 regions of the HIV-1envgene in 30 late-stage and 6 early-stage subjects. We also used endpoint dilution PCR followed by cloning ofenvgenes to create pseudotyped virus to explore the link between genotypic predictions and phenotypic assessment of coreceptor usage. We found out that the most stringently sequence-based calls of X4 variants (Geno2Pheno false-positive rate [FPR] of<2%) formed distinct lineages within the viral population, and these were detected in 24 of 30 late-stage samples (80%), which was significantly higher than what has been seen previously by using other approaches. Non-X4 lineages were not skewed toward lower FPR scores in X4-containing populations. Phenotypic assays showed that variants with an intermediate FPR (2 to 20%) could be either X4/dual-tropic or R5 variants, although the X4 variants made up only about 25% of the lineages with an FPR of<10%, and these variants carried a distinctive sequence change. Phylogenetic analysis of both the V1/V2 and C2/V3 regions showed evidence of recombination within but very little recombina-tion between the X4 and R5 lineages, suggesting that these popularecombina-tions are genetically isolated.
IMPORTANCE
Primer ID sequencing provides a novel approach to study genetic structures of viral populations. X4 variants may be more prev-alent than previously reported when assessed by using next-generation sequencing (NGS) and with a greater depth of sampling than single-genome amplification (SGA). Phylogenetic analysis to identify lineages of sequences with intermediate FPR values may provide additional information for accurately predicting X4 variants by using V3 sequences. Limited recombination occurs between X4 and R5 lineages, suggesting that X4 and R5 variants are genetically isolated and may be replicating in different cell types or that X4/R5 recombinants have reduced fitness.
H
uman immunodeficiency virus type 1 (HIV-1) requires the CD4 receptor and a coreceptor to infect host cells. Entry is mediated by the viral envelope protein (Env), which is processed to give two associated subunits, gp120 and gp41, that assemble into a trimeric structure embedded in the viral envelope/mem-brane. The binding of gp120 to CD4 triggers a structural change that exposes its variable region 3 (V3) loop, which is part of the coreceptor domain (1,2). The majority of transmitted/founder (T/F) viruses and viruses isolated from the clinically latent stage in HIV-infected subjects use CCR5 as the coreceptor, making the virus CCR5 tropic (or an R5 virus). The virus can evolve to use CXCR4 (CXCR4 tropic [or an X4 virus]), and viruses that have switched coreceptor usage are found mostly in late-stage subjects with low CD4⫹T cell counts (3,4). Viruses evolving an X4 phe-notype often retain some capacity to use CCR5 for entry and are often referred to as X4/dual-tropic viruses.Coreceptor tropism can be assessed by either phenotypic or genotypic analysis. Cell-based assays for entry phenotype test ei-ther virus isolates or viruses pseudotyped by using cloned viralenv
genes. Phenotyping consists of infecting cells expressing CD4 and either CCR5 or CXCR4 (5,6) or inhibiting infection with antag-onists of CCR5 and/or CXCR4. Alternatively, assignment of core-ceptor tropism by sequence analysis has been based on sequencing of the V3 loop coding domain of the viralenvgene. As the V3 loop
of gp120 directly interacts with the coreceptor, the sequence of the V3 loop is the major determinant of the coreceptor tropism phe-notype (7,8). In contrast to V3, which appears to be variable due to the coreceptor switch, variable regions V1, V2, V4, and V5 are surface loops of the gp120 subunit involved in autologous anti-body escape, and these regions are separated by relatively constant regions (i.e., C1, V1/V2, C2, V3, C4, V4, C5, V5, and C6).
Several bioinformatics interpretation systems have been
devel-Received14 March 2016Accepted23 May 2016
Accepted manuscript posted online25 May 2016
CitationZhou S, Bednar MM, Sturdevant CB, Hauser BM, Swanstrom R. 2016. Deep sequencing of the HIV-1envgene reveals discrete X4 lineages and linkage disequilibrium between X4 and R5 viruses in the V1/V2 and V3 variable regions. J Virol 90:7142–7158.doi:10.1128/JVI.00441-16.
Editor:K. L. Beemon, Johns Hopkins University
Address correspondence to Ronald Swanstrom, [email protected].
*Present address: Christa B. Sturdevant, Department of Biology, Elon University, Elon, North Carolina, USA.
Supplemental material for this article may be found athttp://dx.doi.org/10.1128 /JVI.00441-16.
oped to assess V3 sequence data to infer coreceptor tropism. The 11/25 charge rule is the simplest algorithm based on the presence of basic amino acids at positions 11 and/or 25 of the V3 loop (positions 1 and 35 are invariant cysteines that form a disulfide bond with each other, creating the intervening loop). However, the 11/25 rule lacks sensitivity in detecting X4 variants compared with phenotypic assays (9), with an Arg residue at position 25 being the least predictive. The position-specific scoring matrix (PSSM) analyzes the entire V3 sequence and predicts X4 variants based on a scoring of the probability of the amino acid at each position being overrepresented among X4 sequences versus R5 sequences (10). The Geno2Pheno (G2P) algorithm (11) also ana-lyzes the entire V3 sequence and provides a quantitative score (false-positive rate [FPR]) representing the probability of falsely predicting an R5 variant as an X4 variant; the validity of this ap-proach has been assessed in several clinical trials (12–16). G2P has been widely used in research and clinical settings, but it requires a preset FPR cutoff to call X4 variants. There is significant uncer-tainty about where to place the FPR cutoff and about the reliability of the FPR values in the intermediate range as representing the frequency of X4 and R5 variants with those intermediate FPR values, creating uncertainty about overcalls and undercalls, espe-cially in the context of X4 evolution and coexisting viral lineages. HIV-1 displays extensive genetic diversity and undergoes rapid evolution within individual hosts (17), and theenvgene has the most sequence diversity of all of the HIV-1 genes, which can often include coexisting distinct lineages within a person. However, cer-tain approaches to the analysis ofenvgenes can confound the interpretation due to the introduction of artifacts into the data set. Bulk PCR amplification of a population of sequences can lead to PCR-mediated recombination, which significantly affects the quality of the phylogenetic analysis (18). Endpoint dilution PCR (EPD PCR) (also called single-genome amplification [SGA] or single-genome sequencing [SGS]) combined with Sanger se-quencing avoids the confounding effect of PCR-mediated recom-bination and allows a true assessment of viral sequences as they appear in the viral population (18,19). EPD PCR is time-consum-ing and labor-intensive, maktime-consum-ing it challengtime-consum-ing to analyze more than a few dozen viral genomes per sample (20–22), which limits the depth of sampling of viral genomes when assessing the com-plexity of the viral population. Recently, viral population studies have started to incorporate deep-sequencing or next-generation sequencing (NGS) technologies that have the capacity to greatly extend the depth of sampling (12,23–28). However, conventional approaches using NGS in HIV-1 population studies have serious limitations in representing an accurate sampling of the original viral population. Artifactual heterogeneity can be introduced due to the preceding PCR step, which introduces misincorporation and recombination (29,30) as well as high rates of sequencing errors associated with NGS, while artifactual homogeneity can be introduced by PCR resampling of the same starting templates (31) and using reference sequences to construct consensus sequences for variable regions. We have overcome these limitations by using the Primer ID sequencing approach to define template sampling depth and reduce the error rate to around 1 in 10,000 nucleotides (32,33).
Here we present a study in which we used the Primer ID ap-proach coupled with Illumina MiSeq paired-end sequencing to reveal the structure of viral populations in the V1/V2 and C2/V3 regions of the HIV-1envgene and to predict coreceptor tropism in
sequence lineages found in chronically infected and post-acute-phase HIV-infected subjects. We also used EPD PCR followed by cloning ofenvgenes for use in pseudotyping to explore the link between genotypic predictions and phenotypic assessment, focus-ing on distfocus-inguishfocus-ing intermediate prediction values. Neither of these approaches (Primer ID NGS or EPD PCR) has been used to examine the presence of X4 variants in samples taken from late-stage subjects. We found that X4/dual-tropic variants form dis-crete lineages within the viral population, typically having G2P FPR scores of⬍2%. The coincident R5 populations in subjects with X4/dual-tropic viruses present were not skewed toward X4-like sequences compared to all-R5 populations or transmitted/ founder viruses. The X4 and R5 populations were genetically iso-lated based on the inability to detect significant recombination between the R5 and X4 populations when V1/V2 and V3 markers were compared. Finally, we suggest sequence determinants of the V3-associated entry phenotype that could explain some of the uncertainty in making an R5 or X4 call associated with viruses with intermediate FPR genotypic scores.
MATERIALS AND METHODS
Study participants and clinical samples.We examined 30 plasma sam-ples from late-stage subjects (with CD4⫹T cell counts of⬍100 cells/mm3)
and 6 plasma samples from early-stage subjects (within the first 2 years of infection). All subjects were infected with subtype B HIV-1, and all sub-jects provided informed consent to participate in protocols that were ap-proved by the Institutional Review Boards (IRBs) at Yale University, UCSF, and UNC. Late-stage samples were obtained at the entry time point from subjects who were enrolled in an early trial of ritonavir (34); some of the subjects had had prior exposure to zidovudine (AZT) and/or lamivu-dine (3TC) as monotherapy, and early-stage subjects were naive to anti-retroviral therapy.
stringent protocol (the ratio of the volume of beads to DNA was 0.6 to 0.8, with the beads being washed 2 times). This step also allowed us to create heterogeneity near the left end of the amplicon (the N4stretch in the
primer) so that there was efficient cluster assignment during the sequenc-ing step. We used the Illumina indexed primers as the second-round reverse PCR primers to tag each sample with a unique bar code, allowing us to multiplex up to 24 libraries in the same sequencing run. The forward and reverse primers for second-round PCR were 5=-AATGATACGG CGACCACCGAGATCTACACGCCTCCCTCGCGCCATCAGAGAT
GTG-3= and 5=-CAAGCAGAAGACGGCATACGAGATNNNNNNGT
GACTGGAGTTCAGACGTGTGCTC-3=, respectively. The 6-nucleotide stretch of N=s represents the position of the 24 Illumina bar codes. Kapa Robust and Kapa High-Fidelity PCR kits (Kapa Biosystems, Woburn, MA) were used for first- and second-round PCR amplification, respec-tively. The second-round PCR products were gel purified by using a QIAquick MinElute gel extraction kit (Qiagen). The recovered DNA was then quantified by using a Qubit 2.0 fluorometer (Life Technologies), and the products were pooled in equal amounts. Library quality was assessed by using the Experion electrophoresis system (Bio-Rad, Hercules, CA).
Illumina sequencing and bioinformatics pipelines.The UNC High Throughput Sequencing Facility performed Illumina MiSeq analysis by using either 250-nucleotide or 300-nucleotide paired-end sequencing. A random PhiX genomic DNA library was mixed with the HIV-1 library pool to increase the complexity between clusters on the flow cell. The Illumina pipeline (v.1.8.2) was used to generate sequence reads with as-signed quality scores. In-house bioinformatics pipelines written in Ruby were used to filter out sequence reads of low quality, link sequence end pairs, capture Primer IDs, and create consensus sequences without a ref-erence sequence. To avoid the inclusion of sequencing errors in the Primer ID sequence tag (offspring Primer IDs) that would create artifac-tual viral genomes, we calculated a cutoff for the number of raw reads needed for each Primer ID to form a template consensus sequence (TCS) based on a simulation to estimate the frequency of offspring Primer IDs with errors. We then used Primer IDs with a number of raw reads above this cutoff to create a TCS for each starting RNA template (33). Addition-ally, TCSs were filtered for large deletions and frameshifts.
EDP PCR and phenotyping of coreceptor usage.envgene clones were generated as previously described (22). In brief, cDNA was generated by using an oligo(dT) primer from viral RNA isolated from blood plasma, followed by EDP PCR (3,18,35) to amplify full-lengthenvgenes for sequencing. DNA sequence alignments of theenvgenes were performed by using ClustalW (36). Sequences for each subject were codon aligned, and phylogenetic trees were generated by using a neighbor-joining method (MEGA5) (37). An additional round of amplification was per-formed to reamplifyenvgenes for the purpose of cloning into the pcDNA 3.1D/V5-His_TOPO expression vector (Life Technologies), and these clones were used for pseudotype virus production.
293T cells were cultured in Dulbecco’s modified Eagle medium (DMEM) with 4.5 g/liter glucose (Mediatech, Manassas, VA) supple-mented with 10% fetal bovine serum (FBS), 50 U/ml penicillin, and 50
g/ml streptomycin. Affinofile cells (38) were also cultured in DMEM but supplemented with 10% dialyzed FBS (12- to 14-kDa cutoff; Atlanta Bi-ologicals, Flowery Branch, GA) and 50 mg/ml blasticidin (Life Technolo-gies).
Env-pseudotyped luciferase reporter viruses were generated by cotransfection of 0.81g of the pNL4-3.LucR-E plasmid (obtained from the NIH AIDS Research and Reference Reagent Program, Division of AIDS, NIAID, NIH), 0.81g of an HIV-1envclone, and 4.9l of Fu-GENE 6 transfection reagent (Promega, Madison, WI) in a total volume of 75l of medium added to 1 well of a 6-well dish seeded with 2.4⫻105
293T cells. At 5 h posttransfection, the medium was replaced, and the cells were incubated at 37°C for 36 to 42 h. Pseudotyped-virus stocks were isolated from the supernatants by filtration though a 0.45-m filter (Mil-lipore, Billerica, MA) prior to storage at⫺80°C. Virus stocks were not subjected to multiple freeze-thaw cycles.
Affinofile cell assays were performed as previously reported (38). In short, Affinofile cells were plated into black poly-L-lysine (Sigma)-treated
96-well plates at a concentration of 1.8⫻104cells/well. Cells were induced
for CCR5 and CD4 expression by using ponasterone A (PonA) (Life Tech-nologies) and doxycycline (Doxy) (Sigma, St. Louis, MO) for 24 h before medium exchange and virus addition (Affinofile cells constitutively ex-press CXCR4). Cells were centrifuged at 2,000 rpm for 2 h at 37°C in the presence of virus to enhance infection (i.e., spinoculated), followed by incubation for 48 h at 37°C, and then washed two times with phosphate-buffered saline (PBS) prior to being lysed with 50l of 1⫻reporter lysis buffer (Promega) and stored at⫺80°C. Viral entry was assessed using the luciferase assay system (Promega) by thawing the lysates and quantifying luciferase expression. Virus stocks were titrated by using Affinofile cells expressing maximum levels of CD4 and CCR5. The amount of virus used for an infection was determined by calculating the volume of virus needed to produce⬃800,000 relative light units (RLU) of luciferase readout, a value near the high end of the linear portion of the dose-response curve for luciferase activity in our assay.
Coreceptor usage was determined by infecting cells in the presence of maraviroc, AMD3100, or maraviroc plus AMD3100 (both obtained from the NIH AIDS Research and Reference Reagent Program, Division of AIDS, NIAID, NIH). The coreceptor phenotype was determined by using Affinofile cells expressing a single high level of CD4 (Doxy) and a high level of CCR5 (PonA). One hour prior to spinoculation, the coreceptor antagonist was added at a single high dose (50M maraviroc, 2M AMD3100, or 50M maraviroc plus 2M AMD3100). After spinocula-tion, the medium was removed and replaced with fresh medium, followed by a 48-h incubation at 37°C. The cells were then washed with PBS, and lysis buffer was added, followed by freezing, thawing, and then assaying for luciferase activity.
Phylogenetic analysis and coreceptor tropism prediction. Full-lengthenvsequences derived from the EPD PCR amplicons from each sample were trimmed to include the same region as that in the NGS consensus sequences. We used MUSCLE (v3.8.1) (39,40) to align se-quencing reads and construct neighbor-joining trees for the V1/V2 region and the C2/V3 region separately. Coreceptor genotyping of V3 sequences from both NGS and EPD PCR was performed by using the G2P algorithm (11) to generate an FPR value.
Nucleotide sequence accession numbers.Raw MiSeq sequencing reads are available at the NCBI Sequence Read Archive (SRA) (SRX1628641, SRX1628643, SRX1628644, SRX1628655, SRX1628657–SRX1628660, SRX1628663, SRX1628670, SRX1628675, SRX1628682, SRX1628688 – SRX1628690, SRX1628697, SRX1628704 –SRX1628706, SRX1628709, SRX1628719, SRX1628720, SRX1628722, SRX1628729, SRX1628731– SRX1628736, SRX1628740, and SRX1628742–SRX1628746).
RESULTS
coming from the same template molecule. We targeted this region for deep-sequencing analysis since the V1/V2 region is the most diverse sequence within the HIV-1 genome, and the V3 region can be used to infer the X4 or R5 entry phenotype for the virus.
cDNA synthesis was done by using a primer that included a 9-nucleotide stretch of randomized bases, an indexing strategy that we have termed Primer ID (32,33); the Primer ID cDNA primer was used just for cDNA synthesis and then removed prior to the PCR step. This allowed each RNA template to be linked to a unique sequence tag that could be identified in a subsequent se-quence analysis. The cDNA was then amplified by PCR using a primer that was complementary to a region in the cDNA primer that was behind the Primer ID sequence tag, with the other PCR primer being a gene-specific upstream/forward primer. This ap-proach largely resolves two significant limitations of the use of NGS for a genetically diverse population that is first amplified by PCR: it allows the recognition of PCR resampling, i.e., the repet-itive sequencing of the original template sequences as represented many times in the PCR product, which is identified by tagging each template with a unique sequence tag, and it allows PCR re-sampling (i.e., sequences with the same Primer ID sequence) to be used to create a TCS for each original template to remove most of the PCR and sequencing errors.
Characteristics of HIV-positive subjects providing plasma samples for sequence analysis.Table 1shows the characteristics of the study subjects and the blood plasma samples provided as well as the number of TCSs that we obtained for each plasma sample. In this initial characterization of the V1-V3envsequence amplicon, we examined samples from 30 subjects late in the course of their HIV-1 infection, as indicated by their low average CD4⫹T cell counts (23 cells/l) and relatively high average viral loads (5.2 log10copies/ml) (Table 1). We also included samples
from six subjects early in infection with a median estimated num-ber of days of infection of 328, a median CD4⫹T cell count of 600 cells/l, and a median viral RNA load of 4.6 log10copies/ml (Table
1). Ten of the late-stage and the six early-stage samples were se-quenced by using the 250-nucleotide paired-end sequencing pro-tocol in one library pool, and the other 20 late-stage samples were sequenced by using the 300-nucleotide paired-end sequencing
protocol in a second pool. The median numbers of TCSs of late-and early-stage subjects were 1,357 late-and 1,532, respectively, de-rived from medians of 557,450 and 170,310 raw reads, respectively (Table 1); given the average number of reads per template in these runs, the low-end read cutoff averaged at least 20 reads per tem-plate to be used for TCS formation (calculated according to meth-ods reported previously [33]). Also, this number of consensus sequences represented a rate of conversion of starting RNA tem-plates to TCSs of between 10% and 30%. We estimate that for most samples, there is a 95% chance of seeing minor variants with a 0.1 to 0.5% abundance, depending on the exact number of TCSs obtained.Figure 1shows the neighbor-joining trees of a subset of TCSs from each clinical sample of both V1/V2 (Fig. 1a) and C2/V3 (Fig. 1b) regions of the 250-nucleotide paired-end pool (100 con-sensus sequences per sample) and the 300-nucleotide paired-end pool (50 TCSs per library) (Fig. 1candd). No cross-sample con-tamination was observed, although a linked pair of primary-infec-tion cases was inferred (subjects P02 and P05). In addiprimary-infec-tion, EPD PCR was used to generateenvgene amplicons for 16 out of 30 late-stage samples and all 6 of the early-stage samples, with an average of 19 EPD amplicons being analyzed per sample and an average of 3 amplicons being cloned per subject for entry analysis of representatives of the majorenvsequence lineages.
Characterization of major and minor lineages by coreceptor tropism prediction.We used the G2P algorithm (11) to infer the presence of X4 or dual-tropic viruses (which we refer to collec-tively as X4 viruses) in these sequence populations under two lev-els of stringency, making X4 calls for sequences with an FPR of
⬍5% and then at the more stringent FPR cutoff of⬍2%.Table 2 shows the numbers and percentages of X4 viruses predicted by G2P (FPR cutoffs of 2.0% and 5.0%) in both NGS and EPD PCR sequences. X4 viruses were detected in 24 out of 30 late-stage subjects by using the 2% FPR cutoff and in 26 samples by using the 5% cutoff. However, the two additional samples (samples C12 and C19) detected by using the 5% cutoff had 1% or less of the total TCSs with FPR scores below 5%, while the majority of the variants in these samples had FPR scores above 5%. Among the 24 samples predicted to have X4 variants at both cutoff stringencies, the 5% FPR cutoff predicted more X4 vari-ants in 17 (71%) samples than did the 2% FPR cutoff. This analysis highlights the uncertainty of the choice of the FPR cutoff value in using this algorithm.
The same algorithm was also used on the samples taken early during infection. G2P with a 2% FPR score did not call any X4 variants in these six samples, while G2P with a 5% FPR score made X4 calls in five samples but with only a small number of TCSs (⬍1% of the population) (Table 2). Thus, we conclude that small changes in the FPR can give discrepant results when estimating the relative abundance of the X4 variant population and can give dis-crepant results when examining samples that are likely to have a low abundance of or no X4 variants, such as early viral popula-tions. Overall, a 5% FPR cutoff called additional X4 variants, largely in low abundance, in approximately two-thirds of the sam-ples taken both early and late during infection.
In the G2P algorithm, each sequence is assigned a specific FPR value to estimate the likelihood of a sequence being from an X4 variant. We plotted all of the assigned FPR values for these se-quences from all of these samples. This analysis showed that groups of sequences within each subject clustered with their FPR values, with there being a number of groups with intermediate
TABLE 1Demographic and clinical characteristics of study subjects and numbers of sequencing readsa
Characteristic
Value for group
Early-stage subjects (n⫽6)
Late-stage subjects (n⫽30)
Median age (yr) (IQR) 40.5 (27.5–49) No. (%) of male patients 6 (100) Median most recent CD4 cell
count (cells/l) (IQR)
600 (556–617) 23 (13–41)
Median most recent HIV RNA level (log10copies/ml) (IQR)
4.64 (4.30–4.83) 5.2 (5.0–5.4)
Median no. of days after infection (IQR)
328 (135–448) NA
Median no. of TCSs (IQR) 1,532 (1,332–1,883) 1,357 (992–1,982) Median sequencing depth (%)
(IQR)b
0.2 (0.16–0.22) 0.22 (0.15–0.33)
aIQR, interquartile range; TCS, template consensus sequence; NA, not applicable. b
values and what appeared to be a tight clustering of low FPR values for those predicted to be X4 variants (Fig. 2). These results suggest that these sequence variants represent distinct lineages with simi-lar FPR values within the host rather than a continuum of vari-ability.
Linkage of FPR scores and phylogenetic lineages of viral pop-ulations based on C2/V3 sequences.In order to examine the pop-ulation structure of these sequences, we created neighbor-joining trees for the sequences from each subject. In this analysis, we col-or-coded the phylogenetic lineages with the FPR score for each sequence, binned as ⱕ2%, ⬎2% andⱕ5%, ⬎5% andⱕ10%,
⬎10% andⱕ20%, and⬎20%. We consider values ofⱕ2% to represent true X4 viruses, values of⬎20% to be true R5 viruses, and values between these two to be intermediate. As shown inFig. 3and Fig. S1 in the supplemental material, for the C2/V3 trees for
the late-stage subjects, the most stringently called X4 sequences (ⱕ2% FPR) are associated with one or more discrete lineages within the population. In some of these samples, there are distinct viral lineages with intermediate FPR values, with the clearest ex-amples being sex-amples C04, C07, C09, C20, and C25. In two sam-ples (samsam-ples C27 and C28), almost all of the sequences have low FPR values (below 2%). In one sample (sample C18), there are FPR scores of between 1.7% and 16% for sequences within one distinct viral lineage, while the remaining portion of the popula-tion has FPR scores of⬎20%. After examining the sequences of the FPR score mixtures in this particular lineage, we found that all sequences in this lineage contain a V3 11K or -R mutation, a dis-ruption in the GPGR crown (GPKR), and other changes not asso-ciated with R5 viruses, consistent with this lineage likely being an X4 lineage but poorly recognized by the G2P algorithm. In all
other cases, the X4 lineages with aⱕ2% FPR were relatively ho-mogeneous in their FPR scores, and these lineages coexisted with other, most often relatively homogeneous, lineages with a range of FPR values usually strongly predicted to be R5, with FPR values of
⬎20%. Thus, another feature of viral populations that carry strongly called X4 viruses is that these sequences represent a dis-tinct lineage within the sequence population.
Overall, we detected clear X4 lineages in 80% of these late-stage subjects (24 of 30). This frequency of X4 variants within people infected with subtype B HIV-1 is higher than previously reported estimates of around 50% (4). The fraction of the viral population in the X4 lineage within each person varied widely, ranging from 3% to 85%. Our ability to detect X4 variants at a higher level may be due to the use of NGS, as about half of the subjects with X4 viruses had a viral population where the X4 lineage comprised
⬍20% of the total viral population. It is important to note that the use of Primer ID is essential in validating the number of genomes queried in this analysis to ensure that our assignment of lineage
abundance is well above our subject-specific measured depth of sampling (i.e., the number of TCSs).
The remaining samples had no strong X4 lineages, including samples C01, C02, C12, C19, C23, and C29 from the late-stage subjects and samples P01 to P06, representing all of the early-stage subjects. However, the lineages within these viral populations in these subjects varied in their FPR values: samples C01, C02, C23, C29, and P03 had strongly R5 lineages; samples C19, P01, P02, P05, and P06 had relatively homogeneous populations with inter-mediate FPR scores; sample P04 had a mixture of lineages with intermediate FPR scores and R5 FPR scores, while the tree topol-ogy is relatively condensed; and sample C12 had two distant lin-eages, one with an FPR score above 20% and the other with an FPR score of around 6%. Based on data from the genotypic analysis alone, it is difficult to assess the significance of the lineages with intermediate FPR scores with respect to their contribution to an X4 phenotype, especially given that strong X4 calls were easily seen as discrete lineages.
TABLE 2Numbers and percentages of X4 variants predicted by using the Geno2pheno[CORECEPTOR]algorithm on sequences assessed by both NGS
and SGA
Sample
No. of C2/V3 sequences No. (%) of X4 variants predicted by Geno2pheno[CORECEPTOR]
NGSa SGA
FPR ofⱕ2.0% FPR ofⱕ5.0%
NGS SGA NGS SGA
C01 1,116 20 0 0 0 0
C02 381 17 0 0 0 0
C03 1,031 23 154 (15) 1 (4) 155 (15) 1 (4)
C04 502 15 102 (20) 2 (13) 424 (85) 12 (87)
C05 1,438 17 670 (47) 8 (47) 672 (47) 8 (47)
C06 616 29 170 (28) 12 (41) 170 (28) 12 (41)
C07 1,248 19 152 (12) 4 (21) 962 (77) 17 (89)
C08 1,610 38 217 (13) 3 (8) 217 (13) 3 (8)
C09 2,108 38 401 (19) 3(8) 579 (28) 6 (16)
C10 808 24 66 (8) 10 (42) 66 (8) 10 (42)
C11 900 266 (30) 267(30)
C12 1,353 14 0 0 13 (1) 0
C13 2,230 200 (9) 201 (9)
C14 2,334 523 (22) 524 (22)
C15 988 178 (18) 178 (18)
C16 855 36 657 (77) 28 (78) 670 (78) 28 (78)
C17 635 111 (17) 111 (17)
C18 1,361 74 (5) 164 (12)
C19 787 0 2 (0.3)
C20 2,626 154 (6) 161 (6)
C21 1,141 12 30 (3) 0 1,102 (97) 8 (67)
C22 1,418 203 (14) 207 (15)
C23 1,247 0 0
C24 2,019 92 (5) 92 (5)
C25 1,431 18 228 (16) 2 (11) 1,381 (17) 2 (11)
C26 2,166 333 (15) 336 (16)
C27 1,791 19 304 (5) 1 (5) 1,790 (100) 19 (100)
C28 1,868 19 1,585 (85) 17 (89) 1,869 (100) 19 (100)
C29 2,856 0 0
C30 3,103 841 (27) 841 (27)
P01 2,732 19 0 0 8 (0.1) 0
P02 1,464 17 0 0 4 (0.3) 0
P03 1,963 20 0 0 0 0
P04 669 11 0 0 1 (0.1) 0
P05 1,552 9 0 0 4 (0.3) 0
P06 1,277 10 0 0 2 (0.2) 0
Another layer of complexity in interpreting the genotypic calls for the entire population was the presence of one or two sequence variants with more X4-like FPR scores embedded within a lineage with a higher FPR score. For example, a majority of the sequences in samples P01, P02, and P05 had intermediate FPR scores of between 5% and 20%. However, a total of 7 distinct sequences had stronger X4 calls (FPR of 2 to 5%). None of these sequences formed a distinct lineage. Only one nucleotide substitution distin-guished these sequences within each lineage, and none of them had an amino acid substitution typically associated with X4 vi-ruses. Sample C07 had 3 major lineages with distinct FPR values that are labeled in red (ⱕ2%), orange (2 to 5%), and green (⬎20%) inFig. 3. Several sequences with FPR scores ofⱕ2% were found in the lineage with the intermediate FPR value. However, these sequences had just one nucleotide difference from the lin-eage consensus sequence and did not themselves form a discrete lineage. Thus, we conclude that the strongest X4 calls (ⱕ2% FPR) are associated with discrete lineages of sequences within the pop-ulation and that weaker X4 calls either identify lineages with in-termediate values or represent occasional sequence variants inter-mingled with lineages with stronger R5 calls. The appearance of a single X4-like sequence variant differing by a single nucleotide
from the consensus sequence of the lineage could be the result of a residual sequencing error, which should represent a total of about 25 single nucleotide polymorphisms introduced into a data set of 1,000 C2/V3 sequences based on an error rate of 1 in 10,000 nu-cleotides sequenced (33).
Entry phenotype associated with major lineages.In an effort to link the X4, intermediate, and R5 FPR scores with the pheno-type of specific lineages, we created full-lengthenvgene expression vectors for the major lineages within these subjects. We first used EPD PCR to create a series of amplicons for sequencing and com-parison to the lineages identified by using the C2/V3 MiSeq-gen-erated sequences. The number of amplicons sequenced for each sample and the genotypic predictions are shown inTable 2. Given the comparatively low number of genomes analyzed by this method (⬃20 per sample), we would not expect the percentage of X4 variants to recapitulate the percentage of X4 variants identified by the much larger sample size of sequences obtained by deep sequencing. However, we were interested in identifying variants from each of the major C2/V3 lineages. Amplicons were selected based on sequence similarity to the major C2/V3 sequence lin-eages, andenvexpression clones were generated.
Theenvclones were used to generate pseudotyped viruses with
FIG 2Distribution of Geno2pheno[CORECEPTOR]false-positive rates among viral populations. P01 to P06 are six samples from subjects early during infection.
the expressed Env protein on the virion generated by coexpression with anenvdeletion genome that contained a reporter gene (lu-ciferase) that was used to identify subsequent infectious events. Using Affinofile cells, we were able to test the entry phenotype predicted by the genotype by testing individually isolated env
genes from the same samples that represented the major lineages identified by NGS. Affinofile cells have inducible CCR5 and CD4 but constitutively express CXCR4. Maraviroc and AMD3100, co-receptor inhibitors for R5 and X4 viruses, respectively, were used under the following three conditions to discern between
CCR5-FIG 3Phylogenetic trees of the C2/V3 region for study samples showing different Geno2pheno[CORECEPTOR]FPRs among viral populations. Brown arrows
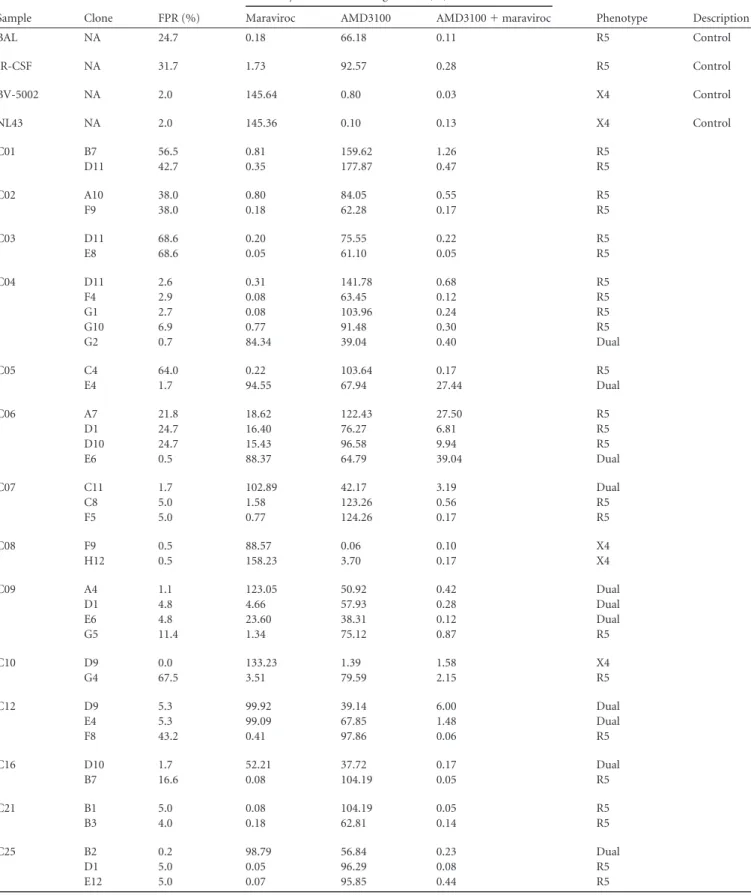
tropic, CXCR4-tropic, and dual-tropic viruses: (i) maraviroc only, (ii) AMD3100 only, or (iii) maraviroc plus AMD3100.Table 3summarizes the phenotypic testing results as well as FPR scores for each clone. InFig. 3, the brown arrows indicate the C2/V3 lineage with the sequence most similar to that of the clone. Clone names and their phenotypic tropisms are also labeled along with the brown arrows. In total, we tested 4 controlenvgenes and 49 newenvgenes in these experiments, where 15envclones encoded Env proteins that showed dual tropism, 3 encoded Env proteins that showed CXCR4 tropism, and 31 encoded Env proteins that showed CCR5 tropism. All of the 14envclones with FPR scores of
⬍2% encoded Env proteins that were X4 or dual-tropic viruses, consistent with the reliability of an inference of CXCR4 tropism associated with a low FPR score. All of the 13envclones with FPR scores of⬎20% encoded Env proteins that were CCR5 tropic, consistent with the 20% cutoff being a reliable call for R5 viruses. In addition, noenvclones from the early-stage subjects encoded Env proteins that were X4 variants.
We next explored the env clones with intermediate FPR scores in an attempt to clarify the determinants of CXCR4 tro-pism in the X4 viruses with intermediate FPR scores. There were 22 viralenvgene clones with FPR values that were spread between 2.1 and 20%; of these, 4 encoded Env proteins that were X4/dual tropic (the rest were CCR5 tropic), and all 4 of these clones had FPR values of⬍6% (as did 5 other R5env
clones). All of the 11 clones with FPR scores of between 6% and 20% encoded Env proteins that were CCR5-only viruses. We then inspected the V3 sequences associated with intermediate FPR scores (n⫽ 22 clones).Figure 4shows the V3 loop se-quences of these intermediate clones as well as their FPR scores and phenotypes. While the data set is too small to allow statis-tical analysis, inspection of the sequences suggests several paths to consider concerning how to predict a phenotype from these intermediate genotypic scores/sequences. In general, sequences with intermediate values frequently have added basic amino acid substitutions, but these substitutions alone do not explain the pattern of measured phenotypes. Thus, it is useful to think of other key sites as potentially enabling the phenotypic expres-sion of the basic substitutions, with these enabling mutations either being linked to the X4 phenotype or at least being a polymorphism that is compatible with the X4 phenotype. At one extreme, subject C04 had several clones that contained a 25R substitution and a low FPR score (⬍3.0%) but were R5 viruses based on their phenotype. Since 25R can appear in both R5 and X4 viruses, there must be additional determinants needed to realize the X4 phenotype. In this subject, both posi-tions 20 and 21 were mutated to aliphatic amino acids in the cocirculating X4 viruses, in addition to other X4-related sub-stitutions, suggesting that these positions may regulate the ex-pression of the X4 phenotype for basic substitutions in some cases. While this analysis is very exploratory, among all 13 exam-ples with intermediate FPR values of between 2 and 6%, X4 vari-ants met the following criteria: the presence of one or more basic amino substitutions at positions 13, 23, 24, 25, and 32 (in addition to position 11) and the substitution of an aliphatic amino acid at either position 20 or 21 (and, based on skewing in X4 populations, perhaps including position 19), whereas the R5 variants with in-termediate FPR scores did not meet these criteria.
Comparison of G2P FPR scores of transmitted/founder vi-ruses and late-stage viral lineages.Most of our late-stage samples
contained one or more X4 viral lineages. In contrast, the transmit-ted/founder (T/F) viruses are typically R5 viruses (3). We were interested in the possibility that the lineages with intermediate FPR scores in late-stage subjects are skewed toward the X4 popu-lation or in determining whether they represent a normal distri-bution of R5 lineages. In order to compare the predicted corecep-tor usage/FPR scores of founder viruses and late-stage viral lineages, we downloaded aligned sequences from 104 acutely in-fected subjects, as described previously by Keele et al. (3). The consensus sequence was used to represent each T/F virus, and an FPR score was determined for each V3 sequence. For comparison, all viral lineages with abundances of⬎1% in the deep-sequencing analysis were used from the viral population from the late-stage subjects. A total of 153 lineages were identified from the 30 late-stage samples (Fig. 5A). The FPR scores for all of these lineages from the late-stage subjects were significantly lower (Fig. 5A) than those for T/F viruses (Fig. 5C). However, the range of FPR scores of the single major lineage in each subject sample (Fig. 5B) was comparable with that of the T/F viruses (Fig. 5C). When we ex-cluded the X4 lineages from the late-stage subjects with FPR scores ofⱕ2%, the FPR scores of the remaining late-stage viral lineages (Fig. 5D) or the single major lineage from each subject (Fig. 5E) were comparable to the FPR scores of the T/F viruses, regardless of whether we included all of the T/F viral sequences (Fig. 5C) or excluded the few T/F viral sequences with FPR values of⬍2% (Fig. 5F). We further separated the late-stage viral lineages with FPR scores of⬎2% into those from R5-only samples (Fig. 5G) and those from mixed R5/X4 samples (Fig. 5H). The distributions of FPR scores of R5 lineages (FPR score ofⱖ2%) in the samples that also had an X4 lineage (Fig. 5H) were similar to those of the founder viruses (Fig. 5F). The distribution of FPR scores in the R5-only samples (Fig. 5G) also did not differ significantly from the distribution of FPR scores in the samples with X4 lineages when the lineages with FPR scores ofⱕ2% were excluded (Fig. 5H). Overall, we conclude that the distribution of FPR scores for the lineages with scores of⬎2% are similar between samples that have an X4 viral lineage (FPR score ofⱕ2%) and those that do not, regardless of whether the virus is isolated early or late during in-fection. This observation reinforces the ideas that the X4 lineages represent a specific clade within the viral population and that there is not a general shift toward X4-like sequences, as assessed by the FPR score, in subjects who evolve an X4 lineage.
TABLE 3Phenotyping of 4envcontrols and 49envisolates from 19 samples
Sample Clone FPR (%)
Infectivity vs that for no-drug control (%)
Phenotype Description
Maraviroc AMD3100 AMD3100⫹maraviroc
BAL NA 24.7 0.18 66.18 0.11 R5 Control
JR-CSF NA 31.7 1.73 92.57 0.28 R5 Control
BV-5002 NA 2.0 145.64 0.80 0.03 X4 Control
NL43 NA 2.0 145.36 0.10 0.13 X4 Control
C01 B7 56.5 0.81 159.62 1.26 R5
D11 42.7 0.35 177.87 0.47 R5
C02 A10 38.0 0.80 84.05 0.55 R5
F9 38.0 0.18 62.28 0.17 R5
C03 D11 68.6 0.20 75.55 0.22 R5
E8 68.6 0.05 61.10 0.05 R5
C04 D11 2.6 0.31 141.78 0.68 R5
F4 2.9 0.08 63.45 0.12 R5
G1 2.7 0.08 103.96 0.24 R5
G10 6.9 0.77 91.48 0.30 R5
G2 0.7 84.34 39.04 0.40 Dual
C05 C4 64.0 0.22 103.64 0.17 R5
E4 1.7 94.55 67.94 27.44 Dual
C06 A7 21.8 18.62 122.43 27.50 R5
D1 24.7 16.40 76.27 6.81 R5
D10 24.7 15.43 96.58 9.94 R5
E6 0.5 88.37 64.79 39.04 Dual
C07 C11 1.7 102.89 42.17 3.19 Dual
C8 5.0 1.58 123.26 0.56 R5
F5 5.0 0.77 124.26 0.17 R5
C08 F9 0.5 88.57 0.06 0.10 X4
H12 0.5 158.23 3.70 0.17 X4
C09 A4 1.1 123.05 50.92 0.42 Dual
D1 4.8 4.66 57.93 0.28 Dual
E6 4.8 23.60 38.31 0.12 Dual
G5 11.4 1.34 75.12 0.87 R5
C10 D9 0.0 133.23 1.39 1.58 X4
G4 67.5 3.51 79.59 2.15 R5
C12 D9 5.3 99.92 39.14 6.00 Dual
E4 5.3 99.09 67.85 1.48 Dual
F8 43.2 0.41 97.86 0.06 R5
C16 D10 1.7 52.21 37.72 0.17 Dual
B7 16.6 0.08 104.19 0.05 R5
C21 B1 5.0 0.08 104.19 0.05 R5
B3 4.0 0.18 62.81 0.14 R5
C25 B2 0.2 98.79 56.84 0.23 Dual
D1 5.0 0.05 96.29 0.08 R5
E12 5.0 0.07 95.85 0.44 R5
for each virus. These two endpoint dilutions had been sequenced separately and had 9 nucleotide differences in the V1-through-V3 region. After mixing, downstream steps of PCR amplification and sequence analysis were carried out. We found that recombinants between the two different samples had formed but only at a low level (⬃0.1%) (S. K. Lee, S. Zhou, P. L. Baldoni, E. Spielvogel, N. M. Archin, M. G. Hudgens, D. M. Margolis, and R. Swanstrom, submitted for publication). While more recombinants were likely present after the PCR step, the construction of a TCS for each template obscures their presence, since they would rarely become the majority sequence for that template.
Figure 6shows the neighbor-joining trees of the V1/V2 region and the C2/V3 region for four samples. X4 and R5 viral lineages are indicated, and the different V1/V2 lineages are color-coded. In sample C03 (Fig. 6A), there is a distinct lineage in the V1/V2 tree (V1/V2 lineage D [V1V2-D]) linked to the X4 C2/V3 lineage, and the three other V1/V2 lineages form the major R5 lineage in the
C2/V3 tree. Thus, recombination between the X4 and R5 viruses between V1 and V3 was extremely rare, while different R5 V3 lineages were linked with several different V1/V2 lineages, consis-tent with recombination. Sample C05 (Fig. 6B) had seven distinct V1/V2 lineages (lineages A to G), three of which were associated with the major R5 V3 lineage (lineages V1V2-A, -B, and -C with C2/V3 R5 lineage 1) and four of which were associated with the two X4 virus lineages (lineages V1V2-D, -E, -F, and -G with C2/V3 X4 lineages 2 and 3); there appeared to be extensive mixing/re-combination between the two C2/V3 X4 lineages and their V1/V2 lineages but very little mixing/recombination between the X4 lin-eages and the R5 lineage. In sample C10 (Fig. 6C), there were four major V1/V2 lineages, and each one was strongly associated with a separate C2/V3 lineage, three of which were R5 and one of which was X4. In this case, all four lineages appeared to be replicating independently without mixing through recombination. Linked G2P V3 scores were used to color-code the V1/V2 trees for all
TABLE 3(Continued)
Sample Clone FPR (%)
Infectivity vs that for no-drug control (%)
Phenotype Description
Maraviroc AMD3100 AMD3100⫹maraviroc
C27 D1 0.2 80.77 57.49 0.30 Dual
F4 1.8 22.37 92.32 0.50 Dual
C28 D9 1.7 62.16 33.30 0.37 Dual
F3 1.9 76.52 71.27 0.70 Dual
P04 B6 6.0 0.12 89.75 0.08 R5
E12 41.2 3.03 85.81 2.64 R5
G6 10.2 2.03 83.84 1.94 R5
P05 A10 7.0 6.52 88.10 7.46 R5
B8 7.0 4.48 86.71 4.70 R5
P06 D10 16.9 0.26 62.59 0.28 R5
D12 16.9 0.35 92.78 0.25 R5
remaining samples with mixed R5 and X4 populations, and these trees are shown in Fig. S2 in the supplemental material. In sum-mary, all X4 lineages with FPRs ofⱕ2% have little to no detectable recombination with R5 lineages within X4-containing samples.
In one early-stage sample, sample P04 (Fig. 6D), all of the se-quences suggested R5 viruses, but there were a number of C2/V3 lineages based on distinct polymorphisms. Conversely, there were multiple distinct V1/V2 lineages (labeled in different colors inFig. 6D). When these patterns were combined, it was clear that there were some C2/V3 lineages (lineages 1 and 3) that had sampled most (but not all) of the V1/V2 lineages, some C2/V3 lineages that had relatively few recombinants (lineages 2, 4, and 5), and one C2/V3 lineage largely composed of a linkage to just two V1/V2 lineages (C2/V3 lineage 6). These patterns suggest several stages of population mixing and isolation coexisting within this infected person.
DISCUSSION
We have used two approaches to analyze viral sequence popula-tions that have not previously been applied to the examination of HIV-1 populations late in the disease course. The traditional use
of PCR results in the introduction of PCR-mediated recombina-tion (18), which can disrupt linkages within the population, con-founding the analysis of phylogenetic relationships. PCR itself in-cludes misincorporation, and NGS platforms suffer from both the problem of requiring a prior PCR step and having a relatively high rate of errors in the sequence data set. By using endpoint dilution PCR to generate full-lengthenvgenes and Primer ID NGS to sam-ple the viral population in depth, we have been able to characterize these late-stage viral populations in the absence of these con-founding technical artifacts. Using these approaches, we have found that most stringently called X4 variants are usually clus-tered in distinct lineages, that conventional prediction algorithms have difficulties in predicting X4 variants with intermediate scores, and that there is limited recombination between X4 and R5 variants.
Most current approaches using NGS to study HIV-1 tions have serious limitations in accurately sampling the popula-tion. First, most approaches usually require a preceding PCR amplification step. Thus, PCR errors, including nucleotide misin-corporation by the polymerase, PCR recombination, and PCR resampling, may alter diversity as well as skew the allelic
cies (29,30). Second, in some approaches, the amplicons are first sheared before sequencing, and the sequencing reads are aligned with a reference sequence (41). With this approach, it is difficult to perform linkage analysis and estimate allelic frequencies. Third, sequencing errors can also introduce artificial diversity into the population. For instance, 454 pyrosequencing was broadly used in coreceptor tropism deep-sequencing studies, but it suffers from severe homopolymer errors, while the homopolymer issue is not a feature of the MiSeq platform used in this study (42,43);
further-more, the homopolymer problem is a feature of all platforms that allow multiple or continuous additions of nucleotides where the number of additions in a homopolymer region must be inter-preted by downstream software analysis. In addition, some studies use a reference sequence in their bioinformatics pipelines to com-plement the false insertions and deletions due to the homopoly-mer errors. This approach can be problematic when processing sequencing data from highly variable regions such as the V3 loop of the HIV-1envgene, as it may create artificial alleles.
The Primer ID sequencing approach coupled with the MiSeq platform overcomes these serious limitations of conven-tional deep sequencing of genetically diverse viral populations by addressing the sampling depth, greatly reducing the se-quencing error rate, and largely removing PCR-mediated re-combination artifacts. This allowed us to perform a phyloge-netic analysis where one TCS corresponds to one original viral template/genome, thus validating the level of viral population sampling for each patient sample analyzed. EDP PCR accom-plishes these same features of characterizing viral populations and has the advantage of permitting the generation of longer amplicons (such as intactenvgenes) but has the limitation of a modest sampling depth compared to what is easily achieved by using next-generation sequencing. We took advantage of the strengths of these two approaches to examine X4 populations that evolve late in the HIV-1 disease course.
The most widely used entry-phenotype-predicting algo-rithm is Geno2Pheno[CORECEPTOR], which ascribes a
false-pos-itive rate value to a given V3 sequence to determine the prob-ability of that sequence being from an X4 or dual-tropic virus based on an analysis of a large data set of viruses that were both sequenced and phenotyped (6). The MOTIVATE clinical trial showed that an FPR below 2% was strongly associated with treatment failure when the CCR5 inhibitor maraviroc was in-cluded in a multidrug regimen, and FPR values of between 2 and 5.75% were associated with a loss of antiviral activity of this inhibitor. Based on data from these trials, some guidelines suggest the use of an FPR value of 5.75% to predict X4/dual-tropic viruses or, even more conservatively, a 20% FPR cutoff. It seems clear that assignment of an X4 phenotype to a se-quence with an FPR value of⬍2% has a very high probability of being correct (all 14 clones tested from 12 subjects in our data set were X4/dual tropic when the FPR value was⬍2%), and a similar argument can be made for an R5 phenotype when the FPR value is⬎20% (all 13 clones tested from 8 subjects in our data set were R5 when the FPR value was⬎20%). However, we were also interested in determining if detailed information about the population structure could add information about the sequences with FPR values of between 2% and 20%, where 4 of the 22 clones tested from 10 subjects were X4/dual tropic. Focusing just on lineages with FPR values of⬍2%, we found such lineages in 80% of this study population of subjects with late-stage disease, a value higher than what was previously seen, suggesting that next-generation sequencing can increase the sensitivity of detection of these variants.
We used several approaches to gain a better understanding of the meaning of variants with intermediate FPR values (between 2% and 20%). Overall, we observed that the distribution of FPR values of HIV-1 variants in individual subjects was not continu-ous; among late-stage subjects, the FPR values were similar within specific sequence lineages and could differ significantly between lineages within the same subject. Sequences with an FPR ofⱕ2% were usually, but not always, clustered in a single distinct lineage. We attempted to determine if there was additional information about the presence of X4 viruses with FPR values above 2% in these subjects. However, the distribution of variants with FPR values above 2% in subjects with X4 viruses (i.e., with FPR lineages ofⱕ2%) was not distinguishable from either a panel of transmit-ted/founder viruses or the lineages present in late-stage subjects who did not have an X4 lineage (defined as an FPR ofⱕ2%)
(Fig. 2and5). We did not see evidence of a genotypic history of a gradual shift in FPR values resulting in the strong X4 lineage, suggesting that these viruses do not grow out to be an appreciable fraction of the population until they have a strong X4 signal. This conclusion is limited due to the fact this is a cross-sectional anal-ysis of late-stage subjects, although in half of the subjects with X4 variants, this lineage represented⬍20% of the population, rang-ing down to 3%.
We also examined the V3 sequences themselves to see if there were clues that might distinguish between X4 and R5 variants within the FPR range of 2% to 20% in our data set. The premise was that the G2P database may be incomplete in its ability to assess rare V3 sequences, while other algorithms could be designed to compensate for this limitation. We also note that there were three
envgene clones (from subjects C05 and C06) whose encoded pro-teins retained some infectivity in the presence of both the CCR5 and CXCR4 inhibitors. It was reported previously that CCR5-tropic but maraviroc-resistant variants can use inhibitor-bound CCR5 (44). The threeenvclones from this study may encode Env proteins that are examples of a naturally occurring CCR5-tropic maraviroc-resistant virus, or they may use coreceptors other than CCR5 or CXCR4.
Given a deep-sequencing view of the V3 sequence popula-tion, we propose the following steps for interpretation of the data. First, a clear lineage of sequences with FPR values ofⱕ2% are scored as X4/dual-tropic variants. We also propose that spurious or isolated sequences within an otherwise homoge-neous FPR lineage should be interpreted as the bulk of the lineage rather than as isolated FPR values of single sequences, which could still be impacted by rare sequencing errors; thus, FPR assignments should be made for distinct lineages, which brings attention to the necessity of documenting the depth of sampling by using an approach like Primer ID. Conversely, lineages with an FPR of⬎20% should be uniformly treated as R5 lineages. This leaves the question of how to interpret lin-eages with FPR values of between 2% and 20%. We found one case where the entire lineage was of mixed FPR values, where inspection of the V3 sequences clearly suggested that this was an X4 lineage (with 11K and -R variants). Examination of the more homogeneous lineages of V3 sequences with FPR values of between 2% and 20% provided hints about how to improve the R5/X4 calls in this ambiguous region. Specifically, observ-ing the presence or absence of basic amino acid substitutions at positions 11,13, 23, 24, 25, and 32 with an aliphatic amino acid (V or I) at position 20 or 21 correctly called 18 phenotyped clones with these in-between FPR values (⬎2% and⬍20%). The use of EDP PCR for generating our amplicons for cloning ensured no fortuitous recombination in the construction of the clones, but this requirement limits the number of phenotyped clones available to extend this initial correlation. The use of site-directed mutagenesis could provide some support for this suggestion, although the role of background mutations in de-fining the evolutionary pathways for V3 is poorly understood. Several previously reported studies used deep sequencing to predict HIV-1 coreceptor usage by sequencing of the HIV-1env
the viral population, as seen in the MERIT and MOTIVATE co-hort studies (12,13,49). However, the predetermined FPR is ar-bitrary, and our data show that an FPR of between 2% to 6% can indicate either X4 or R5 variants. Meanwhile, without defining the sampling depth and correcting PCR resampling, the percentage of X4 variants detected is the percentage of X4 sequences in the PCR amplicon instead of the abundance of X4 variants among the viral genomes. Thus, the 2% cutoff in the viral population is also arbi-trary and inaccurate, since there is no knowledge of how many templates/genomes were sampled. Several studies claimed that 10 to 20% of viruses from primary infection or transmitted viruses could be X4 variants by deep sequencing of the V3 loop (45,48). We believe that these conclusions are compromised by the flawed sequencing methods and bioinformatics determination of X4 variants, and a more accurate approach, such as Primer ID se-quencing coupled with phylogenetic analysis, should be used for such types of studies.
Each viral particle contains two copies of the viral genome. Typically, the two copies of the genome are identical, being transcribed from the same provirus. When multiple viruses infect the same host cell, virions containing two different ge-nomes can be produced. When these heterodimeric viruses in-fect target cells, reverse transcriptase can switch back and forth between the two templates during DNA synthesis; thus, recom-binant viruses can be produced (50). Recombination plays an important role in viral evolution (51). In this study, we found that the X4 and R5 variants in the same host displayed limited evidence of recombination between these variants. All X4 and R5 variants had distinct V1/V2 and C2/V3 regions. In contrast, in individuals with multiple X4 lineages or R5 lineages, we observed extensive recombination within X4 or R5 variants. This observation suggests that R5 and X4 variants are compart-mentalized in different host cell types, or alternatively, their recombinants have low fitness and do not grow out in the viral population. Several previous studies have shown that X4 vari-ants preferentially infect naive T cells and that R5 varivari-ants pref-erentially infect memory T cells (52–54). However, one study observed that the level of integration is lower in resting naive T cells than in memory T cells regardless of the coreceptor tro-pisms within the viral population (55).
In conclusion, Primer ID deep sequencing provides a novel approach to study genetic structures of viral populations. X4 vari-ants may be more prevalent than previously reported when as-sessed by using NGS and with a sufficient depth of sampling. Phy-logenetic analysis to identify lineages of sequences with low FPR values may provide additional information for accurately predict-ing X4 variants by uspredict-ing V3 sequences. Limited recombination occurs between X4 and R5 lineages, suggesting that X4 and R5 variants are genetically isolated and may be replicating in different cell types.
ACKNOWLEDGMENTS
UNC is pursuing IP protection for Primer ID, and R.S. is listed as a coin-ventor and has received nominal royalties.
We thank the UNC High Throughput Sequencing Facility for per-forming MiSeq sequencing.
R.S. supervised the project. S.Z. designed and performed deep se-quencing. M.M.B. and C.B.S. performed endpoint dilution PCR and bulk sequencing. M.M.B. and B.M.H. performed the phenotypic entry assays. S.Z. performed deep-sequencing analysis and phylogenetic analysis. S.Z.
and R.S. wrote the manuscript. M.M.B. provided critical revision to the manuscript.
This work was supported by NIH grants R21 AI108539 and R37 AI44667 to R.S. This work was also supported by the UNC Center for AIDS Research (NIH award P30 AI50410) and the UNC Lineberger Com-prehensive Cancer Center (NIH award P30 CA16068).
FUNDING INFORMATION
This work, including the efforts of Shuntai Zhou and Ronald Swanstrom, was funded by HHS | National Institutes of Health (NIH) (AI108539). This work, including the efforts of Shuntai Zhou, Maria M. Bednar, Christa B. Sturdevant, Blake M. Hauser, and Ronald Swanstrom, was funded by HHS | National Institutes of Health (NIH) (AI44667, AI50410, and CA16068).
The funders had no role in study design, data collection and interpreta-tion, or the decision to submit the work for publication.
REFERENCES
1.Chan DC, Kim PS.1998. HIV entry and its inhibition. Cell93:681– 684. http://dx.doi.org/10.1016/S0092-8674(00)81430-0.
2.Wyatt R, Sodroski J.1998. The HIV-1 envelope glycoproteins: fusogens, antigens, and immunogens. Science280:1884 –1888.http://dx.doi.org/10 .1126/science.280.5371.1884.
3.Keele BF, Giorgi EE, Salazar-Gonzalez JF, Decker JM, Pham KT, Salazar MG, Sun C, Grayson T, Wang S, Li H, Wei X, Jiang C, Kirchherr JL, Gao F, Anderson JA, Ping LH, Swanstrom R, Tomaras GD, Blattner WA, Goepfert PA, Kilby JM, Saag MS, Delwart EL, Busch MP, Cohen MS, Montefiori DC, Haynes BF, Gaschen B, Athreya GS, Lee HY, Wood N, Seoighe C, Perelson AS, Bhattacharya T, Korber BT, Hahn BH, Shaw GM.2008. Identification and characterization of trans-mitted and early founder virus envelopes in primary HIV-1 infection. Proc Natl Acad Sci U S A105:7552–7557.http://dx.doi.org/10.1073/pnas .0802203105.
4.Brumme ZL, Goodrich J, Mayer HB, Brumme CJ, Henrick BM, Wyn-hoven B, Asselin JJ, Cheung PK, Hogg RS, Montaner JS, Harrigan PR. 2005. Molecular and clinical epidemiology of CXCR4-using HIV-1 in a large population of antiretroviral-naive individuals. J Infect Dis192:466 – 474.http://dx.doi.org/10.1086/431519.
5.Su Z, Gulick RM, Krambrink A, Coakley E, Hughes MD, Han D, Flexner C, Wilkin TJ, Skolnik PR, Greaves WL, Kuritzkes DR, Reeves JD, AIDS Clinical Trials Group A5211 Team.2009. Response to vicri-viroc in treatment-experienced subjects, as determined by an enhanced-sensitivity coreceptor tropism assay: reanalysis of AIDS clinical trials group A5211. J Infect Dis 200:1724 –1728. http://dx.doi.org/10.1086 /648090.
6.Vandekerckhove LP, Wensing AM, Kaiser R, Brun-Vezinet F, Clotet B, De Luca A, Dressler S, Garcia F, Geretti AM, Klimkait T, Korn K, Masquelier B, Perno CF, Schapiro JM, Soriano V, Sonnerborg A, Vandamme AM, Verhofstede C, Walter H, Zazzi M, Boucher CA, European Consensus Group on Clinical Management of Tropism Test-ing. 2011. European guidelines on the clinical management of HIV-1 tropism testing. Lancet Infect Dis11:394 – 407.http://dx.doi.org/10.1016 /S1473-3099(10)70319-4.
7.Huang CC, Tang M, Zhang MY, Majeed S, Montabana E, Stanfield RL, Dimitrov DS, Korber B, Sodroski J, Wilson IA, Wyatt R, Kwong PD. 2005. Structure of a V3-containing HIV-1 gp120 core. Science310:1025– 1028.http://dx.doi.org/10.1126/science.1118398.
8.De Jong JJ, De Ronde A, Keulen W, Tersmette M, Goudsmit J.1992. Minimal requirements for the human immunodeficiency virus type 1 V3 domain to support the syncytium-inducing phenotype: analysis by single amino acid substitution. J Virol66:6777– 6780.
9.Low AJ, Dong W, Chan D, Sing T, Swanstrom R, Jensen M, Pillai S, Good B, Harrigan PR.2007. Current V3 genotyping algorithms are in-adequate for predicting X4 co-receptor usage in clinical isolates. AIDS 21:F17–F24.http://dx.doi.org/10.1097/QAD.0b013e3282ef81ea. 10. Garrido C, Roulet V, Chueca N, Poveda E, Aguilera A, Skrabal K,
11. Lengauer T, Sander O, Sierra S, Thielen A, Kaiser R.2007. Bioinfor-matics prediction of HIV coreceptor usage. Nat Biotechnol25:1407–1410. http://dx.doi.org/10.1038/nbt1371.
12. Swenson LC, Mo T, Dong WW, Zhong X, Woods CK, Jensen MA, Thielen A, Chapman D, Lewis M, James I, Heera J, Valdez H, Harrigan PR.2011. Deep sequencing to infer HIV-1 co-receptor usage: application to three clinical trials of maraviroc in treatment-experienced patients. J Infect Dis203:237–245.http://dx.doi.org/10.1093/infdis/jiq030. 13. Swenson LC, Mo T, Dong WW, Zhong X, Woods CK, Thielen A, Jensen
MA, Knapp DJ, Chapman D, Portsmouth S, Lewis M, James I, Heera J, Valdez H, Harrigan PR.2011. Deep V3 sequencing for HIV type 1 tro-pism in treatment-naive patients: a reanalysis of the MERIT trial of mara-viroc. Clin Infect Dis53:732–742.http://dx.doi.org/10.1093/cid/cir493. 14. Sanchez V, Masia M, Robledano C, Padilla S, Lumbreras B, Poveda E,
De Mendoza C, Soriano V, Gutierrez F.2011. A highly sensitive and specific model for predicting HIV-1 tropism in treatment-experienced patients combining interpretation of V3 loop sequences and clinical pa-rameters. J Acquir Immune Defic Syndr56:51–58.http://dx.doi.org/10 .1097/QAI.0b013e3181fc012b.
15. McGovern RA, Thielen A, Portsmouth S, Mo T, Dong W, Woods CK, Zhong X, Brumme CJ, Chapman D, Lewis M, James I, Heera J, Valdez H, Harrigan PR.2012. Population-based sequencing of the V3-loop can predict the virological response to maraviroc in treatment-naive patients of the MERIT trial. J Acquir Immune Defic Syndr61:279 –286.http://dx .doi.org/10.1097/QAI.0b013e31826249cf.
16. Kagan RM, Johnson EP, Siaw MF, Van Baelen B, Ogden R, Platt JL, Pesano RL, Lefebvre E.2014. Comparison of genotypic and phenotypic HIV type 1 tropism assay: results from the screening samples of Cenicri-viroc Study 202, a randomized phase II trial in treatment-naive subjects. AIDS Res Hum Retroviruses30:151–159.http://dx.doi.org/10.1089/aid .2013.0123.
17. Holmes EC, Zhang LQ, Simmonds P, Ludlam CA, Brown AJ.1992. Convergent and divergent sequence evolution in the surface envelope gly-coprotein of human immunodeficiency virus type 1 within a single in-fected patient. Proc Natl Acad Sci U S A89:4835– 4839.http://dx.doi.org /10.1073/pnas.89.11.4835.
18. Salazar-Gonzalez JF, Bailes E, Pham KT, Salazar MG, Guffey MB, Keele BF, Derdeyn CA, Farmer P, Hunter E, Allen S, Manigart O, Mulenga J, Anderson JA, Swanstrom R, Haynes BF, Athreya GS, Korber BT, Sharp PM, Shaw GM, Hahn BH.2008. Deciphering human immunodeficiency virus type 1 transmission and early envelope diversification by single-genome amplification and sequencing. J Virol82:3952–3970.http://dx .doi.org/10.1128/JVI.02660-07.
19. Shankarappa R, Margolick JB, Gange SJ, Rodrigo AG, Upchurch D, Farzadegan H, Gupta P, Rinaldo CR, Learn GH, He X, Huang XL, Mullins JI.1999. Consistent viral evolutionary changes associated with the progression of human immunodeficiency virus type 1 infection. J Vi-rol73:10489 –10502.
20. Ping LH, Joseph SB, Anderson JA, Abrahams MR, Salazar-Gonzalez JF, Kincer LP, Treurnicht FK, Arney L, Ojeda S, Zhang M, Keys J, Potter EL, Chu H, Moore P, Salazar MG, Iyer S, Jabara C, Kirchherr J, Mapanje C, Ngandu N, Seoighe C, Hoffman I, Gao F, Tang Y, Labranche C, Lee B, Saville A, Vermeulen M, Fiscus S, Morris L, Karim SA, Haynes BF, Shaw GM, Korber BT, Hahn BH, Cohen MS, Monte-fiori D, Williamson C, Swanstrom R, CAPRISA Acute Infection Study, Center for HIV-AIDS Vaccine Immunology Consortium.2013. Com-parison of viral Env proteins from acute and chronic infections with sub-type C human immunodeficiency virus sub-type 1 identifies differences in glycosylation and CCR5 utilization and suggests a new strategy for im-munogen design. J Virol 87:7218 –7233.http://dx.doi.org/10.1128/JVI .03577-12.
21. Sturdevant CB, Dow A, Jabara CB, Joseph SB, Schnell G, Takamune N, Mallewa M, Heyderman RS, Van Rie A, Swanstrom R.2012. Central nervous system compartmentalization of HIV-1 subtype C variants early and late in infection in young children. PLoS Pathog8:e1003094.http://dx .doi.org/10.1371/journal.ppat.1003094.
22. Schnell G, Joseph S, Spudich S, Price RW, Swanstrom R. 2011. HIV-1 replication in the central nervous system occurs in two distinct cell types. PLoS Pathog7:e1002286.http://dx.doi.org/10.1371/journal .ppat.1002286.
23. Tsibris AM, Korber B, Arnaout R, Russ C, Lo CC, Leitner T, Gaschen B, Theiler J, Paredes R, Su Z, Hughes MD, Gulick RM, Greaves W, Coakley E, Flexner C, Nusbaum C, Kuritzkes DR.2009. Quantitative
deep sequencing reveals dynamic HIV-1 escape and large population shifts during CCR5 antagonist therapy in vivo. PLoS One4:e5683.http: //dx.doi.org/10.1371/journal.pone.0005683.
24. Dybowski JN, Heider D, Hoffmann D.2010. Structure of HIV-1 quasi-species as early indicator for switches of co-receptor tropism. AIDS Res Ther7:41.http://dx.doi.org/10.1186/1742-6405-7-41.
25. Archer J, Weber J, Henry K, Winner D, Gibson R, Lee L, Paxinos E, Arts EJ, Robertson DL, Mimms L, Quinones-Mateu ME.2012. Use of four next-generation sequencing platforms to determine HIV-1 corecep-tor tropism. PLoS One7:e49602.http://dx.doi.org/10.1371/journal.pone .0049602.
26. Bunnik EM, Swenson LC, Edo-Matas D, Huang W, Dong W, Frant-zell A, Petropoulos CJ, Coakley E, Schuitemaker H, Harrigan PR, van’t Wout AB.2011. Detection of inferred CCR5- and CXCR4-using HIV-1 variants and evolutionary intermediates using ultra-deep pyrosequencing. PLoS Pathog7:e1002106.http://dx.doi.org/10.1371 /journal.ppat.1002106.
27. Archer J, Braverman MS, Taillon BE, Desany B, James I, Harrigan PR, Lewis M, Robertson DL.2009. Detection of low-frequency pretherapy chemokine (CXC motif) receptor 4 (CXCR4)-using HIV-1 with ultra-deep pyrosequencing. AIDS 23:1209 –1218. http://dx.doi.org/10.1097 /QAD.0b013e32832b4399.
28. Raymond S, Saliou A, Nicot F, Delobel P, Dubois M, Cazabat M, Sandres-Saune K, Marchou B, Massip P, Izopet J.2011. Frequency of CXCR4-using viruses in primary HIV-1 infections using ultra-deep pyrosequencing. AIDS25:1668 –1670.http://dx.doi.org/10.1097/QAD .0b013e3283498305.
29. Meyerhans A, Vartanian JP, Wain-Hobson S.1990. DNA recombination during PCR. Nucleic Acids Res18:1687–1691.http://dx.doi.org/10.1093 /nar/18.7.1687.
30. Gorzer I, Guelly C, Trajanoski S, Puchhammer-Stockl E. 2010. The impact of PCR-generated recombination on diversity estimation of mixed viral populations by deep sequencing. J Virol Methods169:248 –252.http: //dx.doi.org/10.1016/j.jviromet.2010.07.040.
31. Liu SL, Rodrigo AG, Shankarappa R, Learn GH, Hsu L, Davidov O, Zhao LP, Mullins JI.1996. HIV quasispecies and resampling. Science 273:415– 416.http://dx.doi.org/10.1126/science.273.5274.415.
32. Jabara CB, Jones CD, Roach J, Anderson JA, Swanstrom R. 2011. Accurate sampling and deep sequencing of the HIV-1 protease gene using a Primer ID. Proc Natl Acad Sci U S A108:20166 –20171.http://dx.doi.org /10.1073/pnas.1110064108.
33. Zhou S, Jones C, Mieczkowski P, Swanstrom R.2015. Primer ID vali-dates template sampling depth and greatly reduces the error rate of next-generation sequencing of HIV-1 genomic RNA populations. J Virol89: 8540 – 8555.http://dx.doi.org/10.1128/JVI.00522-15.
34. Cameron DW, Heath-Chiozzi M, Danner S, Cohen C, Kravcik S, Maurath C, Sun E, Henry D, Rode R, Potthoff A, Leonard J.1998. Randomised placebo-controlled trial of ritonavir in advanced HIV-1 disease. The Advanced HIV Disease Ritonavir Study Group. Lancet 351:543–549.
35. Abrahams MR, Anderson JA, Giorgi EE, Seoighe C, Mlisana K, Ping LH, Athreya GS, Treurnicht FK, Keele BF, Wood N, Salazar-Gonzalez JF, Bhattacharya T, Chu H, Hoffman I, Galvin S, Mapanje C, Kazembe P, Thebus R, Fiscus S, Hide W, Cohen MS, Karim SA, Haynes BF, Shaw GM, Hahn BH, Korber BT, Swanstrom R, Williamson C, CAPRISA Acute Infection Study Team, Center for HIV-AIDS Vaccine Immunol-ogy Consortium.2009. Quantitating the multiplicity of infection with human immunodeficiency virus type 1 subtype C reveals a non-Poisson distribution of transmitted variants. J Virol83:3556 –3567.http://dx.doi .org/10.1128/JVI.02132-08.
36. Thompson JD, Higgins DG, Gibson TJ.1994. CLUSTAL W: improving the sensitivity of progressive multiple sequence alignment through se-quence weighting, position-specific gap penalties and weight matrix choice. Nucleic Acids Res22:4673– 4680.http://dx.doi.org/10.1093/nar /22.22.4673.
37. Tamura K, Peterson D, Peterson N, Stecher G, Nei M, Kumar S.2011. MEGA5: molecular evolutionary genetics analysis using maximum likeli-hood, evolutionary distance, and maximum parsimony methods. Mol Biol Evol28:2731–2739.http://dx.doi.org/10.1093/molbev/msr121. 38. Johnston SH, Lobritz MA, Nguyen S, Lassen K, Delair S, Posta F,
![TABLE 2 Numbers and percentages of X4 variants predicted by using the Geno2pheno [CORECEPTOR] algorithm on sequences assessed by both NGS and SGA](https://thumb-us.123doks.com/thumbv2/123dok_us/8289609.2195160/6.877.62.822.132.745/numbers-percentages-variants-predicted-coreceptor-algorithm-sequences-assessed.webp)