Admixture mapping of pelvic organ prolapse
in African Americans from the Women’s
Health Initiative Hormone Therapy trial
Ayush Giri1,2,3, Katherine E. Hartmann1,4, Melinda C. Aldrich2,3,5, Renee M. Ward4, Jennifer M. Wu6, Amy J. Park7, Mariaelisa Graff8, Lihong Qi9, Rami Nassir10,11, Robert B. Wallace12, Mary J. O’Sullivan13, Kari E. North8, Digna R. Velez Edwards1,3,4, Todd L. Edwards2,3*
1 Vanderbilt Epidemiology Center, Institute for Medicine and Public Health, Vanderbilt University Medical
Center, Nashville, Tennessee, United States of America, 2 Division of Epidemiology, Department of Medicine, Vanderbilt University Medical Center, Nashville, Tennessee, United States of America,
3 Vanderbilt Genetics Institute, Vanderbilt University Medical Center, Nashville, Tennessee, United States of
America, 4 Department of Obstetrics and Gynecology, Vanderbilt University Medical Center, Nashville, Tennessee, United States of America, 5 Department of Thoracic Surgery, Vanderbilt University Medical Center, Nashville, Tennessee, United States of America, 6 Department of Obstetrics and Gynecology, University of North Carolina, Chapel Hill, North Carolina, United States of America, 7 Department of Obstetrics and Gynecology, Georgetown University School of Medicine, Washington, District of Columbia, United States of America, 8 Department of Epidemiology, Gillings School of Global Public health, University of North Carolina, Chapel Hill, North Carolina, United States of America, 9 Division of Biostatistics, Department of Public Health Sciences, School of Medicine, University of California, Davis, Davis, California, United States of America, 10 Department of Biochemistry and Molecular Medicine, University of California, Davis, Davis, California, United States of America, 11 Department of Internal Medicine, University of California, Davis, Davis, California, United States of America, 12 Department of Epidemiology, University of Iowa College of Public Health, Iowa City, Iowa, United States of America, 13 Department of Obstetrics and Gynecology, Miller School of Medicine, Miami, Florida, United States of America
Abstract
Evidence suggests European American (EA) women have two- to five-fold increased odds of having pelvic organ prolapse (POP) when compared with African American (AA) women. However, the role of genetic ancestry in relation to POP risk is not clear. Here we evaluate the association between genetic ancestry and POP in AA women from the Women’s Health Initiative Hormone Therapy trial. Women with grade 1 or higher classification, and grade 2 or higher classification for uterine prolapse, cystocele or rectocele at baseline or during fol-low-up were considered to have any POP (N = 805) and moderate/severe POP (N = 156), respectively. Women with at least two pelvic exams with no indication for POP served as controls (N = 344). We performed case-only, and case-control admixture-mapping analyses using multiple logistic regression while adjusting for age, BMI, parity and global ancestry. We evaluated the association between global ancestry and POP using multiple logistic regression. European ancestry at the individual level was not associated with POP risk. Case-only and case-control local ancestry analyses identified two ancestry-specific loci that may be associated with POP. One locus (Chromosome 15q26.2) achieved empirically-esti-mated statistical significance and was associated with decreased POP odds (considering grade2 POP) with each unit increase in European ancestry (OR: 0.35; 95% CI: 0.30, 0.57; p-value = 1.48x10⁻⁵). This region includes RGMA, a potent regulator of the BMP family of
a1111111111 a1111111111 a1111111111 a1111111111 a1111111111 OPEN ACCESS
Citation: Giri A, Hartmann KE, Aldrich MC, Ward
RM, Wu JM, Park AJ, et al. (2017) Admixture mapping of pelvic organ prolapse in African Americans from the Women’s Health Initiative Hormone Therapy trial. PLoS ONE 12(6): e0178839.https://doi.org/10.1371/journal. pone.0178839
Editor: Margot Damaser, The Cleveland Clinic,
UNITED STATES
Received: August 23, 2016
Accepted: May 19, 2017
Published: June 5, 2017
Copyright:©2017 Giri et al. This is an open access article distributed under the terms of theCreative Commons Attribution License, which permits unrestricted use, distribution, and reproduction in any medium, provided the original author and source are credited.
Data Availability Statement: Data are available
genes. The second locus (Chromosome 1q42.1-q42.3) was associated with increased POP odds with each unit increase in European ancestry (Odds ratio [OR]: 1.69; 95% confidence interval [CI]: 1.28, 2.22; p-value = 1.93x10⁻⁴). Although this region did not reach statistical significance after considering multiple comparisons, it includes potentially relevant genes including TBCE, and ACTA1. Unique non-overlapping European and African ancestry-spe-cific susceptibility loci may be associated with increased POP risk.
Introduction
Pelvic organ prolapse is characterized by the descent of pelvic organs including uterus, bladder and rectum into the vaginal space due to loss of underlying support system that normally holds these organs in their anatomic locations. POP is a common condition with up to 40% of women having some degree of prolapse after menopause. While not all POP requires surgical intervention or is symptomatic, it is one of the most common indications for gynecologic sur-gery in the US after uterine fibroids and endometriosis [1]. Estimates of lifetime risk of under-going surgery for POP range from 11% to 19% [2;3]. Factors such as aging, family history of POP, genetic predisposition, increasing parity, and higher body mass index (BMI) have been associated with greater risk for POP [4–6].
Additionally, race/ethnic status has been postulated to be associated with POP, with Euro-pean Americans (EA) having 2–5 fold increased risk for POP than African Americans (AA) [7–11]. However, it is not clear if this disparity is due to biological/genetic differences or fac-tors such as varying access to medical care and varying care-seeking behaviors between races/ ethnicities. Anatomic comparative studies suggest AA women to have greater pelvic muscle mass and strength, a smaller angle in the pelvic arch/inlet due to closer attachment of the pub-orectalis muscle and increased pelvic floor mobility after vaginal delivery, than in EA women, providing potential reasons for elevated risk in EA women [12–14]. These evidence together suggest a potential role for genetic differences attributed to differences in continental ancestry in influencing POP risk.
Baseline evaluation of POP risk from the Women’s Health Initiative Hormone Therapy (WHI-HT) trial showed that AA women had 0.63 (95% confidence interval [CI]: 0.50, 0.79), 0.50 (95% CI: 0.44, 0.58) and 0.65 (0.59, 0.73) lower odds of having uterine prolapse, rectocele and cystocele, respectively, compared with EA women [7]. The WHI-HT is the largest multi-ethnic study conducted to-date with uniform assessment of objectively measured POP at base-line for all study participants and likely provides a relatively less biased assessment of the reported disparity compared with other studies. Additionally, the availability of genome wide association study (GWAS) data for AA women primes the WHI-HT as a unique resource to investigate the role of genetic ancestry in relation to POP risk. To our knowledge, this is the only existing resource available that provides information on POP and genome-wide data for African Americans.
Recently, we conducted a GWAS of POP risk in AA and Hispanic women from the WHI-HT, an analysis that was designed to detect common variants with similar allele frequen-cies in these two populations [15]. Here, we designed a study with the intention of investigat-ing highly differentiated markers (between African and European populations) to delineate the role of local genetic ancestry in relation to POP risk in AA women from the WHI-HT. Admixture mapping is a method that complements traditional GWAS approaches and is a potentially powerful method of identifying causal genetic loci for diseases that vary in
consistent with informed consent agreements provided by individual research participants. Initial inquiries and requests may be sent to
Funding: The Women’s Health Initiative program is
funded by the National Heart, Lung, and Blood Institute, National Institutes of Health, U.S. Department of Health and Human Services through contracts N01WH22110, 24152, 32100-2, 32105-6, 32108-9, 32111-13, 32115, 32118-32119, 32122, 42107-26, 42129-32, and 44221. Funding for Women’s Health Initiative SHARe genotyping was provided by NHLBI Contract N02-HL-64278. This work was funded by Vanderbilt Clinical and Translational Research Scholar award (5KL2RR024975) to Todd Edwards and by the Building Interdisciplinary Research Careers in Women’s Health career development program (5K12HD04383-11) to Digna R. Velez Edwards. Dr. Jennifer Wu is supported by K23HD068404, Eunice Kennedy Shriver National Institute of Child Health & Human Development. The funders had no role in study design, data collection and analysis, decision to publish, or preparation of the manuscript.
Competing interests: The authors have declared
prevalence across populations. Admixture mapping differs from the traditional GWAS approach in the following ways. The method is most optimized to detect regions of disease sus-ceptibility which are differentially distributed across ancestral populations and well repre-sented in admixed populations such as African Americans who have genetic contributions from African and European subcontinents. It additionally derives greater power in detecting associations due to reduced multiple testing burden from the fewer number of markers that are required to cover the whole genome owing to long range ancestral linkage disequilibrium [16;17]. Leveraging genetic ancestry to detect the determinants of POP risk, the objectives of this study are to: 1) evaluate whether one or more genetic segments originating from African or European sub-continents (local ancestry) are associated with pelvic organ prolapse and 2) evaluate whether the average of the local ancestry estimates across an individual shows excess of European or African ancestry in relation to POP in a population of AA women from the WHI-HT.
Materials and methods
Study population
The WHI-HT trial is one arm of the WHI study, which overall enrolled over 160,000 post-menopausal women between 50–79 years of age from 40 clinical centers across the US from the years 1993 through 1998 to one of four clinical trials or the observational study [18]. Details regarding the WHI and the WHI-HT have been described elsewhere [18–20]. The WHI-HT is a large multi-ethnic clinical trial which enrolled 27,342 post-menopausal women of whom 2,739 self-identified as AA women, the target population for this analysis. De-identified data were accessed through authorized and secure methods with approval from the Institutional Review Board at Vanderbilt University, the Women’s Health Initiative, and the database of Genotypes and Phenotypes (dbGaP).
POP measurement: Case and control definitions
As a part of standard baseline procedure, all women participating in the WHI-HT received a pelvic exam conducted by a WHI-trained gynecologist, nurse or physician’s assistant. Using centrally validated and uniform procedures, trained WHI-staff evaluated the presence of uterine prolapse, cystocele and/or rectocele in a supine lithotomy position with or without the Valsalva maneuver. Presence and severity of POP was determined using the WHI POP classification sys-tem, where no prolapse was classified as grade 0, prolapse into the vagina was classified as grade 1, prolapse to the introitus was classified as grade 2 and prolapse beyond the introitus/hymen was classified as grade 3. In addition to baseline assessment, women underwent similar pelvic exams in one to ten yearly follow-up visits. For this sub-study women with grade 1 or higher uterine prolapse, rectocele and/or cystocele occurring either at baseline or at subsequent follow-up visits were considered to have any POP. To assess clinically significant POP, women were considered to have moderate/severe POP if they had uterine prolapse, rectocele and/or cystocele of grade 2 or higher at baseline or at any of the subsequent follow-up visits. Women were con-sidered to be controls if they had grade 0 POP for all three types of prolapse: uterine prolapse, rectocele and cystocele in a minimum of two WHI visits including the baseline visit, and had no mention of POP from any other visits.
Measurement of covariates
reproductive history, and hysterectomy status. Anthropometric traits such as weight (kilo-grams) and height (cm) were measured at baseline and at subsequent follow-up visits. In addi-tion to age at baseline, we constructed an age variable to reflect the age at first ascertainment within WHI visits for POP cases and the age at last visit for women who had no POP prior to being lost-to-follow-up or study completion, whichever came first, for controls. We used the participants’ BMI for the visit which corresponded to first ascertainment of POP at the WHI for cases and last visit prior to being lost-to-follow-up for controls.
Genotyping and quality control (QC)
The SNP Health Association Resources (SHARe) is a study nested within the WHI and funded by the National Health Lung and Blood Institute (NHLBI) to evaluate genetic determinants of disease in approximately 8,420 AA and 3,587 Hispanic women who participated either in the WHI-HT study or the WHI observational study. These samples were genotyped with the Affy-metrix Human SNP Array 6.0 (AffyAffy-metrix1, Inc Santa Clara, CA). Standard QC procedures were performed using PLINK and are detailed inS1 TextandS1 Fig[21].
Upon QC completion, there were 344 control participants for whom two or more pelvic exams were available to confirm absence of uterine prolapse, cystocele and rectocele. There were 805 AA women who had prolapse of any severity for any of the three types of prolapse either at baseline or follow-up visits; 156 of these were moderate/severe POP cases.
Ancestry estimation
We used the software Local Ancestry in admixed Populations Ancestry (LAMP-ANC) with proxy ancestral allele frequency (Phase 3 1000 Genomes reference panels) [22] inputs for SNPs for Europeans and Africans to infer local ancestry across the genome for a total of 777,060 markers available in our post-QC dataset [23]. Local ancestry inference was performed using the following assumptions based on uncorrelated markers, seven generations since admixture began, recombination rate = 1x10⁻⁸, and average African and European admixture estimates of 0.8 and 0.2, respectively. Additionally, proportion of overlap between windows of ancestry inference was set to 0.2 and the r-squared threshold for LD-pruning was set to 0.1. Local ances-try was then coded as the number of European alleles at each marker (0, 1 or 2 European ancestry calls per marker). We then estimated the proportion of European ancestry for each individual (global ancestry) by summing the number of local European ancestry calls across all markers per person and then dividing by the total number of markers per person. Since the power of an admixture mapping study depends on ancestry informative markers, we limited our evaluation of ancestry calls to markers that were found to have an absolute difference in allele frequency,Δof0.4 between EUR and AFR populations in the 1000 Genomes. In the present dataset, 39,546 markers had aΔof 0.4 or higher and were utilized for testing the associ-ation between local ancestry and POP.
Statistical analyses
absence of a proper comparator group and due to its inability to adjust for other correlated fac-tors [16]. We computed a Z-statistic ((Local ancestry frequency at marker-i−global ancestry frequency)/standard error of local ancestry frequency at marker-i) for each locus and calcu-lated two-sided p-values. We conducted the case-control admixture mapping analyses with logistic regression using PLINK, where we regressed POP (any POP and moderate/severe POP) onto local ancestry, adjusting for aforementioned variables and two multi-dimensional scaling (MDS) components representing continuous axes of genetic ancestry. The motivation behind conducting two different types of tests (case-only and case-control study) was based on the intuition that overlapping signals from both tests in a given region provides greater likeli-hood of identifying a true positive, while weeding out false-positive signals. Therefore, regions from admixture mapping analyses which showed overlaps between case-only and case-control methods with suggestive peak p-values (<1x10⁻³), within two integers on the–log10p-value scale to the left and right of the strongest case-control peak for a given region were warranted further attention. Statistical significance for admixture mapping analyses was established empirically with 10,000 case-control permutation tests at p-value = 1.82x10⁻⁵, implying approximately 2,747 independent ancestry markers.
Significant or suggestive peaks from admixture mapping analyses were further assessed for evidence of single SNP association with POP using genotyped and imputed variants as second-ary analyses. Genotype data for broad regions (10 to 20 Mb regions) below suggestive/signifi-cant peaks were imputed using the 1000 genomes cosmopolitan reference panels using IMPUTE2 [24]. Association between SNPs and POP (any POP and moderate/severe POP) were performed using multiple logistic regression adjusting for age at ascertainment, BMI, parity and the two MDS components to represent continuous axes of genetic ancestry using SNPTEST [25]. Then, to evaluate if any of the SNPs investigated in the regions of interest explained the admixture mapping peaks, we performed logistic regression between local ances-try and POP conditioning on the most-statistically significant SNPs contained within the region of interest.
Results
Women with any POP and moderate/severe POP were more likely to have higher parity on average, compared with controls. At the WHI baseline visit, women without POP were slightly younger (mean age: 60.1) than women with any POP (mean age: 61.8) and women with mod-erate/severe POP (mean age: 62.8) (Table 1). However, controls were more likely to be older when considering age at ascertainment than cases since women were only considered controls in this sub-study because we recorded their age at last visit without POP prior to being lost to follow up or study’s end. Of the 805 any POP cases, 292 women developed POP during follow-up visits. Similarly, of the 156 women who had moderate/severe POP in our study, 98 women developed moderate/severe POP during follow-up visits.
the same direction as the association from moderate/severe POP analysis (Table 3). Sensitivity analyses of our main finding for the top ancestry locus separating incident and prevalent cases showed greatest agreement with incident cases for moderate/severe POP (S1 Table).
We then evaluated the association between imputed SNPs in the region below the admix-ture mapping peak to identify potential SNPs which may be associated with POP. Admixadmix-ture mapping peaks (-log10(p-values)) from case-control analyses and SNP associations (log10(p-values)) are juxtaposed inFig 3for chromosome 15. Imputed SNP rs4777810 was the most sta-tistically significant SNP under the peak (Fig 3;Table 4). Compared with the reference allele (A), the effect allele (G) was associated with decreased POP risk (OR: 0.37; 95% CI: 0.23, 0.50; p: 5.58x10⁻⁵). Additional adjustment for rs4777810 severely attenuated the admixture mapping signal (Fig 3) and decreased the magnitude of ancestral odds ratio from 0.35 to 0.50) (Table 5). The effect allele for rs4777810 (risk decreasing allele) is found in higher frequency in the Euro-pean reference population (57%) than in the African reference population (3%).
The second strongest admixture mapping signal from case-control analyses was observed in the chromosome 1q42.1–42.3 region, where each unit increase in European ancestry was associated with increased odds of any POP (OR: 1.69; 95% CI: 1.28, 1.22; p: 1.93x10⁻⁴) (Table 3). Evaluation of the same association in moderate/severe POP for com-parison showed that the effect estimate was stronger in the moderate/severe POP analysis than in the any POP analysis, however with a larger p-value due to smaller sample size (Table 3). We then evaluated the association between imputed SNPs in the region below the admixture mapping peak in relation to any POP. In analyses of imputed SNPs, SNP Table 1. Characteristics of African American POP cases and controls.
Variable Controls (N = 344) Any POP (N = 805) Grade 2–3 POP (N = 156)
Mean (SD) Mean (SD) Mean (SD)
Age at baseline 60.11 (6.68) 61.77 (6.96) 62.79 (6.77)
Age at ascertainment 65.20 (6.80) 62.75 (7.02) 64.85 (6.98)
Body mass index (kg/m2) 31.19 (6.59) 31.71 (6.19) 31.71 (6.07)
Parity (# child births) 2.26 (1.59) 2.85 (1.64) 3.28 (1.60)
Hysterectomy at baseline (%) 23.20% 42.20% 34.80%
European Genetic Ancestry (%) 24.30% 23.15% 23.05%
POP Type - N (%)a N (%)a
Cystocele - 737 (91.5%) 134 (85.9%)
Rectocele - 372 (46.2%) 46 (29.5%)
Uterine Prolapse - 189 (23.5%) 10 (6.4%)
POP: pelvic organ prolapse.
a Numbers do not add up to total N and percentages do not add up to 100% as these are not mutually exclusive conditions; cases may have one or more type of prolapse.
https://doi.org/10.1371/journal.pone.0178839.t001
Table 2. Association between European-ancestry percent in relation to POP in African American women.
Model N-Controls/N-Cases OR (95% CI) P
Grade 0 vs. Grade 1–3 POP 341/794
European Ancestry 0.82 (0.31, 2.16) 0.71
Grade 0 vs Grade 2–3 POP 341/155
European Ancestry 0.81 (0.19, 3.39) 0.77
OR = odds ratio; CI = confidence interval; Models were adjusted for age at ascertainment, body mass index and parity.
rs78992478 was directly below the admixture mapping peak (Fig 4) and compared with the reference allele T, the effect allele C was associated with increased risk for any POP (OR: 3.15; 95% CI: 1.93, 5.14; p: 4.23x10⁻⁶) (Table 4).
The second most significant SNP in the admixture mapping peak in chromosome 1 was rs2501094, for which effect allele C was associated with increased risk for POP (OR: 1.63; 95% CI: 1.32, 2.02; p: 5.47x10⁻⁶) (Table 4andFig 4). In models evaluating the association between local ancestry and any POP, additionally adjusting for SNP rs78992478 and/or rs2501094 decreased the admixture mapping signal (Fig 4) and also decreased the odds ratio for ancestry from 1.69 to 1.37 (Table 5). The largest drop in admixture mapping signal was seen with adjustment for rs2501094 (Table 5). The effect allele for rs2501094 (risk increasing allele in this case) is found in higher frequency in the European reference population (99%) than in the African reference population (50%).
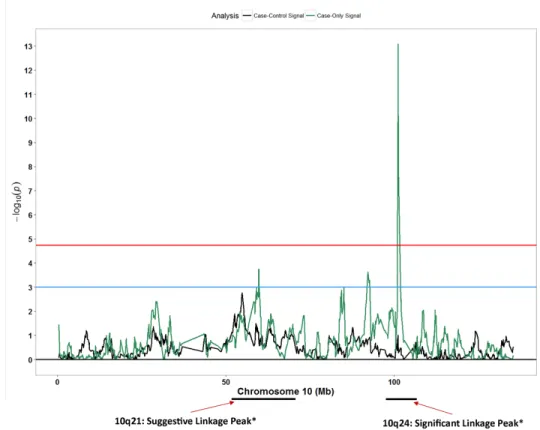
Secondary to the results mentioned above, we compared results from our case-only and case-control admixture mapping signals with SNPs or regions reported in previously reported studies evaluating genetic regions with respect to POP. We observed patterns of association for case-only signals (Fig 5) in chromosome 10q21 and 10q24 (Z-score:-7.46; p: 8.5x10⁻¹⁴) regions that were strikingly similar to linkage peaks reported by Allen-Brady and colleagues [26].
Discussion
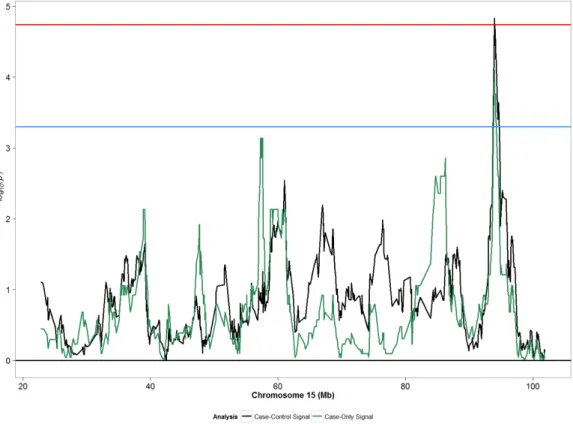
As the first study to evaluate the association between genetic ancestry and POP, our results suggest presence of two unique ancestry-specific susceptibility loci, where in one region Fig 1. Admixture mapping peaks for chromosome 15 from case-only and case-control designs considering moderate/severe POP (grades 2–3) in African Americans. Blue horizontal line: suggestive
p-value threshold; Red horizontal line: permutation based p-p-value threshold.
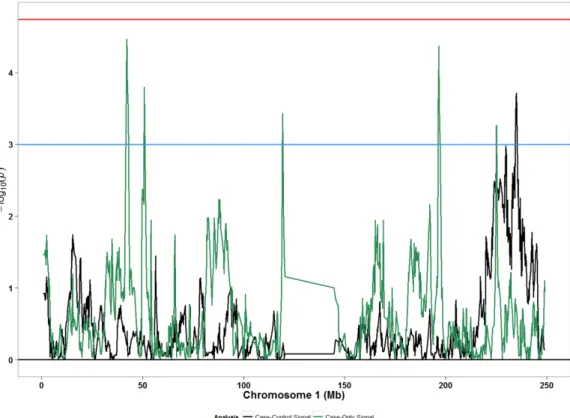
European ancestry was associated with increased risk for POP, and in another region African ancestry was associated with increased risk for POP. Contrary to epidemiological evidence that show of higher prevalence of POP in EAs than in AAs, our evaluation of genetically inferred European ancestry proportion per person was not associated with POP. There was not sufficient evidence in this study to support the idea that POP disparity between EA and AA is attributable to differences in genetic ancestry averaged over the entire genome. While EA women in the WHI were more likely to have POP at baseline than AA women, POP was common in both populations (40.2% in EA vs. 29.4% in AA) [7]. For such a highly prevalent complex condition, it is plausible that women from European or African ancestries may have shared susceptibility loci and there may be distinct ancestry-specific susceptibility loci which Fig 2. Admixture mapping peaks for chromosome 1 from case-only and case-control designs
considering any POP (grades 1–3) in African Americans. Blue horizontal line: suggestive p-value threshold;
Red horizontal line: permutation based p-value threshold.
https://doi.org/10.1371/journal.pone.0178839.g002
Table 3. Associations between local European ancestry and POP in top regions.
Region Nearby Genes Classification Ancestry OR (95% CI) Pcase-control Pcase-only
c
15q26.2 RGMA, CHD2 Grade 0 vs. 2/3 0.35 (0.22, 0.57)a 1.48x10⁻⁵ 7.95x10⁻⁵
Grade 0 vs. 1–3 0.77 (0.59, 0.99) b 0.049
-1q42.1–42.3 ARID4B, TBCE, ACTN2, PGBD5, ACTA1 Grade 0 vs. 1–3 1.69 (1.28, 2.22) b 1.93x10⁻⁴ 6.7x10⁻⁴ Grade 0 vs. 2/3 1.86 (1.26, 2.76)a 2.00x10⁻³
-OR: Odds Ratio; CI: Confidence Interval.
a Modeled against local European ancestry adjusted for covariates (age at ascertainment, BMI, parity and continuous axes of MDS components) b Modeled against local European ancestry adjusted for covariates (age at ascertainment, BMI, parity and continuous axes of MDS components) c Case-only p-values were used along with case-control p-values to find overlapping regions.
are associated with increased or decreased risk for POP, as has been shown for prostate cancer [27]. The presence of opposing effect-estimates in ancestry-specific loci could have potentially diluted the association between global ancestry and POP as it is merely a representation of average ancestry along the genome. Alternatively, if there is an excess of disease susceptibility loci in European Americans with meaningful but small allele frequency differences, these would have been missed in our study as we focused on variants with large differences; we were only powered to detect these. However, due to lack of availability of well characterized cohorts Fig 3. Signals from moderate/severe case-control admixture mapping and imputed SNPs for chromosome 15q26.2 region. Blue horizontal line: suggestive p-value threshold; Red horizontal line: permutation based p-value
threshold. Solid black line represents admixture mapping signal prior to conditional analysis. Red dots represents log10(p-values) for genotyped and imputed SNPs within the admixture mapping peak. Blue dot represents SNP rs4777810, the most significant SNP directly below the admixture mapping peak. Dashed blue line represents admixture mapping signal after adjustment for SNP rs4777810.
https://doi.org/10.1371/journal.pone.0178839.g003
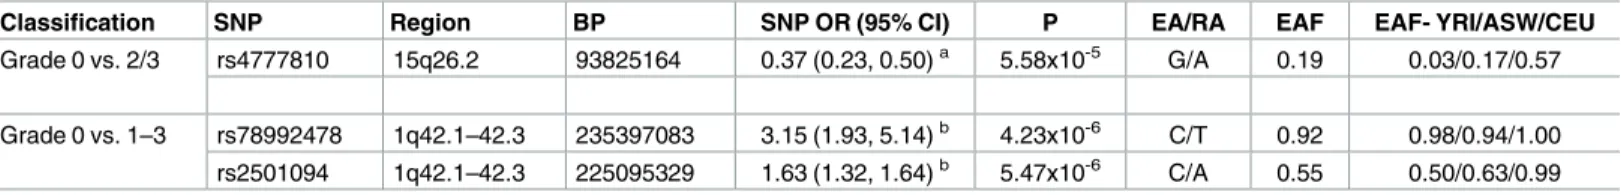
Table 4. Associations between genetic markers and POP in top regions identified from admixture mapping.
Classification SNP Region BP SNP OR (95% CI) P EA/RA EAF EAF- YRI/ASW/CEU
Grade 0 vs. 2/3 rs4777810 15q26.2 93825164 0.37 (0.23, 0.50)a 5.58x10⁻⁵ G/A 0.19 0.03/0.17/0.57
Grade 0 vs. 1–3 rs78992478 1q42.1–42.3 235397083 3.15 (1.93, 5.14)b 4.23x10⁻⁶ C/T 0.92 0.98/0.94/1.00 rs2501094 1q42.1–42.3 225095329 1.63 (1.32, 1.64)b 5.47x10⁻⁶ C/A 0.55 0.50/0.63/0.99
SNP: Single Nucleotide Polymorphism; BP: Base Pair; P: P-value; OR: Odds Ratio; CI: Confidence Interval; EA: Effect Allele; RA: Reference Allele; EAF: Effect Allele Frequency.
a Modeled against SNP, adjusted for covariates (age at ascertainment, BMI, parity and continuous axes of MDS components). b Modeled against SNP, adjusted for covariates (age at ascertainment, BMI, parity and continuous axes of MDS components).
such as the WHI, we were not able to test these associations in an independent African Ameri-can population for who data on POP and genetics are simultaneously available and should therefore be interpreted with care.
Table 5. Associations between local ancestry and POP with and without adjustment for genetic markers in top regions.
Classification Region Adjusted for SNP Ancestry OR (95% CI)a P
Grade 0 vs. 2/3 15q26.2 No 0.35 (0.22, 0.57) 1.48x10⁻⁵
rs4777810 0.50 (0.30, 0.85) 0.01
Grade 0 vs. 2/3 1q42.1–42.3 No 1.69 (1.28, 2.22) 1.93x10⁻⁴
rs78992478 1.56 (1.18, 2.06) 1.75x10⁻³
rs2501094 1.48 (1.11, 1.97) 6.80x10⁻³
rs78992478 + rs2501094 1.37 (1.03, 1.32) 0.03
SNP: Single Nucleotide Polymorphism; OR: Odds Ratio; CI: Confidence Interval; P: P-value
a Modeled against local European ancestry adjusted for covariates (age at ascertainment, BMI, parity and continuous axes of MDS components), with and with and without adjustment for top imputed/genotyped marker(s) at region of interest.
https://doi.org/10.1371/journal.pone.0178839.t005
Fig 4. Signals from any-POP case-control admixture mapping and imputed SNPs for chromosome 1q42.1–42.3 region. Blue horizontal line: suggestive p-value threshold; Red horizontal line: permutation based
p-value threshold. Solid black line represents admixture mapping signal prior to conditional analysis. Red dots represents log10(p-values) for genotyped and imputed SNPs within the admixture mapping peak. Blue dot represents SNP rs78992478, the most significant SNP directly below the admixture mapping peak. Green dot represents SNP rs2501094, the second-most significant SNP directly below the admixture mapping peak. Dashed blue line represents admixture mapping signal after adjustment for SNP rs78992478. Dashed green line represents admixture mapping signal after adjustment for SNP rs2501094. Dashed grey line represents admixture mapping signal after adjustment for both SNPs.
The chromosomal region 1q42.1-q42.3 showed a greater presence of excess European ancestry in POP cases than in controls. Although the signal for this region was not statistically significant (p: 1.93x10⁻⁴) after considering multiple comparisons (p-value threshold: 1.8x10⁻⁵), several pieces of other evidence collectively point to the plausibility that the signal from this region may be of interest in relation to POP. This 20 Mb region harbors several genes which may be related to maintenance of components of the pelvic support system and may be related to POP, including tubulin binding cofactor E (TBCE) and alpha-actin-1 (ACTA1) genes.
TBCEis a peripheral associated membrane protein which plays an essential role in polymeriz-ing microtubules [28]. This gene has been suggested to play a major role in forming neuromus-cular junctions [29] and mutations in theTBCEgene have shown to cause loss of microtubule formation in distal ends axons [30;31]. Denervation of major muscles involved in the pelvic sup-port system due to stress-related insult during labor has been hypothesized as an imsup-portant con-tributor to POP. It is plausible that altered expression of theTBCEgene may impact proper repair of denervation sites. TheACTA1gene product is a globular protein that is important in thin microfilament formation including F-actin and G-actin filaments and plays an essential role in muscular contraction [32]. A recent study that evaluated F-actin expression in vaginal fibro-blasts reported relative F-actin expression was higher in fibrofibro-blasts from women with POP than from women without POP [33].
However, with such a broad peak of 20 MB, it is difficult to delineate whether the region is foretelling several signals for which the granularity has been lost or from one signal. When we Fig 5. Admixture mapping peaks for chromosome 10 in context with previously reported linkage peak. Blue horizontal line: suggestive p-value threshold; Red horizontal line: permutation based p-value
threshold; Black peaks: case-control admixture mapping; Green peaks: case-only admixture mapping.
adjusted for the most significant marker under the peak (rs78992478), it did not significantly change the effect estimate or the peak of the admixture mapping signal. This is likely due to a lack of correlation with the admixture mapping peak, which is also reflected by the relatively smaller allele frequency difference across populations for this SNP. However, adjusting for a SNP at the second most significant locus under the broad peak (approximately 10 Mb away— rs2501094), the admixture mapping signal attenuated slightly more, with the greatest attenua-tion when both SNPs were adjusted for. Intriguingly, our previous GWAS investigaattenua-tion of pel-vic organ prolapse using African American and Hispanic women identified a common marker across those populations near genePGBD5in the 1q42.1–3 region. This further suggests a more complicated genetic architecture for pelvic organ prolapse with the possibility that if genetic variants affect POP risk, there may be risk increasing variants that are common to and specific to populations.
The most persuasive case-control admixture mapping peak, which remained significant after permutation testing, is located at chromosome 15q26.2. Interestingly, European ances-try was inversely associated with moderate/severe POP. This region harbors the repulsive guidance molecule family member a (RGMA) gene, which is a glycosylphospatidylinositol-anchored glycoprotein.RGMAwas initially discovered for its role as an axon guidance pro-tein in the central nervous system [34;35]. The RGM family of genes includingRGMAhave been shown to be important regulators of the bone morphogenic protein (BMP) pathway including theBMP-1gene [36;37]. TheBMP-1gene is involved in activation of the lysl oxi-dase (LOX) family of genes and plays a crucial role in maturation of procollagen chains and elastin [38]. A small study evaluating the association between POP cases and controls showed decreased expression of theBMP-1gene in POP cases compared with controls [39]. The SNP identified for this region (rs4777810) not only explained the admixture mapping peak suggesting a high degree of correlation with the peak, but also falls in a gene regulatory region as predicted by the Regulome database, with a regulatory score of 2b [40]. The SNP is located in a transcription factor binding region and is on a DNAse hypersensitivity region as detected by DNA foot printing assay and DNase peak identification. Specifically, the SNP lies in a region that acts as a binding site for theEZH2gene product, a histone–lysine N-methyltransferase enzyme that facilitates transcriptional repression.EZH2in turn has been shown to regulateRGMAexpression [41].
case-control admixture mapping analyses, the striking resemblance with previously reported peaks is noteworthy.
We took measures at the design and analysis phase to ensure internal validity. We reduced misclassification of cases and controls, when possible, to identify controls at baseline who developed POP during follow-up. With the intention of reducing misclassification, even at the expense of losing controls from our previously utilized control definition [15], we limited our definition of controls to women with at least two measurements of POP at different time points. We additionally showed that the effect estimates for candidate local ancestry regions in relation to POP were in the same direction for moderate/severe POP and any POP (S2 Fig); estimates were stronger for moderate/severe POP at the top markers than for any POP, at the top regions (Table 3). To minimize false positives due to chance, that is especially likely in a only approach, or bias, we only considered overlapping regions from only and case-control designs with at least suggestive statistical significance. However, at the expense of mini-mizing false positives, our study may have missed potentially true signals such as the one observed for chromosome 10q24 in the case-only design. Since women without a uterus could still potentially have other forms of prolapse such as cystocele and rectocele we included these women in our study, with the understanding of potential selection bias especially if women with a hysterectomy were more likely to be controls. However, this concern is alleviated since similar signals were observed in case-only and case-control designs, the former of which would not be affected by hysterectomy status. To compensate for a small sample size in our study and to reduce multiple comparisons we limited our analysis to highly differentiated markers in the ancestral reference populations. Additionally, we used a rigorous method, per-mutation testing, to empirically estimate statistical significance from our primary admixture mapping analyses. In addition to identifying broad genetic regions from admixture mapping, we attempted to identify markers in the region that explained the admixture mapping peaks.
In conclusion, the results from our study suggest that POP is a genetically complex condi-tion with susceptibility loci that may vary substantially in frequency between European and African ancestry populations. We provide evidence for two novel biologically plausible loci for POP risk and provide further evidence for a previously reported locus. Replication and fine-mapping studies in larger and similarly well-classified independent AA populations are a pri-ority to confirm findings from this study.
Supporting information
S1 Text. Quality control details for genotype data.
(DOCX)
S1 Fig. QC flow chart for African American cases and controls from the WHI-HT trial.
(PNG)
S2 Fig. Comparing effect estimates of any POP and moderate/severe POP admixture map-ping analyses for candidate admixture mapmap-ping regions. Top right quadrant contains effect
estimates from local ancestry analyses in chromosome 1q42.3 region (orange dots) against any POP or moderate/severe POP. Bottom left quadrant contains effect estimates from local ances-try analyses in chromosome 15q26.2 region (blue dots) against any POP or moderate/severe POP.
(PNG)
S1 Table. Admixture mapping sensitivity analyses for moderate/severe POP for the most significant marker chromosome15q23.1 region. Models adjusted for age, BMI, parity and
during follow-up examinations. Prevalent cases refer to moderate/severe POP cases that were present at baseline examination. All cases refer to a combination of prevalent and incident moderate/severe POP cases. Stringent controls refer to individuals who had at least two WHI pelvic exams during baseline and follow-up and were confirmed to be absent for POP. Con-trols at baseline refer to individuals who did not have POP at baseline; these include individu-als who did not develop POP during follow-up and individu-also includes individuindividu-als who developed POP during follow-up.
(DOCX)
Acknowledgments
This manuscript was prepared in collaboration with investigators of the Women’s Health Ini-tiative, and has been reviewed and/or approved by the Women’s Health Initiative. The follow-ing persons are investigators in the Women’s Health Initiative.
Program Office: (National Heart, Lung, and Blood Institute, Bethesda, Maryland) Jacques Rossouw, Shari Ludlam, Dale Burwen, Joan McGowan, Leslie Ford, and Nancy Geller.
Clinical Coordinating Center: Clinical Coordinating Center: (Fred Hutchinson Cancer Research Center, Seattle, WA) Garnet Anderson, Ross Prentice, Andrea LaCroix, and Charles Kooperberg Investigators and Academic Centers: (Brigham and Women’s Hospital, Harvard Medical School, Boston, MA) JoAnn E. Manson; (MedStar Health Research Institute/Howard University, Washington, DC) Barbara V. Howard; (Stanford Prevention Research Center, Stanford, CA) Marcia L. Stefanick; (The Ohio State University, Columbus, OH) Rebecca Jack-son; (University of Arizona, Tucson/Phoenix, AZ) Cynthia A. ThomJack-son; (University at Buf-falo, BufBuf-falo, NY) Jean Wactawski-Wende; (University of Florida, Gainesville/Jacksonville, FL) Marian Limacher; (University of Iowa, Iowa City/Davenport, IA) Robert Wallace; (University of Pittsburgh, Pittsburgh, PA) Lewis Kuller; (Wake Forest University School of Medicine, Winston-Salem, NC) Sally Shumaker.
Women’s Health Initiative Memory Study: (Wake Forest University School of Medicine, Winston-Salem, NC) Sally Shumaker.
A list of all investigators who have contributed to WHI science can be found athttps:// www.whi.org/researchers/Documents%20%20Write%20a%20Paper/WHI%20Investigator% 20Long%20List.pdf.
The datasets used for the analyses described in this manuscript were obtained from dbGaP athttp://www.ncbi.nlm.nih.gov/sites/entrez?db=gapthrough dbGaP accession phs000200.v9. p3.
Author Contributions
Conceptualization: AG TLE DRVE KEH.
Data curation: RBW KEN LQ RN MJOS.
Formal analysis: AG TLE.
Investigation: AG.
Methodology: AG MCA TLE KEH.
Resources: TLE DRVE MCA KEH.
Software: AG.
Validation: TLE DRVE.
Visualization: AG.
Writing – original draft: AG.
Writing – review & editing: AG KEH MCA RMW JMW AJP MG LQ RN RBW MJOS KEN
DRVE TLE.
References
1. Wilcox LS, Koonin LM, Pokras R, Strauss LT, Xia Z, Peterson HB. Hysterectomy in the United States, 1988–1990. Obstetrics & Gynecology 1994; 83(4):549–hyhen.
2. Olsen AL, Smith VJ, Bergstrom JO, Colling JC, Clark AL. Epidemiology of Surgically Managed Pelvic Organ Prolapse and Urinary Incontinence. Obstetrics & Gynecology 1997; 89(4).
3. Smith FJ, Holman CD, Moorin RE, Tsokos N. Lifetime Risk of Undergoing Surgery for Pelvic Organ Pro-lapse. Obstetrics & Gynecology 2010; 116(5).
4. Vergeldt TF, Weemhoff M, IntHout J, Kluivers KB. Risk factors for pelvic organ prolapse and its recur-rence: a systematic review. International Urogynecology Journal 2015;1–15.
5. Jelovsek JE, Maher C, Barber MD. Pelvic organ prolapse. The Lancet 2007; 369(9566):1027–38.
6. Bump RC, Norton PA. Epidemiology and natural history of pelvic floor dysfunction. Obstetrics and gyne-cology clinics of North America 1998; 25(4):723–46. PMID:9921553
7. Hendrix SL, Clark A, Nygaard I, Aragaki A, Barnabei V, McTiernan A. Pelvic organ prolapse in the women’s health initiative: Gravity and gravidity. American Journal of Obstetrics and Gynecology 2002 Jun; 186(6):1160–6. PMID:12066091
8. Kudish BI, Iglesia CB, Gutman RE, Sokol AI, Rodgers AK, Gass M, et al. Risk factors for prolapse devel-opment in white, black, and Hispanic women. Female Pelvic Medicine & Reconstructive Surgery 2011; 17(2):80–90.
9. Rortveit G, Brown JS, Thom DH, Van Den Eeden SK, Creasman JM, Subak LL. Symptomatic Pelvic Organ Prolapse: Prevalence and Risk Factors in a Population-Based, Racially Diverse Cohort. Obstet-rics & Gynecology 2007; 109(6).
10. Swift S, Woodman P, O’Boyle A, Kahn M, Valley M, Bland D, et al. Pelvic Organ Support Study (POSST): the distribution, clinical definition, and epidemiologic condition of pelvic organ support defects. American Journal of Obstetrics and Gynecology 2005; 192(3):795–806.https://doi.org/10. 1016/j.ajog.2004.10.602PMID:15746674
11. Whitcomb EL, Rortveit G, Brown JS, Creasman JM, Thom DH, Van Den Eeden SK, et al. Racial Differ-ences in Pelvic Organ Prolapse. Obstetrics & Gynecology 2009; 114(6).
12. Handa VL, Lockhart ME, Fielding JR, Bradley CS, Brubakery L, Cundiffy GW, et al. Racial differences in pelvic anatomy by magnetic resonance imaging. Obstetrics and gynecology 2008; 111(4):914.
https://doi.org/10.1097/AOG.0b013e318169ce03PMID:18378751
13. Howard D, DeLancey JO, Tunn R, Ashton-Miller JA. Racial differences in the structure and function of the stress urinary continence mechanism. Obstetrics and gynecology 2000; 95(5):713. PMID:
10775735
14. Hoyte L, Thomas J, Foster RT, Shott S, Jakab M, Weidner AC. Racial differences in pelvic morphology among asymptomatic nulliparous women as seen on three-dimensional magnetic resonance images. American Journal of Obstetrics and Gynecology 2005 Dec; 193(6):2035–40.https://doi.org/10.1016/j. ajog.2005.06.060PMID:16325611
15. Giri A, Wu JM, Ward RM, Hartmann KE, Park AJ, North KE, et al. Genetic Determinants of Pelvic Organ Prolapse among African American and Hispanic Women in the Women’s Health Initiative. PLoS One 2015; 10(11):e0141647.https://doi.org/10.1371/journal.pone.0141647PMID:26545240 16. Shriner D. Overview of Admixture Mapping. Current Protocols in Human Genetics 2013;1–23.https://
doi.org/10.1002/0471142905.hg0901s76PMID:23315929
17. Winkler CA, Nelson GW, Smith MW. Admixture mapping comes of age*. Annual review of genomics and human genetics 2010; 11:65–89.https://doi.org/10.1146/annurev-genom-082509-141523PMID:
20594047
19. Curb JD, McTiernan A, Heckbert SR, Kooperberg C, Stanford J, Nevitt M, et al. Outcomes ascertain-ment and adjudication methods in the Women’s Health Initiative. Annals of epidemiology 2003; 13(9): S122–S128.
20. Hays J, Hunt JR, Hubbell FA, Anderson GL, Limacher M, Allen C, et al. The Women’s Health Initiative recruitment methods and results. Annals of epidemiology 2003; 13(9):S18–S77.
21. Purcell S, Neale B, Todd-Brown K, Thomas L, Ferreira MA, Bender D, et al. PLINK: a tool set for whole-genome association and population-based linkage analyses. The American Journal of Human Genetics 2007; 81(3):559–75.https://doi.org/10.1086/519795PMID:17701901
22. Genomes Project Consortium. A map of human genome variation from population-scale sequencing. Nature 2010; 467(7319):1061–73.https://doi.org/10.1038/nature09534PMID:20981092
23. Sankararaman S, Sridhar S, Kimmel G, Halperin E. Estimating local ancestry in admixed populations. The American Journal of Human Genetics 2008; 82(2):290–303.https://doi.org/10.1016/j.ajhg.2007. 09.022PMID:18252211
24. Howie BN, Donnelly P, Marchini J. A flexible and accurate genotype imputation method for the next gen-eration of genome-wide association studies. PLoS Genet 2009; 5(6):e1000529.https://doi.org/10.1371/ journal.pgen.1000529PMID:19543373
25. Marchini J, Howie B, Myers S, McVean G, Donnelly P. A new multipoint method for genome-wide asso-ciation studies by imputation of genotypes. Nature genetics 2007; 39(7):906–13.https://doi.org/10. 1038/ng2088PMID:17572673
26. Allen-Brady K, Cannon-Albright LA, Farnham JM, Norton PA. Evidence for Pelvic Organ Prolapse Pre-disposition Genes on Chromosomes 10 and 17. American Journal of Obstetrics and Gynecology 2014.
27. Bensen JT, Xu Z, McKeigue PM, Smith GJ, Fontham ET, Mohler JL, et al. Admixture mapping of pros-tate cancer in African Americans participating in the North Carolina-Louisiana Prospros-tate Cancer Project (PCaP). The Prostate 2014; 74(1):1–9.https://doi.org/10.1002/pros.22722PMID:24037755 28. Tian G, Cowan NJ. Tubulin-specific chaperones: components of a molecular machine that assembles
theα/βheterodimer. Methods in cell biology 2012; 115:155–71.
29. Jin S, Pan L, Liu Z, Wang Q, Xu Z, Zhang YQ. Drosophila Tubulin-specific chaperone E functions at neuromuscular synapses and is required for microtubule network formation. Development 2009; 136 (9):1571–81.https://doi.org/10.1242/dev.029983PMID:19297412
30. Schaefer MK, Schmalbruch H, Buhler E, Lopez C, Martin N, Gue´net JL, et al. Progressive motor neuro-nopathy: a critical role of the tubulin chaperone TBCE in axonal tubulin routing from the Golgi apparatus. The Journal of Neuroscience 2007; 27(33):8779–89.https://doi.org/10.1523/JNEUROSCI.1599-07. 2007PMID:17699660
31. Bloch-Gallego E. Mechanisms controlling neuromuscular junction stability. Cellular and Molecular Life Sciences 2014; 72(6):1029–43.https://doi.org/10.1007/s00018-014-1768-zPMID:25359233
32. Laing NG, Dye DE, Wallgren-Pettersson C, Richard G, Monnier N, Lillis S, et al. Mutations and polymor-phisms of the skeletal muscle alpha-actin gene (ACTA1). Human mutation 2009; 30(9):1267–77.
https://doi.org/10.1002/humu.21059PMID:19562689
33. Wang S, Zhang Z, Lu¨ D, Xu Q. Effects of Mechanical Stretching on the Morphology and Cytoskeleton of Vaginal Fibroblasts from Women with Pelvic Organ Prolapse. International journal of molecular sci-ences 2015; 16(5):9406–19.https://doi.org/10.3390/ijms16059406PMID:25923074
34. Monnier PP, Sierra A, Macchi P, Deitinghoff L, Andersen JS, Mann M, et al. RGM is a repulsive guid-ance molecule for retinal axons. Nature 2002; 419(6905):392–5.https://doi.org/10.1038/nature01041
PMID:12353034
35. Severyn C, Shinde U, Rotwein P. Molecular biology, genetics and biochemistry of the repulsive guid-ance molecule family. Biochem J 2009; 422:393–403.https://doi.org/10.1042/BJ20090978PMID:
19698085
36. Halbrooks PJ, Ding R, Wozney JM, Bain G. Role of RGM coreceptors in bone morphogenetic protein signaling. Journal of molecular signaling 2007; 2(1):4.
37. Tian C, Liu J. Repulsive guidance molecules (RGMs) and neogenin in bone morphogenetic protein (BMP) signaling. Molecular reproduction and development 2013; 80(9):700–17.https://doi.org/10.1002/ mrd.22199PMID:23740870
38. Kessler E, Takahara K, Biniaminov L, Brusel M, Greenspan DS. Bone morphogenetic protein-1: the type I procollagen C-proteinase. Science 1996; 271(5247):360. PMID:8553073
40. Boyle AP, Hong EL, Hariharan M, Cheng Y, Schaub MA, Kasowski M, et al. Annotation of functional var-iation in personal genomes using RegulomeDB. Genome research 2012; 22(9):1790–7.https://doi.org/ 10.1101/gr.137323.112PMID:22955989
41. Ngollo M, Lebert A, Dagdemir A, Judes G, Karsli-Ceppioglu S, Daures M, et al. The association between histone 3 lysine 27 trimethylation (H3K27me3) and prostate cancer: relationship with clinico-pathological parameters. BMC cancer 2014; 14(1):994.
42. Allen-Brady K, Cannon-Albright L, Farnham JM, Teerlink C, Vierhout ME, van Kempen LoC, et al. Iden-tification of six loci associated with pelvic organ prolapse using genome-wide association analysis. Obstetrics and gynecology 2011; 118(6):1345.https://doi.org/10.1097/AOG.0b013e318236f4b5PMID:
22105264
43. Ward RM, Edwards DRV, Edwards T, Giri A, Jerome RN, Wu JM. Genetic epidemiology of pelvic organ prolapse: a systematic review. American Journal of Obstetrics and Gynecology 2014; 211(4):326–35.