PRETERM BIRTH PREDICTION AND RECEIPT OF POSTPARTUM CONTRACEPTION AMONG PARTICIPANTS OF NORTH CAROLINA’S
PREGNANCY MEDICAL HOME PROGRAM
Christine Marie Tucker
A dissertation submitted to the faculty of the University of North Carolina at Chapel Hill in partial fulfillment of the requirements for the degree of Doctor of Philosophy in
the Department of Maternal and Child Health.
Chapel Hill 2014
©2014
ABSTRACT
CHRISTINE MARIE TUCKER: Preterm Birth Prediction and Receipt of Postpartum Contraception among Participants of North Carolina’s Pregnancy Medical Home
Program
(Under the direction of Carolyn T. Halpern)
The purpose of this dissertation is to determine which combination of risk factors from Community Care of North Carolina’s Pregnancy Medical Home risk screening form is most predictive of preterm birth and to compare receipt of postpartum contraception for women who experienced a recent preterm birth with women who had a term birth. This retrospective cohort includes pregnant Medicaid beneficiaries screened by the program who delivered a live birth in North Carolina between September 2011 and September 2012. Data come from Community Care of North Carolina’s Case Management Information System, Medicaid claims, and birth certificates. The first paper of the dissertation designed and internally validated a predictive model of preterm birth using variables from the Pregnancy Medical Home risk screen. Logistic regression models and bootstrapping techniques
race/ethnicity including obesity, food insecurity, unsafe or unstable housing, and a short interpregnancy interval. Evaluation of the Pregnancy Medical Home risk screen provides insight to increase its sensitivity and specificity to improve identification of women early in pregnancy at highest risk for preterm birth. The second paper compared the prevalence of contraceptive receipt and effectiveness in Medicaid claims among women with and without a recent preterm birth using logistic and multinomial logistic regression. Contraceptive receipt was 50% (25% for the most effective methods) for women who delivered preterm at 90 days postpartum compared to 52% (28% for the most effective methods) among women who
ACKNOWLEDGEMENTS
I have been very fortunate to have Carolyn Halpern as my mentor and role model over the past five years. While I have learned so much from her about research, I am most grateful for her continual and non-judgmental support and the time she gives so willingly to mentor me.
This dissertation would not have been possible without Kate Berrien,
Pregnancy Medical Home Program Manager; Jill Ruppenkamp, Analytics Manager; and Carlos Jackson, Assistant Director of Program Evaluation from Community Care of North Carolina. The first aim of this dissertation came out of a need they identified in their program. Jill organized and pulled all the data for the analysis. Both Kate and Jill provided technical assistance and met with me to answer questions throughout the analysis. I enjoyed working with them and appreciate all the support they gave to me. I hope that the findings make a contribution to the Pregnancy Medical Home program.
Additionally I would like to thank Curt Martin, Pyreddy Reddy, Sandy Terrell, Robin Cummings, Matt Avery, and Vickie Pearce from the NC Department of Health and Human Services for facilitating my use of Medicaid claims and birth certificate data.
would also like to acknowledge Gretchen Stuart for providing feedback on the second aim. Additionally I would like to thank Sandy Martin, Associate Dean for Research, and Carolyn Halpern for advocating on my behalf to obtain permission to publish my findings using Medicaid data.
My education was also enhanced by my traineeship at the Carolina Population Center (T32 HD007168 and R24-HD050924), with thanks to Jan Hendrickson-Smith, Krista Perreira, Clare Barrington, Phil Bardsley, and Carolyn Halpern. I am very grateful for financial support from the HRSA MCH Doctoral Training in Health Disparities (Grant No. T03MC07643) and to Diane Rowley for providing this opportunity. I am also thankful for funding from the University of North Carolina, Chapel Hill Dissertation Completion Award. Thank you to Yvette
Thompson and Carrie Aldrich for help navigating through the MCH program. I feel so grateful to have spent many hours with such intelligent, down-to-earth, and fun women from my MCH cohort: Sherika Hill, McLean Pollock, and
Fernanda Queiros. Thank you to other MCH, CPC, and EPID friends Anisha Gandhi, Kat Tumlinson, Meghan Shanahan, Leslie deRosset, and Kelly Strutz for your
guidance. I’d like to thank my dissertation coach, Kate Clouse, for keeping me on track, and my yoga and Neal’s Deli buddy, Ali Groves, for keeping me sane.
TABLE OF CONTENTS
LIST OF TABLES ... x
LIST OF FIGURES ... xii
LIST OF ABBREVIATIONS ... xiii
CHAPTER 1. INTRODUCTION ... 1
PRETERM BIRTH AND HEALTH DISPARITIES ... 1
Risk Screening for Preterm Birth Prevention ... 3
Interconception Strategies for Preterm Birth Prevention ... 7
STUDY OVERVIEW ... 10
CHAPTER 2. PREDICTING PRETERM BIRTH AMONG PARTICIPANTS OF NORTH CAROLINA’S PREGNANCY MEDICAL HOME PROGRAM ... 11
INTRODUCTION ... 11
METHODS ... 14
Data Source ... 14
Measures ... 15
Analysis ... 18
RESULTS ... 20
Sociodemographic and Program Characteristics ... 20
Psychosocial Characteristics ... 20
Current Pregnancy Characteristics ... 21
Obstetric History Characteristics ... 21
Parity and Race/Ethnicity ... 23
Test Characteristics ... 24
Sensitivity Analyses ... 25
DISCUSSION ... 26
FIGURES AND TABLES ... 36
CHAPTER 3. RECEIPT OF POSTPARTUM CONTRACEPTION AMONG WOMEN WITH AND WITHOUT A RECENT PRETERM BIRTH ... 60
INTRODUCTION ... 60
METHODS ... 65
Data Source ... 65
Measures ... 66
Analysis ... 70
RESULTS ... 71
DISCUSSION ... 77
FIGURES AND TABLES ... 89
CHAPTER 4. CONCLUSIONS... 113
OVERVIEW OF FINDINGS ... 113
Use of the Pregnancy Medical Home Risk Screen, Birth Certificates, and Medicaid Claims Data ... 114
Contribution to the Literature on Risk Screening and Preterm Birth, Disparities in Birth Outcomes, and Interconception Health ... 116
Implications ... 118
APPENDIX. PREGNANCY MEDICAL HOME RISK SCREENING FORM ... 122
LIST OF TABLES
Table 2.1. Sociodemographic and Program Characteristics among Women Screened by the Pregnancy Medical Home Program,
Stratified by Preterm Birth (n=15,428). ... 37 Table 2.2. Psychosocial Characteristics among Women Screened
by the Pregnancy Medical Home Program, Stratified by
Preterm Birth (n=15,428). ... 39 Table 2.3. Current Pregnancy Characteristics among Women
Screened by the Pregnancy Medical Home Program,
Stratified by Preterm Birth (n=15,428). ... 41 Table 2.4. Obstetric History Characteristics among Women
Screened by the Pregnancy Medical Home Program,
Stratified by Preterm Birth (n=15,428). ... 44 Table 2.5. Crude Odds Ratios for Sociodemographic, Program
and Psychosocial Characteristics, and Preterm Birth among Women Screened by the Pregnancy Medical
Home Program (n=15,428). ... 46 Table 2.6. Crude Odds Ratios for Current Pregnancy and Obstetric
History Characteristics and Preterm Birth among Women Screened by the Pregnancy Medical Home Program
(n=15,428). ... 48 Table 2.7. Final Predictive Model for Preterm Birth with Bias Corrected
Confidence Intervals from Bootstrapping among Women Screened by the Pregnancy Medical Home Program
(n=15,428). ... 50 Table 2.8. Bootstrap Inclusion Fractions in Predicting Preterm Birth
(n=1,000). ... 51 Table 2.9. Adjusted Odds Ratios for Food Insecurity and Weight on
Preterm Birth, Stratified by Parity (n=15,428). ... 52 Table 2.10. Adjusted Odds Ratios for Housing and Short Interpregnancy
Interval on Preterm Birth, Stratified by Race/Ethnicity (n=15,428). ... 53 Table 2.11. Comparison of Risk Factors Prioritized by the Pregnancy
Medical Home Program to Risk Factors in the Final Predictive
Table 2.12. Test Characteristics of Models Predicting Preterm Birth among Women Screened by the Pregnancy Medical Home
Program (n=15,428). ... 56 Table 3.1. Sociodemographic, Health, and Access Characteristics among
Women Screened by the Pregnancy Medical Home Program,
Stratified by Preterm Birth (n=32,647). ... 91 Table 3.2. Sociodemographic, Health, and Access Characteristics among
Women Screened by the Pregnancy Medical Home Program, Stratified by Receipt of Contraception 90 Days after Delivery
(n=32,647). ... 93 Table 3.3. Receipt of Contraception and Method Type 90 Days after Delivery
among Women Screened by the Pregnancy Medical Home Program,
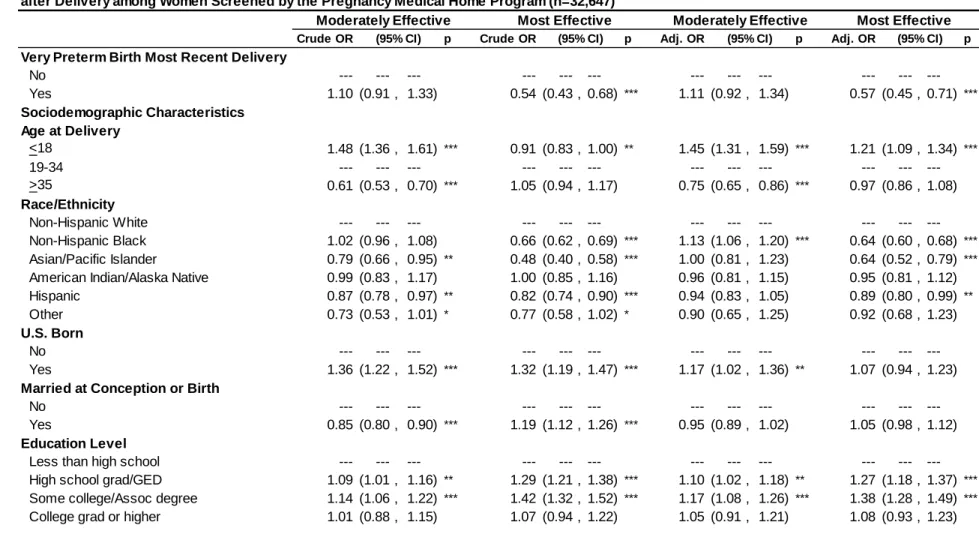
Stratified by Preterm Birth (n=32,647). ... 95 Table 3.4. Crude and Adjusted Odds Ratios for Sociodemographic, Health
and Access Characteristics and Receipt of Contraception 90 Days after Delivery among Women Screened by the Pregnancy
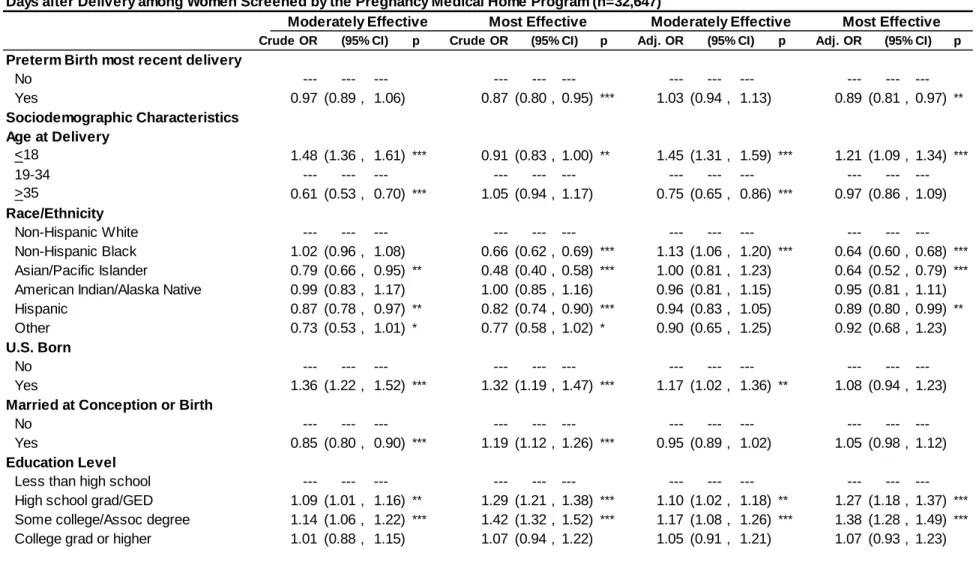
Medical Home Program (n=32,647). ... 97 Table 3.5. Crude and Adjusted Odds Ratios for Sociodemographic, Health,
and Access Characteristics and Method Effectiveness 90
Days after Delivery among Women Screened by the Pregnancy
Medical Home Program (n=32,647). ... 100 Table 3.6. Sociodemographic, Health, and Access Characteristics among
Women Screened by the Pregnancy Medical Home Program,
Stratified by Very Preterm Birth (n=32,647). ... 103 Table 3.7. Receipt of Contraception and Method Type 90 Days after Delivery
among Women Screened by the Pregnancy Medical Home Program,
Stratified by Preterm Birth (n=32,647). ... 105 Table 3.8. Crude and Adjusted Odds Ratios for Sociodemographic, Health,
and Access Characteristics and Receipt of Contraception 90 Days after Delivery among Women Screened by the Pregnancy
Medical Home Program (n=32,647). ... 107 Table 3.9. Crude and Adjusted Odds Ratios for Sociodemographic, Health,
and Access Characteristics and Method Effectiveness 90
Days after Delivery among Women Screened by the Pregnancy
LIST OF FIGURES
Figure 2.1. Analysis Sample. ... 36 Figure 2.2. Receiver Operating Characteristic (ROC) curve for
the final predictive model of preterm birth among women screened by the Pregnancy Medical Home
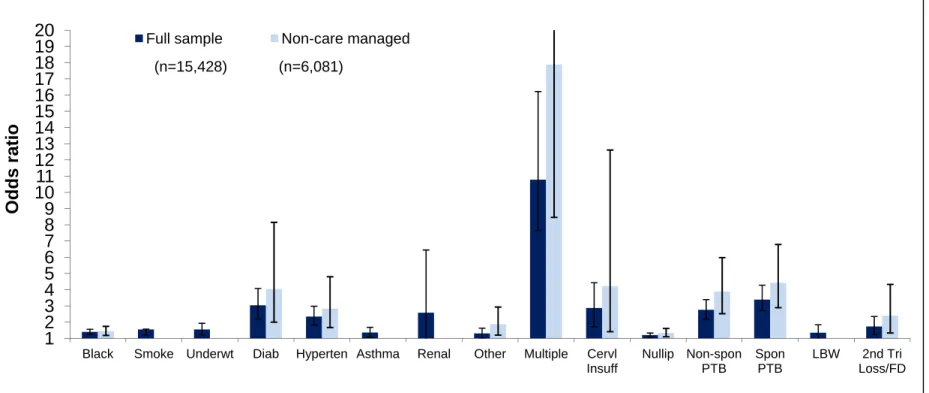
program (n=15,428). ... 55 Figure 2.3. Sensitivity analyses comparing odds ratios and 95%
confidence intervals from model selection in the full
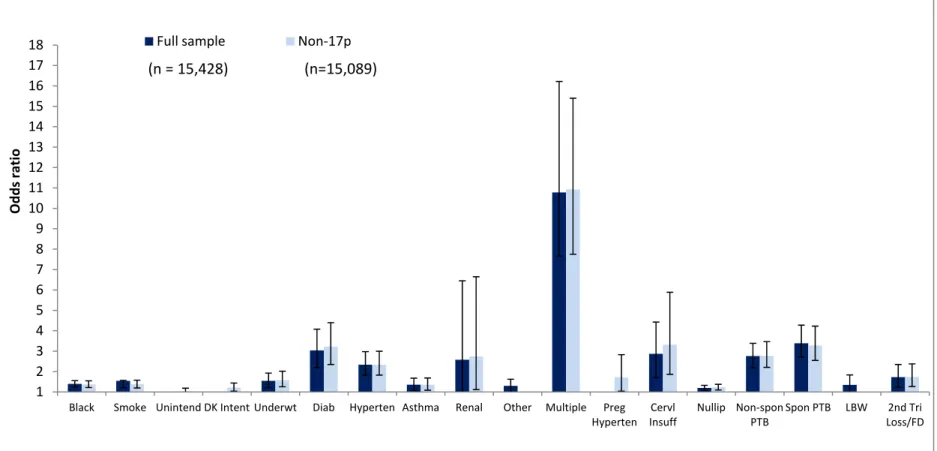
sample and among women not receiving care management. ... 57 Figure 2.4. Sensitivity analyses comparing odds ratios and 95%
confidence intervals from model selection in the full
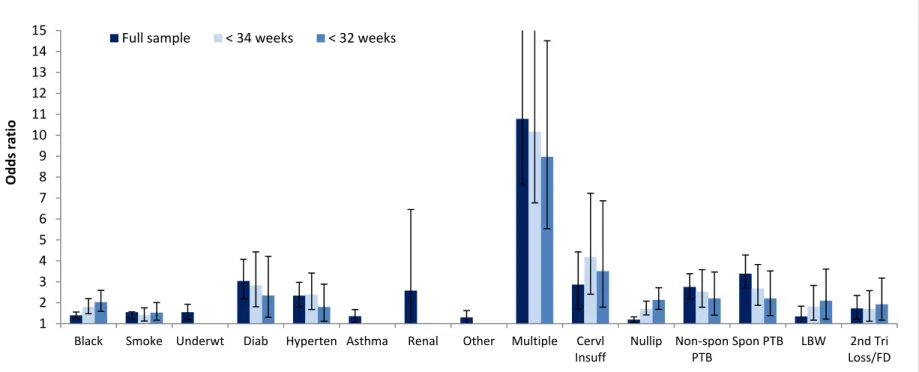
sample and among women not receiving 17p. ... 58 Figure 2.5. Sensitivity analyses comparing odds ratios and 95%
confidence intervals from model selection with different
outcome definitions (less than 37, 34, and 32 weeks gestation). ... 59 Figure 3.1. Analysis sample. ... 89 Figure 3.2. Conceptual model depicting hypothesized relationships
LIST OF ABBREVIATIONS
aOR adjusted odds ratio
API Asian/Pacific Islander
BMI body mass index
BIF Bootstrap Inclusion Fraction
CA California
CMIS Case Management Information System CCNC Community Care of North Carolina
CI confidence interval
DMA Division of Medical Assistance DPH Division of Public Health
GED General education development
HEDIS Healthcare Effectiveness Data and Information Set HELLP Hemolysis, elevated liver enzymes, low platelet count
ID identification
IOM Institute of Medicine IPI interpregnancy interval IUC intrauterine contraception LMP last menstrual period LCA latent class analysis
LARC Long-acting reversible contraception
LBW low birth weight
MD Maryland
NSFG National Survey of Family Growth
NHB Non-Hispanic black
NHW Non-Hispanic white
NC North Carolina
n number
OE obstetric estimate
OR odds ratio
p p-value
PMH Pregnancy Medical Home
PRAMS Pregnancy Risk Assessment and Monitoring System
PTB preterm birth
ROC Receiver operating characteristic SCHS State Center for Health Statistics
SQL Structured Query Language
U.S. United States
CHAPTER 1. INTRODUCTION
PRETERM BIRTH AND HEALTH DISPARITIES
Preterm birth (deliveries <37 completed weeks of gestation) is a major cause of infant mortality and morbidity.1,2 In 2009, 35% of infant deaths were ‘‘preterm-related.’’2 Preterm birth (PTB) is associated with an array of short- and long-term health consequences. As detailed in the Institute of Medicine’s (IOM) report on PTB, preterm infants are at higher risk for neonatal intensive care admission, prolonged hospital stay due to morbidity in the first few weeks of life, re-hospitalization in the first years of life, and other longer-term outcomes such as respiratory,
gastrointestinal, and neurodevelopmental complications.3 These health
complications have a large societal cost as well as an emotional cost to parents and families. The IOM estimated the total annual economic burden of PTB in the United States in 2005 to be at least $426.2 billion.3 This translates into $51,600 spent per infant born preterm.3
In the most recently available natality data from 2012, the prevalence of PTB was 11.55% nationally and highest for non-Hispanic black women (16.53%),
followed by Hispanic women (11.58%), and non-Hispanic white women (10.29%).4 The Healthy People 2020 goal is to reduce the preterm birth rate to 11.40%.5
were associated with preterm birth, however these factors did not explain the increased risk of PTB among black women compared to white women in Alabama.9 In contrast, among a sample of low-income urban black women in Baltimore, MD, chronic disease pre-pregnancy was significantly associated with PTB.10 This finding is consistent with the “weathering hypothesis” that poorer overall health among black women in the United States contributes to their greater burden of preterm birth11 and supports the life course framework in the study of disparities in birth outcomes.12
In addition to the prevalence of co-morbidities, other potential explanations for these disparities include differential access to care and quality of care, psychosocial stress, poverty, social context or environmental exposures, racism, preconception health differentials, infection/inflammation, and genetic factors.13–16 Unfortunately previous attempts to reduce disparities have not been successful.13 Improvement of birth outcomes in the United States hinges on our ability to better understand and reduce this racial gap.13,17
In North Carolina, the setting of this dissertation, the prevalence of PTB is higher than the national average.In 2012, the National Center for Health Statistics (NCHS) calculated that 12% of births in NC were preterm.4 Racial/ethnic disparities in
2012, which appears lower than estimate for NC as a whole calculated by the NCHS using last menstrual period.20
Risk Screening for Preterm Birth Prevention
Since the 1970s, a multitude of researchers have attempted to develop risk screening tools to identify women early in pregnancy who will eventually deliver preterm.21,22 Despite enhanced understanding of multiple factors that increase the risk of PTB, no predictive model to date has been accurate enough to justify its use in the clinical setting.3,21–23 Previous risk scoring systems have only been able to identify a small proportion of women who have a PTB as high risk (low sensitivity), while a large proportion who have a PTB have been labeled as low risk (high false negative rate).21
Risk screens typically consist of a questionnaire filled out by the patient or an oral history taken by the provider around the time of the first prenatal visit;
sometimes a re-screen is conducted later in pregnancy to update the information.21 Screening tools elicit information on sociodemographic factors, obstetric history, and characteristics of the current pregnancy in asymptomatic women.21 Risk factors are often added together to form a composite risk score. The weighting of each risk factor and the threshold at which women are considered to be high risk is often determined based on clinical knowledge or statistical analysis.21 From logistic
To determine the usefulness of risk scoring systems in clinical practice, the sensitivity, specificity, and positive and negative predictive values of the instruments in relation to preterm birth can be calculated. More recently, methods to internally validate predictive models have been used such as split sample validation, cross-validation, and bootstrapping.
One example of an evaluation of a previous risk scoring system comes from the preterm birth prediction assessment system study conducted by Mercer et al. in the early 1990s.24 In this study, nearly 3,000 women with singleton pregnancies were recruited at 10 centers of the Maternal-Fetal Medicine Units Network prior to 24 weeks gestation and assessed for information on demographic factors, home and work environment, drug and alcohol use, and medical history. The outcome of interest was spontaneous PTB prior to 37 weeks of gestation.
Predictive models were developed separately among nulliparous and multiparous women using 85% of the sample and then validated in the remaining 15% of the sample. For nulliparous women, black race, a poor social environment, paid employment, lung disease, a higher Bishop score (a score given to the cervix assessed by vaginal exam), low body mass index (BMI), and contractions were predictive of spontaneous preterm birth.24 Among multiparous women, a prior spontaneous preterm delivery, vaginal bleeding, low BMI, and increasing Bishop score was predictive of spontaneous PTB.
risk. For nulliparous women, the sensitivity, specificity, positive predictive value, and negative predictive value of the model were 18.2, 95.4, 33.3, and 90.2,
respectively.24 Though this assessment system was able to accurately predict women who did not go on to have a spontaneous PTB (high specificity), its ability to detect women who would have a spontaneous preterm delivery was poor (low sensitivity). The likelihood ratio for a positive test (women with a 20% probability or higher) was 3.9 (95% confidence interval (CI) 1.3–12.0) and the likelihood ratio for a negative test (women with less than a 20% probability) was 0.9 (95% CI 0.7–1.0).
Model performance was slightly more selective for the multiparous sample, however other measures of test performance were lower. The sensitivity, specificity, positive predictive value, and negative predictive value of the model among
multiparas were 24.2, 92.1, 30.8, and 89.4, respectively.24 The likelihood ratio for a positive test was 2.9 (95% CI 1.4–6.1) and for a negative test was 0.8 (95% CI 0.7– 1.0). The authors concluded that despite 84.6% of predictions being correct, the system does not identify most women who subsequently have a spontaneous preterm delivery.24
Aside from the Creasy risk scoring system, others have not been evaluated outside the populations in which they were developed nor evaluated prospectively.21 Further, few studies have specifically examined births prior to 34 weeks gestation despite the fact that most of the neonatal mortality and morbidity occurs in that range and risk factors may differ depending on the gestational age at which PTB occurs.21
A recently published Cochrane review found no trials evaluating the use of risk scoring systems on PTB and thus concluded that the role of risk scoring systems in the prevention of PTB is unknown.26 More accurate tools with better quality information are needed that improve the identification of women at increased risk of PTB in clinical practice.21 To achieve this, research that studies multiple risk factors and evaluates risk-screening tools among large and diverse prospective cohorts is warranted.3,21,26
Risk screening is intended to guide caregivers’ and women’s decision-making about the management of their pregnancy as well as target costly interventions to women at highest risk.21,26,27 The utility of a risk scoring system depends on the prevention and treatment options available to women identified as high risk.21
Possible interventions that could be paired with a risk scoring tool include channeling high-risk women into intensive multidisciplinary care,28 individualized risk reduction counseling to women focusing on modifiable risk factors,22 and ensuring that the birth occurs in a facility with a neonatal intensive care unit.26 Medical treatments that could complement a risk scoring tool include prevention of a subsequent
through tocolytics (drugs that dampen the contractions),26 and administration of antenatal corticosteroids to improve neonatal outcomes.23,30
Interconception Strategies for Preterm Birth Prevention
Once a woman has been identified as high risk for PTB or has experienced a PTB, interconception care strategies can help to mitigate future risk. In a 12-step plan to reduce disparities in birth outcomes, Lu and colleagues’ (2010) first recommendation is to provide interconception care to women with prior adverse pregnancy outcomes.31 Although an entire package of health care and support services has been proposed in the interconception period,32 this dissertation focuses on one area—postpartum contraception to optimize interpregnancy intervals (IPIs) and avoid unintended pregnancies.
Women who have experienced a PTB are at higher risk for having a
subsequent preterm birth.33–35 In the Preterm Birth Prediction Study, there was a 2.5-fold increase in the risk of spontaneous preterm delivery among women with a prior spontaneous delivery, particularly those occurring before 28 weeks gestation, compared to women with no prior spontaneous delivery.36 Black women have been shown to have a higher recurrence of preterm delivery as compared to white
women.37 Little is known about the specific health-related conditions and behaviors that account for this increased risk.38
Two interconception care strategies to reduce PTB are increasing
interpregnancy intervals and avoiding unintended pregnancies, particularly among women who have experienced a previous PTB.39 A short interval between
than six months following a live birth had an odds ratio of 1.4 (95% CI 1.3–1.5) for PTB as compared to those conceived 18 to 23 months after a live birth.46 These findings, that a birth interval of 18 to 23 months is protective, have been documented among both black and white women.44,47 Furthermore, short IPIs are also associated with an increased risk of recurrent PTB among women who experienced a previous PTB. 48 DeFranco et al. (2007) found that as the IPI decreased, the risk of recurrent PTB after adjusting for other important risk factors increased.48
In the United States, nearly half of all pregnancies are unintended.49 Women whose pregnancies are unintended are more likely to deliver preterm.50,51 This finding has not been consistent among studies, however. For instance, in one study, the risk of preterm birth was increased among unintended pregnancies for white and immigrant Latina women but not for black or U.S.-born Latina women.52 It is also not clear whether this is a causal association or whether the finding reflects residual confounding based on differences in sociodemographics and health behaviors of women who have unintended versus intended pregnancies.50
Given the increased risks associated with a history of PTB, short IPIs, and unintended pregnancy, it is recommended that women wait at least 12 months between delivery and subsequent conception, particularly those with a previous PTB.48 To successfully space births and to avoid unintended pregnancies, women need access to contraception in the postpartum period. However, data on
To our knowledge only one study has specifically examined postpartum contraception use among women with a recent PTB.38 In this community-based randomized control trial, the Philadelphia Collaborative Preterm Prevention Project, women with a recent delivery of a living singleton infant at fewer than 35 weeks of gestation were followed at 6 months postpartum to assess the relationship between their desire to prevent or delay subsequent pregnancies and the effectiveness of their contraceptive use. Over half of the 658 women who participated in the six-month assessment wanted to delay a pregnancy but reported using contraceptive methods classified as low or moderate in effectiveness, such as withdrawal or no method at all.38 However the reasons why so many expressed wanting to delay pregnancy but did not use a more effective method of contraception are unknown. The only variable that significantly predicted the use of a less effective contraceptive method among women wanting to delay pregnancy was low education.38
Despite the contribution this study makes to the dearth of research on
STUDY OVERVIEW
This dissertation analyzes risk screening data collected from a retrospective cohort of pregnant women with Medicaid coverage during pregnancy who delivered a live birth in North Carolina between September 2011 and September 2012. The purpose of this dissertation is to develop and validate a risk scoring model for PTB based on risk factors from the PMH risk screening tool among women screened early in pregnancy to more effectively identify and target women at highest risk for PTB for care management. In Chapter 2, the combination of risk factors most
CHAPTER 2. PREDICTING PRETERM BIRTH AMONG PARTICIPANTS OF NORTH CAROLINA’S PREGNANCY MEDICAL HOME PROGRAM
INTRODUCTION
In 2012, the National Center for Health Statistics (NCHS) calculated that 12.0% of births in North Carolina were preterm, higher than the national average of 11.6%.4 Racial/ethnic disparities in PTB have persisted for generations with non-Hispanic black (NHB) women having the highest rate (16%).4,18 In NC, the PTB rate is higher among births covered by Medicaid.53 The concentration of PTB in
populations of lower socioeconomic status places a burden on publicly financed health care.19
In response to high rates of PTB in NC, Community Care of North Carolina (CCNC) launched the Pregnancy Medical Home (PMH) contract in partnership with the North Carolina Division of Medical Assistance (DMA) in 2011. CCNC, a not-for-profit organization, manages the care of Medicaid recipients statewide. The PMH program seeks to provide evidence-based, high-quality maternity care to improve birth outcomes in the pregnant Medicaid population.54 Eighty-five percent of all NC prenatal care providers (over 380 practices and clinics) serve as PMHs, including obstetricians, family physicians, federally qualified health centers, rural health clinics, local health departments, and nurse midwives.55,56
management to address modifiable risk factors. Risk screening is intended to target care management services to women at highest risk and guide caregivers’ and women’s decision-making about the management of their pregnancy.21,26,27 As a result of screening, local health departments working in partnership with CCNC networks provide pregnancy care management services to women. The level of service provided is in proportion to the individual’s identified needs. Care managers closely monitor the pregnancy through regular contact with the physician and patient to promote a healthy birth outcome. Additionally, eligible women with a history of spontaneous PTB or preterm rupture of the membranes who are currently pregnant with a singleton are offered 17alpha hydroxyprogesterone (17p). Pregnancy care management services continue through the postpartum period, which is defined by Medicaid as ending on the last day of the month in which the sixtieth postpartum day occurs.
The risk screening tool includes over 40 demographic, psychosocial, current pregnancy, and obstetric history risk factors. About 10 conditions are considered priority risk factors and will automatically trigger an assessment by a pregnancy care manager.56 Priority risk factors include:
current or recent tobacco or substance use;
unsafe living environment (e.g., homelessness, inadequate housing, intimate partner violence, sexual abuse);
presence of chronic disease (e.g., diabetes, hypertension, human immunodeficiency virus, systemic lupus erythematosus, mental illness);
fetal complication (fetal anomaly, fetal chromosomal abnormality, intrauterine growth restriction, oligohydramnios, polyhydramnios, and others);
multi-fetal gestation;
hospitalization or emergency department use during pregnancy.
The healthcare provider can also check a box to request pregnancy care management.
The priority risk factors were chosen based on evidence reviewed by a multidisciplinary workgroup. The goal was to identify risk factors with the strongest associations with PTB, with consideration given to modifiable factors that drive increased use of the healthcare system and could be addressed through care management.
It was anticipated that the risk screening would prioritize about half of pregnant Medicaid beneficiaries for care management. However, in practice the screening tool is not as specific as intended. Between January and June 2012, more than 75% of pregnant Medicaid patients (20,288) were screened, of which two-thirds had a least one priority risk factor.56 Under the current prioritization scheme, the priority population exceeds the capacity of the pregnancy care management program. Furthermore, it is not known whether the current priority risk factors are identifying those women at highest risk for PTB.
women with Medicaid identified early in pregnancy. Information gained through this evaluation will help better target resources to those most likely to benefit from intervention and tailor care management to specific risk profiles.
METHODS
Data Source
We conducted a retrospective cohort analysis using data from CCNC’s Case Management Information System (CMIS), Medicaid claims, and birth certificates. Birth certificate data are matched to Medicaid delivery claims in the Division of
Medical Assistance (DMA) data warehouse using Structured Query Language (SQL) Server Integration Services Fuzzy Lookup component software, producing a match rate of 95%.
The risk screening is administered at the first prenatal visit (median of 13 weeks gestation) and is entered into CMIS. The provider collects a medical history and checks a box for the presence of a risk factor. Psychosocial questions like
pregnancy intention are self-administered in English, Spanish, or Russian, or may be completed through a patient interview. Risk screening forms must be provided within 7 days of completion to the pregnancy care manager, who in turn must conduct an assessment within 30 days. Providers may rescreen the patient at any time during the pregnancy if high-risk conditions are suspected.
gestational period was linked to the index birth via the mother’s Medicaid identification number (ID).
All women with a valid risk screening collected between August 31, 2011, and May 20, 2012, and with a corresponding delivery between September 1, 2011, and September 30, 2012, were eligible for this analysis (n=22,612). Women were excluded if they were screened before 6 weeks or at or after 24 weeks gestation (n=6,002), if they had only Emergency Medicaid (n=7), or had a live birth prior to 24 weeks gestation (n=62). Additionally, women missing data on risk factors from the screening that could not be substituted with birth certificate data were excluded (n=1,093, or 6.6%). The final sample size was 15,428 women (Figure 2.1).
All study procedures were reviewed and approved by the Institutional Review Board for the Protection of Human Subjects at the University of North Carolina at Chapel Hill.
Measures
Preterm birth (less than 37 weeks completed gestation) was defined using the OE of gestation from the birth certificate. This method differs from the NCHS
Psychosocial Characteristics
Pregnancy intention was collapsed into three categories: intended (wanted to be pregnant sooner/now) [referent], unintended (wanted to be pregnant later/did not want to be pregnant then or any time in future), or don’t know. Missing information on smoking (2%) was substituted with values from the birth certificate (kappa for non-missing 3-category smoking 0.69). Smoking was a 4-part categorical variable: never or <100 cigarettes ever [referent], stopped smoking before found out was pregnant, stopped smoking after found out was pregnant, and smoke now but cut down, or smoke same amount since found out was pregnant. Questions on whether the participant’s parent, friend, and/or partner had a problem with alcohol or other drug use were combined into one substance abuse variable equal to one if any member had a substance problem. Questions assessing drug and alcohol use before pregnancy and in the past month were dichotomized as any (rarely, sometimes, or frequently) [referent] vs. none.
Current Pregnancy Characteristics
Delayed prenatal care was defined as initiation after 14 weeks gestation. A short IPI was fewer than 12 months between the last live birth and current
(kappa for non-missing 4-category BMI 0.78) and categorized into four groups: underweight (<18.5), normal (18.5-24.9) [referent], overweight (25.0-29.9), or obese (>30).
Obstetric History
For multivariate modeling, fetal death (>20 weeks) and second trimester pregnancy loss were combined into one variable, as was a history of cervical insufficiency and cervical insufficiency in the current pregnancy.
Sociodemographic and Program Characteristics
We used several measures from birth certificates and Medicaid claims including maternal age, race/ethnicity, parity, and Medicaid program status. Age at delivery was calculated by subtracting the mother’s date of birth in Medicaid claims from the delivery date on birth certificates and categorized as <18, 19–34 [referent] and >35. Race/ethnicity from the birth certificate was categorized as non-Hispanic white [referent], non-Hispanic Black, Asian/Pacific Islander, American Indian/Alaska Native, and Hispanic. Multiple or “other” race participants were reassigned in the following priority: Hispanic, Black, Asian/Pacific Islander, and American
Indian/Alaska Native. Parity from the birth certificate was calculated by adding the number of live births now living and now dead and dichotomized as nulliparous vs. parous [referent]. Medicaid program status was collapsed into Medicaid for Pregnant Women or any other category of Medicaid. Additional information about the
Analysis
Descriptive statistics and bivariate analyses (including Pearson’s chi-square tests) were used to compare the distributions of all the risk factors from the risk screening tool and PTB. We examined crude associations between risk factors and PTB using logistic regression. Any risk factor from the risk screening
(sociodemographic, psychosocial, current pregnancy, and obstetric history
characteristics) that was significant at the p<0.05 level in the Pearson’s chi-square tests or in the crude logistic regression model was included in the first full model. Backwards stepwise elimination was used to determine the optimal combination of risk factors for PTB, eliminating variables with a p-value greater than 0.05. All analyses were conducted using Stata version 13.0 (StataCorp. 2013. Stata Statistical Software: Release 13. College Station, TX: StataCorp LP.)
To obtain an unbiased internal assessment of the predictive performance of the final model in the full sample, we used bootstrapping.58,59 After fitting the model in the original dataset, we conducted backwards stepwise deletion in 1,000
bootstrap samples with replacement from the original sample and present bias-corrected (BC) confidence intervals (CIs) from the bootstrap results.
confidence intervals for each level of the potential modifier did not overlap or they overlapped but neither included the other point estimate). For the race/ethnicity interaction model, we excluded Hispanic (n=1,243), Asian/Pacific Islander (n=383), and American Indian/Alaska Native (n=436) participants due to small cell sizes and based on our interest in disparities between Hispanic black (NHB) and non-Hispanic white (NHW) women.
We calculated the predicted probability of PTB for each woman using the linear predictor from the final model. We used receiver operating characteristic (ROC) curve analyses to determine the high-risk threshold for PTB at the point on the curve where the sum of sensitivity and specificity was highest. Using this cutoff, we calculated measures of model performance such as the sensitivity, specificity, and positive and negative predicted values.
Additionally, we conducted several sensitivity analyses. We compared sample characteristics to the population of live births occurring in NC during this same time frame. To examine whether the intervention affected associations between risk factors and PTB, we compared model selection in the full sample to women who did not receive care management and women who did not receive 17p treatment. To examine how sensitive model selection was to our definition of PTB, we examined stricter classifications of <32 and <34 weeks completed gestation given that the bulk of mortality and morbidity occur in earlier gestational ages and there may be
RESULTS
Sociodemographic and Program Characteristics
The prevalence of PTB was 11.0% (Table 2.1), higher than the rate we calculated among all resident live births in NC during the same time period (10.1%), even with the additional 0.4% of births at less than 24 weeks that were excluded from our sample. Compared to all resident live births in NC from September 2011– September 2012, our Medicaid sample screened before 24 weeks gestation was younger, less educated, less likely to be married, and more likely to be NHB or American Indian/Alaska Native and less likely to be NHW or Hispanic. Also, women in our sample were more likely to smoke, be underweight or obese, and be
nulliparous.
Preterm birth was more frequent among NHB women, those 35 years or older, unmarried women and women born in the United States (Table 2.1). Women who screened positive for one or more priority risk factors and received care
management (61%) had a higher prevalence of PTB than women who were not care managed. Administration of 17p was documented in only 2% of the sample; 23% of those women had a PTB.
Psychosocial Characteristics
continued to smoke after they found out they were pregnant, and among them, the PTB prevalence was 13%.
Current Pregnancy Characteristics
Table 2.3 displays current pregnancy characteristics including chronic diseases and other conditions that affected the current pregnancy. A high percentage of births with multi-fetal gestation, fetal complications, and cervical insufficiency resulted in a PTB. Nearly 17% of women had a chronic condition. Among the chronic diseases assessed, women with diabetes, hypertension, asthma, renal disease, and other chronic conditions (e.g., thyroid disease and anemia) had a higher prevalence of PTB. Women with hypertensive disorders had a higher
prevalence of PTB. Fifteen percent of women had providers who requested an assessment and these women had a higher prevalence of PTB than women whose providers did not request an assessment.
Obstetric History Characteristics
The prevalence of prior adverse pregnancy outcomes ranged from 0.3% for a history of cervical insufficiency to 7.5% for a previous PTB. All of the obstetric history variables assessed affected prevalence of PTB (Table 2.4) with the exception of postpartum depression.
Tables 2.5 and 2.6 show the crude odds ratios and 95% confidence intervals. Older and NHB women had higher odds of PTB. Among the psychosocial risk
Women with multi-fetal gestation, fetal complications, chronic disease, or cervical insufficiency all had elevated odds ratios for PTB, as did women whose provider requested that they receive a pregnancy care assessment (Table 2.6). Underweight and obese women also had an increased risk of PTB. Women who obtained late prenatal care, had a communication barrier, or were having their first pregnancy had reduced odds of PTB. All prior adverse pregnancy outcomes were associated with elevated odds of PTB with the exception of postpartum depression. Predictive Model of Preterm Birth
The final predictive model in the full sample included 15 variables (Table 2.7). Bias-corrected confidence intervals from model selection generated using 1,000 bootstrap replications are presented in Table 2.7 and are similar to 95% CIs in the original sample. Individual dummy variables that were not significant but part of a variable that was a significant predictor were also included in the model.
Non-Hispanic black race (OR=1.40, BC 95% CI: 1.25, 1.56) continued to be a statistically significant predictor of PTB once a variety of psychosocial, current pregnancy, and obstetric history risk factors were included. The only psychosocial risk factor that remained in the final model was continuing to smoke throughout pregnancy (OR=1.37, BC 95% CI: 1.21, 1.57), but those who quit after finding out they were pregnant were not at increased risk. Among current pregnancy characteristics, underweight remained a statistically significant risk factor, however obesity was no longer associated with an elevated risk of PTB.
PTB as parous women (BC 95% CI: 1.06, 1.33) when adverse reproductive history variables were included in the model. Among the adverse obstetric history risk factors, a history of PTB, delivering a LBW infant, and fetal death/second trimester loss remained statistically significant at p<0.05. Additionally, for each risk factor that was included in the first full model before backwards stepwise selection, we present the bootstrap inclusion fractions, or the percent of bootstrap samples in which each risk factor appeared (Table 2.8).
Parity and Race/Ethnicity
Two risk factors, food insecurity and BMI, had associations with PTB that differed by parity (Table 2.9). Parous women had an elevated risk of PTB associated with food insecurity (OR = 1.41, 95% CI: 1.04, 1.91) but nulliparous women did not (OR = 0.81, 95% CI: 0.58, 1.13). As previously documented, obesity was associated with a higher risk of PTB among nulliparous women only (OR for obese = 1.31, 95% CI: 1.07, 1.59),60–62 while obesity appeared protective for PTB among parous women (OR = 0.74, 95% CI: 0.62, 0.87).
Two risk factors varied by race/ethnicity. Unsafe or unstable housing was associated with an increased risk of PTB among NHW women (OR = 1.46, 95% CI: 1.06, 2.02) but not NHB women (Table 2.10). An interpregnancy interval (IPI) of less than 12 months was associated with an increased risk of PTB birth among NHB women only (OR =1.39, 95% CI: 1.02, 1.88).
Table 2.11 compares risk factors currently prioritized by the PMH program to risk factors in our final model in the full sample and those significant among
remained in our models (Table 2.11, column B). Several risk factors that remained in the final model and interaction analyses are not prioritized by the program (Table 2.11, column C). Several more that are prioritized by the PMH program did not remain in the final model or subgroup analyses (quitting smoking once finding out about pregnancy, current or recent drug or alcohol use, intimate partner violence, sexual abuse, HIV, SLE, seizure disorder, mental illness, and fetal complications) (Table 2.11, column D).
Test Characteristics
The ROC of the final model was 0.66 (Figure 2.2). The point on the curve that optimized both sensitivity and specificity was a predicted probability of 0.11. Using 0.11 or higher as our risk cutoff, 22% of women screened positive. The sensitivity was 44%, specificity 81%, positive predictive value 22%, and negative predictive value 92% (Table 12). Seventy-six percent were correctly classified. However, this risk cutoff is quite restrictive and refers fewer women for care management than the program has resources to serve. For most risk factors, it would take several in combination to reach this threshold. Furthermore, the percent of women who screen negative and go on to have a PTB is 56% according to a 0.11 cutoff. A lower cutoff of 0.085 fits the program’s capacity to intervene with half of women. Although the specificity and PPV are reduced, fewer women who go on to have a PTB are missed (false negative rate is 29%).
PMH program’s current prioritization scheme, we calculated test characteristics based on the number of women having at least one priority risk factor. The ROC was lower (0.64, p <0.0001). The test characteristics demonstrated the poorer
performance, with the exception of sensitivity and the false negative rate for true PTB, of the current prioritization scheme in which every risk factor is weighted the same and 71% of women screen positive.
Sensitivity Analyses
We compared model selection in the full sample with women who did not receive care management (n=6,081). Given the smaller sample size, most measures were stronger in magnitude and less precise (Figure 2.3). All variables from the final model in the full sample remained statistically significant predictors of PTB at p<0.05 except smoking, underweight, asthma, renal disease, and LBW. Next we excluded women who received 17p treatment (n=339), and model selection yielded results similar to the full sample except that LBW and “other” chronic conditions fell out of the model and current pregnancy hypertensive disorders and pregnancy intentions remained in the model (Figure 2.4).
DISCUSSION
We evaluated the PMH risk screening tool to determine the optimal combination of risk factors most predictive of PTB and internally validated our predictive model among a large and diverse cohort of women screened early in pregnancy. The final predictive model included: non-Hispanic black race, continuing to smoke during pregnancy, underweight, multi-fetal gestation, chronic diseases (diabetes, hypertension, asthma, renal disease, and other), cervical insufficiency, nulliparity, and a history of PTB, LBW, and fetal death/second trimester loss. To provide care management to those at greatest risk and reduce PTB rates and associated costs, the PMH program should target resources to women with these risk factors.
Our final predictive model improves on the current PMH prioritization scheme, which weights all priority risk factors equally and screens in 70% of women. The specificity and PPV of our final predictive model are higher than those of the priority risk factor model (specificity: 81% vs. 31% and PPV: 22% vs. 12%). The sensitivity of our final model is lower than the priority risk factor model (44% vs. 79%), but comparable to the sensitivity of other risk scoring systems, typically below 40%.24,25,
28,30,63–65
However, comparison across studies is hampered by differing outcome definitions, by mode of delivery (spontaneous vs. all), and by gestational age (early PTB <32 vs. <37 weeks), as well as different PTB prevalence and scores for a positive test.
interaction by parity (because risk scoring tools are more discriminating for multigravida women given the importance of obstetric history)21,25 and by
race/ethnicity. Addition of variables that were highly predictive of PTB among certain subgroups (food insecurity, obesity, unsafe or unstable housing, and short IPIs) slightly improved the predictive ability of the model. The PMH program should consider including these as priority risk factors given their importance among vulnerable subgroups, particularly nulliparous and NHB women.
Based on our final model in the full sample and our interaction analyses, we have several recommendations for revising the risk screen. First, variables currently prioritized that remained in our final model should continue to be prioritized (current smoking, diabetes, hypertension, asthma, renal disease, other chronic conditions, multi-fetal gestation, and previous PTB and LBW) (Table 2.11, column B). Given the current tool’s lower sensitivity and PPV, which refers any woman for assessment with at least one priority risk factor and counts all factors equally, applying weights to the risk factors based on the odds ratios from the final model could increase the predictive value of the tool by decreasing the prevalence of a positive test.
focus on higher-risk women. Delayed prenatal care could be dropped as a priority risk factor because this had an inverse relationship with PTB, likely due to the increased likelihood of women entering care late to be younger, Hispanic, foreign-born, and less likely to have had a previous adverse outcome or carry multiples. This would remove 1,148 women who had no other priority risk factor. Among the 1,148 that would no longer be eligible for care management, 181 cases of PTB would be missed. Before risk factors are removed from the priority list, it will be important to verify through similar analyses that these factors are not highly predictive of other important maternal and child outcomes that the program aims to impact.
Third, consideration should be given to adding several risk factors that
remained in the final models but are not currently prioritized (Table 2.11, column C). Adding underweight (n=703, 5%), cervical insufficiency (n=102, 1%), and fetal death/second trimester loss (n=317, 2%) is advisable because they are likely to increase the predictive value of the tool. Additionally, some of these risk factors are amenable to intervention, which is an important consideration for the PMH program. In all, 1,122 high-risk women would be added, a net reduction of 1,204 women.
We sought to identify risk factors that would be amenable to intervention within these groups. Eleven percent (n=1,792) of nulliparous women were obese, of which 31% had no other priority risk factor. Given the increased risk of PTB among obese nulliparous women, intervening on obesity may be one strategy to focus resources on a subgroup of nulliparous women more likely to benefit from intervention.
Only one risk factor, a short interpregnancy interval, increased the odds of PTB differentially for NHB women. About 6% or 353 NHB women had a short IPI, of which 25% had no other priority risk factor. Previous studies have shown that black women are 1.8 times more likely to have short IPIs compared to whites, particularly intervals less than six months.40,45,66,67 Our findings are consistent with the
“weathering hypothesis,” that poorer overall health among black women in the United States contributes to their greater burden of PTB.11 Perhaps a short interval between pregnancies compounds the risk for black women who may have poorer health over the life course.12
Interaction between short IPI and race has been tested in previous studies but not supported,40,47,66,67 with the exception of one study among military women in which Rawlings et al. (1995) documented higher PTB rates among intervals less than nine months for blacks.45,66 Differing results between our findings and those lacking interaction could be because our measure of short IPI (<12 months) is based on physician report versus vital or medical records. Additionally, we include women of higher parity whereas other studies included first and second births only.66 In our sample, NHB women were more likely to have short IPIs among higher-order births (parity >2) than NHW women (55% NHB vs. 48% NHW).
Unfortunately no other risk factors assessed explained the increased risk among NHB women, as has been observed in previous studies.9 The risk screening tool does not assess factors such as racism, discrimination, stress, and unequal access to opportunities or resources from which disparities originate.13,68 Prioritizing all NHB women for care management may be the best starting point toward
could determine which aspects of care management are most influential and provide insight into closing the gap in racial/ethnic disparities in birth outcomes.
Although psychosocial factors (aside from smoking) were not significant among the full sample, we found two factors that were predictive of PTB among subgroups—food insecurity and housing. Food insecurity, defined as being hungry from not being able to eat or being unable to afford food in the past 12 months, was a significant predictor of PTB among parous women only. To our knowledge, this is a new finding, perhaps because our assessment does not account for household size like other measures of food insecurity. We hypothesize that this finding captures the stress associated with having food insecurity in the context of providing for a family compared to food insecurity among nulliparous women without other children to feed. A study conducted among black and white women in central NC showed that perceived stress was the predominant psychosocial indicator associated with food insecurity, even when adjusting for demographic and other psychosocial variables.73
There are several limitations to this analysis. We excluded 6.6% of women due to missing data. Excluded women were more likely to be older, parous, non-white, foreign-born, married, less educated, to use substances and smoke, live in unsafe or unstable housing, have a fetal complication, and have a provider who requested a care management assessment. We substituted missing values for BMI and smoking and used parity and race/ethnicity from the birth certificate because the data were more complete. Thus inferences for these risk factors are based on how they are reported on the birth certificate, which may differ from the risk-screening tool. If data collection and quality for these measures are not improved, efforts to identify and target women with these risk factors will be hampered. Additionally we were unable to examine two priority risk factors (missed two or more prenatal care appointments and hospital use during pregnancy) due to small numbers.
reexamination among women screened later in pregnancy. We compared the
prevalence of chronic conditions on the risk screening to those from birth certificates in our sample and the prevalence on the risk screen was higher. For example, the prevalence of chronic diabetes and hypertension was 1.47% and 2.90% from the risk screen and 0.97% and 2.26% from the birth certificate. This suggests that chronic disease reporting on the risk screen may be more complete than the birth certificate.
We chose a 24-week cutoff because we wanted to ensure that measurement of exposures occurred before the outcome and to identify risk factors that were predictive of PTB among women who entered care early enough to benefit from the care management intervention. Thus the final predictive model may not capture risk factors that are predictive of PTB among women screened later in pregnancy. We examined the selectivity of our sample by comparing sample characteristics to those of women screened after 24 weeks of completed gestation. Nearly three-fourths of women were screened prior to 24 weeks and 79% of PTBs occurred to them. Women screened after 24 weeks were more likely to be Hispanic, foreign-born, report an unintended pregnancy, and have a previous live birth. They were less likely to be NHB, to smoke or abuse substances, or to have had a previous adverse reproductive outcome. By excluding women screened at 24 weeks or beyond, we were more likely to miss lower-risk women. If we had not excluded these women, the prevalence of PTB would be 10.93% instead of 11.01%.
care management activities could potentially reduce the association between risk factors and PTB, biasing our predictive model.28 For example, women with a prior spontaneous PTB are at higher risk for a subsequent PTB, but through the PMH program, 2% were documented as receiving progesterone (17p) treatment, which could underestimate the effect of prior PTB.22 In an attempt to reduce potential intervention effects, we conducted our analysis among women screened at program inception in 2011. Our sensitivity analyses showed slight changes in selected
variables for the final model when women receiving care management and 17p treatment were removed, likely due to the smaller sample size.
Finally, obstetric estimate of gestation was used as our outcome measure. Several studies have examined the validity of OE since its addition to the 2003 revision of the birth certificate and concluded that OE may undercount the rate of PTB.76–80 We acknowledge that OE may underestimate PTB and make our estimate of PTB look better than the national prevalence based on LMP calculated by NCHS, however, we chose to use OE because LMP was missing more observations in our sample and LMP has its own limitations.78,79
Despite these limitations, our analysis provides insight into how the evidence-based PMH program can increase the sensitivity and specificity of their tool. The PMH risk screen assesses many factors, several of which have never been
assessed in previous tools, with the ability to intervene in real time to guide decision-making about pregnancy management. Patient-specific predicted probabilities from our final model can be calculated for each woman screened, which is an
The improved specificity can help prevent care managers from becoming
overburdened serving too many women, which could lead to a “watering down” of the intervention. Based on linkage from birth certificates, Medicaid claims, and PMH risk screens, salient risk factors for PTB were identified for vulnerable subgroups that will allow for better targeted prevention approaches that could promote health equity in birth outcomes. At the same time, we recognize that identifying women at highest risk is only the first step. The utility of a risk scoring system depends on the prevention and treatment options available to women identified as high risk.21 More evidence on the ability of and mechanisms through which care management
FIGURES AND TABLES
Figure 2.1. Analysis sample.
- 49% (n=33,852) no risk screening conducted
- 2.9% (n=1,028) duplicate or inactive risk screen
- 34% (n=11,759) 1st risk screen conducted prior to Aug. 31 or after May 20, 2011
- 26% (n=6,022) 1st risk screen conducted before 6 weeks or at or after 24 weeks
-0.04% (n=7) Emergency Medicaid
-0.48% (n=62) gestational age at birth < 24 weeks
-6.62% (n=1,093) missing data 6 and 24 weeks gestation
and May 20, 2012
No missing data n = 15,428
Gestational age at birth > 24 weeks n = 16,521
With Prenatal Medicaid coverage n = 16,583
With CMIS risk screening data n = 35,399
First screening between Aug 31, 2011 n = 22,612
First screening conducted between n = 16,590
One valid risk screen per n = 34,371
woman
matched to birth certificates n = 69,251
Table 2.1.
Sociodemographic and Program Characteristics among Women Screened by the Pregnancy Medical Home Program, Stratified by Preterm Birth (n=15,428)
Term Preterm
Total 37–42 weeks 24–36 weeks
(Col %) N % N %
p-value*
Sociodemographics
Age at Delivery 0.008
<18 (10.36) 1427 89.30 171 10.70
19-34 (84.44) 11616 89.16 1412 10.84
>35 (5.20) 687 85.66 115 14.34
Race/Ethnicity 0.0001
Non-Hispanic White (46.37) 6461 90.31 693 9.69 Non-Hispanic Black (40.26) 5402 86.96 810 13.04 Asian/Pacific Islander (2.48) 344 89.82 39 10.18 American Indian/Alaska
Native (2.83) 389 89.22 47 10.78
Hispanic (8.06) 1134 91.23 109 8.77
U.S. Born 0.011
No (6.44) 909 91.45 85 8.55
Yes (93.56) 12821 88.82 1613 11.18
Married at Conception or
Birth 0.002
No (70.92) 9682 88.48 1260 11.52
Yes (28.99) 4035 90.23 437 9.77
Missing (n=14) (0.09) 13 --- 1 ---
Education Level 0.144
< High School (25.40) 3468 88.49 451 11.51 High School Graduate or
GED (35.51) 4912 89.65 567 10.35
Some College or More (39.03) 5343 88.72 679 11.28
Missing (n=8) (0.05) 7 --- 1 ---
Program Characteristics Medicaid for Pregnant
Women (MPW) 0.0001
No (34.15) 4602 87.36 666 12.64
Received Care Management 0.0001
No (39.42) 5522 90.81 559 9.19
Yes (60.58) 8208 87.81 1139 12.19
Received 17p† 0.0001
No (97.80) 13505 89.50 1584 10.50
Yes (2.20) 225 66.37 114 33.63
Sample Size (n) 100.00 13730 88.99 1698 11.01
Source: Pregnancy Medical Home Case Management Information System, North Carolina Birth Records, and Medicaid Claims Data from September 1, 2011, to September 30, 2012.
Table 2.2.
Psychosocial Characteristics among Women Screened by the Pregnancy Medical Home Program, Stratified by Preterm Birth (n=15,428)
Term Preterm
Total 37–42 weeks
24–36 weeks (Col
%) N % N % p-value*
Pregnancy Intention 0.007
Intended (26.65) 3685 89.64 426 10.36
Unintended (54.81) 7545 89.23 911 10.77
Don't know (18.54) 2500 87.38 361 12.62
Physical Violence (past
year) 0.392
No (95.97) 13183 89.04 1623 10.96
Yes (4.03) 547 87.94 75 12.06
Intimate Partner Violence 0.296
No (99.62) 13680 89.01 1689 10.99
Yes (0.38) 50 84.75 9 15.25
Forced Sex (ever) 0.703
No (98.23) 13489 89.01 1666 10.99
Yes (1.77) 241 88.28 32 11.72
Food Insecurity (past year) 0.189
No (94.72) 13017 89.07 1597 10.93
Yes (5.28) 713 87.59 101 12.41
Unsafe or Unstable Housing
No (93.80) 12900 89.14 1571 10.86 0.021
Yes (6.20) 830 86.73 127 13.27
Smoking Status 0.0001
Never or Fewer than 100
Cigs (50.17) 6935 89.60 805 10.40
Stopped before Pregnancy (10.27) 1440 90.85 145 9.15 Stopped after Pregnancy (17.17) 2365 89.28 284 10.72 Cut down since
Pregnancy/Smoke Same
Amount (22.39) 2990 86.57 464 13.43
Parent/Friend/Partner
Substance Problem 0.839
No (77.70) 10671 89.02 1316 10.98
Past Substance Problem 0.051
No (95.72) 13158 89.10 1610 10.90
Yes (4.28) 572 86.67 88 13.33
Alcohol/Drug Use before
Pregnancy 0.344
No (45.31) 6239 89.26 751 10.74
Yes (54.69) 7491 88.78 947 11.22
Alcohol/Drug Use Past
Month 0.006
No (88.85) 12233 89.24 1475 10.76
Yes (11.15) 1497 87.03 223 12.97
Sample Size (n) 100.00 13730 88.99 1698 11.01
Source: Pregnancy Medical Home Case Management Information System, North Carolina Birth Records, and Medicaid Claims Data from September 1, 2011, to September 30, 2012.
Table 2.3.
Current Pregnancy Characteristics among Women Screened by the Pregnancy Medical Home Program, Stratified by Preterm Birth (n=15,428)
Term Preterm
Total 37–42 weeks
24–36 weeks (Col
%) N % N %
p-value*
Body Mass Index 0.004
Underweight (4.54) 600 85.59 101 14.41
Normal weight (37.92) 5254 89.81 596 10.19
Overweight (24.12) 3310 88.93 412 11.07
Obese (33.41) 4566 88.57 589 11.43
Multifetal Gestation 0.0001
No (99.03) 13661 89.41 1618 10.59
Yes (0.97) 69 46.31 80 53.69
Fetal Complication 0.015
No (99.63) 13685 89.03 1686 10.97
Yes (0.37) 45 78.95 12 21.05
Chronic Conditions
Diabetes 0.0001
No (98.53) 13572 89.28 1629 10.72
Yes (1.47) 158 69.60 69 30.40
Hypertension 0.0001
No (97.10) 13397 89.43 1583 10.57
Yes (2.90) 333 74.33 115 25.67
Asthma 0.0001
No (95.18) 13103 89.23 1582 10.77
Yes (4.82) 627 84.39 116 15.61
Mental Illness 0.811
No (94.53) 12981 89.01 1603 10.99
Yes (5.47) 749 88.74 95 11.26
HIV 0.443
No (99.88) 13715 89.00 1695 11.00
Yes (0.12) 15 83.33 3 16.67
Seizure 0.611
No (99.16) 13617 89.01 1682 10.99
Yes (0.84) 113 87.60 16 12.40
Renal Disease 0.013
No (99.82) 13710 89.02 1691 10.98
Systemic Lupus
Erythematosus 0.568
No (99.87) 13713 89.00 1695 11.00
Yes (0.13) 17 85.00 3 15.00
Other Chronic Condition 0.001
No (95.91) 13193 89.16 1604 10.84
Yes (4.09) 537 85.10 94 14.90
Current or Recent
Drug/Alcohol Use 0.406
No (94.09) 12926 89.05 1590 10.95
Yes (5.91) 804 88.16 108 11.84
Delayed Prenatal Care (>14
weeks) 0.001
No (79.65) 10883 88.57 1405 11.43
Yes (20.35) 2847 90.67 293 9.33
Cervical Insufficiency 0.0001
No (99.47) 13684 89.17 1662 10.83
Yes (0.53) 46 56.10 36 43.90
Gestational Diabetes 0.667
No (99.59) 13675 89.00 1690 11.00
Yes (0.41) 55 87.30 8 12.70
Vaginal Bleeding in Second
Trimester 0.060
No (99.62) 13682 89.02 1687 10.98
Yes (0.38) 48 81.36 11 18.64
Hypertensive Disorders of
Pregnancy 0.0001
No (99.28) 13644 89.08 1673 10.92
Yes (0.72) 86 77.48 25 22.52
Short Interpregnancy Interval (<12
mos) 0.120
No (94.51) 12990 89.09 1591 10.91
Yes (5.49) 740 87.37 107 12.63
Current Sexually Transmitted
Infection 0.158
No (97.82) 13439 89.05 1653 10.95
Yes (2.18) 291 86.61 45 13.39
Recurrent Urinary Tract
Infection 0.379
No (98.86) 13577 89.02 1675 10.98
Yes (1.14) 153 86.93 23 13.07
Provider Requests Pregnancy
Assessment 0.017
No (84.93) 11694 89.25 1409 10.75
Communication Barrier 0.012
No (97.66) 13394 88.90 1673 11.10
Yes (2.34) 336 93.07 25 6.93
Sample Size (n) 100.00 13730 88.99 1698 11.01
Source: Pregnancy Medical Home Case Management Information System, North Carolina Birth Records, and Medicaid Claims Data from September 1, 2011, to September 30, 2012.
Table 2.4.
Obstetric History Characteristics among Women Screened by the Pregnancy Medical Home Program, Stratified by Preterm Birth (n=15,428)
Term Preterm
Total 37–42 weeks
24–36 weeks (Col
%) N % N %
p-value*
Nulliparous 0.029
No (57.24) 7817 88.52 1014 11.48
Yes (42.76) 5913 89.63 684 10.37
Non-spontaneous Preterm Birth 0.0001
No (96.10) 13283 89.59 1543 10.41
Yes (3.90) 447 74.25 155 25.75
Spontaneous PTB or Rupture of
Membranes 0.0001
No (96.45) 13344 89.68 1536 10.32
Yes (3.55) 386 70.44 162 29.56
Low Birth Weight 0.0001
No (98.11) 13514 89.28 1622 10.72
Yes (1.89) 216 73.97 76 26.03
Fetal Death 0.0001
No (98.81) 13601 89.22 1643 10.78
Yes (1.19) 129 70.11 55 29.89
Neonatal Death 0.0001
No (99.53) 13680 89.09 1675 10.91
Yes (0.47) 50 68.49 23 31.51
Second Trimester Pregnancy
Loss 0.0001
No (98.94) 13611 89.17 1653 10.83
Yes (1.06) 119 72.56 45 27.44
Three or More First Trimester Losses 0.038
No (98.90) 13588 89.05 1671 10.95
Yes (1.10) 142 84.02 27 15.98
Cervical Insufficiency 0.0001
No (99.69) 13704 89.10 1676 10.90
Yes (0.31) 26 54.17 22 45.83
Gestational Diabetes 0.093
No (98.42) 13521 89.05 1663 10.95
Postpartum Depression 0.644
No (98.59) 13539 89.01 1672 10.99
Yes (1.41) 191 88.02 26 11.98
Hypertensive Disorders of Pregnancy 0.001
No (96.16) 13227 89.16 1608 10.84
Yes (3.84) 503 84.82 90 15.18
Sample size (n) 100.00 13730 88.99 1698 11.01
Source: Pregnancy Medical Home Case Management Information System, North Carolina Birth Records, and Medicaid Claims Data from September 1, 2011, to September 30, 2012.