IC, 2014 – 10(3): 505-527 – Online ISSN: 1697-9818 – Print ISSN: 2014-3214 http://dx.doi.org/10.3926/ic.428
Service quality in military peacekeeping mission as a determinant of
customer’s perceived value: Empirical evidence
Azman Ismail¹, Norazila Mat1, Ahmad Azan Ridzuan2, Rosnan Herwina3
¹Universiti Kebangsaan Malaysia,
2National Defence University of Malaysia,
3University Technology of MARA (Malaysia)
[email protected], [email protected], [email protected],
Received May, 2013 Accepted April, 2014
Abstract
Purpose: Previous studies have been employing SERVQUAL by Parasuraman, Zeithaml and Berry (1985, 1988) to measure service quality in various service sectors due to its generic nature. Understanding the relationship between service quality and customer’s perceived value in non-business organizational settings is equally important with business setting as positive perception leads to favorable outcome. Hence, the aim of this study is to examine the relationship between service quality and perceived value.
Design/methodology/approach: The self-administered survey questionnaires were employed to gather data from Malaysian soldiers who involved in peacekeeping mission at a Middle Eastern country. The hypothesized model was analyzed using the SmartPLS 2.0.
Findings: The outcomes of SmartPLS path model confirmed that that all service quality dimensions namely tangible, responsiveness, reliability, assurance, empathy did act as important determinants of customer’s perceived value in the organizational sample.
quality of service delivery in agile organizations.
Originality/value: The work deals with service quality in non-business setting. Although the scale has been widely used, some modifications are generally needed in order to reflect specific characteristics of service sectors under study. The findings confirmed that in general SERVQUAL five dimensions are important determinants to the various service sectors.
Keywords: Workplace service quality, perceived value, Malaysian soldiers
Jel Codes: M12, N45
1. Introduction
service quality and contribute to development of sound base for the researchers.
Quality is a multi-dimensional construct and may be interpreted based on language and organizational views. In terms of language, it is often related to as conformance to requirements (Crosby, 1978), fitness for use (Juran, 1988), one that satisfies the customer (Eiglier & Langeard, 1987), and zero defects in a service delivery system (Crosby, 1978). In an organisational perspective service quality is an indicator for corporate competitiveness (Rachel et al., 2010 Williams & Naumann, 2011). Service quality is normally viewed as a long-run overall evaluation (Zeithaml, 1988; Parasuraman et al., 1988) and an overall appraisal of service at multiple levels in an organisation (Sureshchandar, Rajendran & Anantharaman, 2002). For example, service quality exists when customers’ expectations of service performance match their perceptions of the service received (Bolton & Drew, 1991; Chang & Wang, 2011; Yogesh & Satyanarayana, 2013).
Service quality is a cognitive evaluation of customers’ perceptions and expectations on quality of service deliver that impact organization performance through customer satisfaction (Abdullah et al., 2010; Rachel et al., 2010; Williams & Naumann, 2011; Gallarza et al., 2011). Several conceptual models have been developed for measuring service quality and one of the most prevailing models in the service management literature is service quality gap (Parasuraman et al., 1985). During the period of 1984 until 2010 many services quality models being develop like Technical and functional quality model (Gronroos, 1984); Attribute service quality model (Haywood-Farmer, 1988); Performance only model (Cronin & Taylor, 1992); Ideal value model of service quality (Mattsson, 1992); IT alignment model (Berkley & Gupta, 1994); Attribute and overall affect model (Dabholkar, 1996); Retail service quality and perceived value model (Sweeney, Soutar & Johnson, 1997); Service quality, customer value and customer satisfaction model (Oh, 1999); Internal service quality model (Frost & Kumar, 2000); Model of e-service quality (Santos, 2003) and many more with the primary aim of these models is to enable the management to understand and enhance the quality of the organization and its offering. Jose, Martínez and Martínez (2010) has classified all those model into three main groups which they name as:
• Multidimensional reflective model
• Multidimensional formative models and
• Multidimensional formative–reflective model.
that service quality have five important characteristics: tangible, responsiveness, empathy, assurance and reliability. Firstly, tangible is often described as being where a particular service provider provides good facilities, equipment, personnel and communication materials when delivering services. Secondly, responsiveness is often defined as the willingness of a service provider to provide the service quickly and accurately. Thirdly, empathy is related to caring, attention and understanding the customers’ needs when providing services. Fourthly, assurance refers to credibility, competence and security in delivering services. Finally, reliability is frequently seen as the ability of the service provider to implement a promised service dependably and accurately.
Surprisingly, a thorough review of quality management programmes reveals that the ability of service providers to properly implement service quality in carrying out a job may have a significant impact on customer’s perceived value (Caruana Money & Berthon, 2000; Varki & Colgate, 2001; Chang & Wang, 2011; Sadeh et al., 2011; Ryu et al., 2012; Razavi et al., 2012). Perceived value can be defined based on organizational and customer perspectives. In an organizational perspective, perceived value is defined as trade-off between what customers receive, such as quality, benefits, and utilities, and what they sacrifice, such as price, opportunity cost, time, and efforts (Cronin, Brady & Hult, 2000; Kuo, Wu & Deng, 2009; Tung, 2004). While, according to a customer’s perspective, perceived value is a construct that consist of five important dimensions: social, emotional, functional, epistemic, and conditional (Sheth, Newman & Gross, 1991; Wang, Lo & Yang, 2004). The combination of these values has motivated a customer to recognize and appreciate the utility of a product given by a ‘service provider’, which may fulfil his/her expectations (Foster, 2004; Heininen, 2004; Walker et al., 2006).
Within a quality management model, many scholars concur that service quality dimensions, namely tangible, reliability, responsiveness, assurance, empathy and customer’s perceived value are different, but highly interrelated constructs. For example, the ability of the service provider to appropriately implement tangible, reliability, responsiveness, assurance and empathy in delivering services may lead to higher customer’s perceived value about the quality programs (Sureshchandar et al., 2002; Rachel et al., 2010; Williams & Naumann, 2011). Even though the nature of this relationship is important, not much is known about the role of service quality as a determinant of the customer’s perceived value in the workplace service quality models (Ladhari & Morales, 2007; Wang et al., 2004; Chang & Wang, 2011; Ryu et al., 2012; Razavi et al., 2012; B. Adams et al., 2012; Hafeez & Muhammad, 2012; Hameed, 2013).
service quality features. Moreover, little concentration was given on the use of a simple correlation method to assess the customer’s reactions on the implementation of service quality programs in the workplace. Consequently, outcomes from these studies have offered inadequate useful evidence to be used as guidelines by practitioners in formulating relevant and appropriate strategies for enhancing the success of service quality in agile organizations (Eggert & Ulaga, 2002; Kuo et al., 2009; Ismail et al., 2009; Delgado, Ferreira & Branco, 2010; Khan, Kashif-Ur-Rehman, Ijaz-Ur-Rehman, Safwan & Ahmad, 2011). Thus, it has motivated the researchers to further explore the gap of the literature by quantifying the relationship between service quality dimensions namely tangible, responsiveness, reliability, assurance, empathy and customer’s perceived value.
2. Literature Review
This section provides theoretical and empirical evidence supporting the conceptual framework and hypotheses for this study.
2.1. Relationship between Service Quality and Customer’s Perceived Value
Several extant studies about service quality were conducted using different samples such as 80 personnel interviews with customers of the telecommunication industry in China (Wang et al., 2004), 1500 hotel customers from selected hotels in Mauritius (Hu, Kandampully & Juwaheer, 2009), questionnaires survey from 125 luxury hotel customers of Pakistan (Raza, Siddiquei, Awan & Bukhari, 2012), 763 public transit passengers in Taiwan (Lai & Chen, 2011) and 537 health care consumers in Niger health care market (Saibou & Kefan, 2010). Findings from these studies reported that the ability of service providers to appropriately implement tangible, responsiveness, reliability, assurance and empathy in delivering services had been essential factor that could enhance customer’s perceived value in the respective organizations (Hu et al., 2009; Lai & Chen, 2011; Raza et al., 2012; Saibou & Kefan, 2010; Wang et al., 2004).
example, application of these theories in the workplace service quality framework shows that the ability of service providers to appropriately implement tangible, responsiveness, reliability, assurance and empathy in doing job may lead to higher customer’s perceived value in organizations (Hu et al., 2009; Saibou & Kefan, 2010; Wang et al., 2004).
2.2. Conceptual Framework and Research Hypothesis
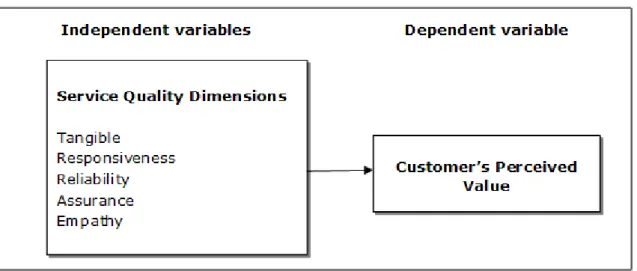
The literature has been used as foundation to develop a conceptual framework for this study as illustrated in Figure 1.
Figure 1. Relationship between service quality and customer’s perceived value
Based on the framework, it can be hypothesized that:
• H1: There is a positive relationship between tangible and customer’s perceived value.
• H2: There is a positive relationship between responsiveness and customer’s perceived value.
• H3: There is a positive relationship between reliability and customer’s perceived value.
• H4: There is a positive relationship between assurance and customer’s perceived value.
3. Methodology
3.1. Research Design
This study used a cross-sectional research design which allowed the researchers to integrate the service quality literature, the pilot study and the actual survey as a main procedure to gather data for this study. Using this procedure increases the ability to gather accurate data, less bias data and high quality data (Creswell, 2012; Sekaran & Bougie, 2010). This study was conducted at a conflicting Middle Eastern country. The United Nation Headquarters’ (Peacekeeping Operations) gave a permission to MALBATT Headquarters to send armed forces contingent in order to maintain and enforce peace in the country. Under this peacekeeping mission, MALBATT Headquarters are given important tasks and responsibilities to support the operation of armed forces troops that are deployed in the country. For confidential reasons, the name of the country is kept anonymous.
At the initial stage of data collection, a survey questionnaire was drafted based on the workplace service quality literature. After that, the pilot study was conducted by discussing the survey questionnaires with five experienced officers, namely a MALBATT commander, a commanding officer, an officer commanding, an administrative officer and a logistic staff officer who have good knowledge and experiences about the peacekeeping mission at a Middle Eastern country. The information gathered from the officers was used to improve the content and format of survey questionnaires for an actual research. Hence, a back translation technique was used to translate the content of questionnaires in Malay and English languages in order to increase the validity and reliability of the instrument (Creswell, 2012; Sekaran & Bougie, 2010).
3.2. Measures
3.3. Sample
This study obtained an official approval from the United Nation Headquarters’ (Peacekeeping Operations) and Malaysian Ministry of Defence. These organizations allowed the researchers to conduct the survey, but the list of soldiers was not provided to the researchers. This situation did not allow the researchers to randomly select respondents. As a result, a convenient sampling technique was employed to distribute the survey questionnaires to 540 soldiers who involved in the peacekeeping mission at a Middle Eastern country. From the number, 341 usable questionnaires were returned to the researchers, yielding 63 percent response rate. The survey questionnaires were answered by participants based on their consents and on a voluntarily basis. The number of this sample exceeds the minimum sample of 30 participants as required by probability sampling technique, showing that it may be analyzed using inferential statistics (Creswell, 2012; Sekaran & Bougie, 2010).
3.4. Data Analysis
The SmartPLS 2.0 was employed to assess the validity and reliability of the instruments and thus test the research hypotheses (Henseler, Ringle & Sinkovics, 2009; Ringle, Wende & Will, 2005). The main advantage of using this method may deliver latent variable scores, avoid small sample size problems, estimate every complex models with many latent and manifest variables, hassle stringent assumptions about the distribution of variables and error terms, and handle both reflective and formative measurement models (Henseler et al., 2009; Ringle et al., 2005).
4. Results
4.1. Sample Profile
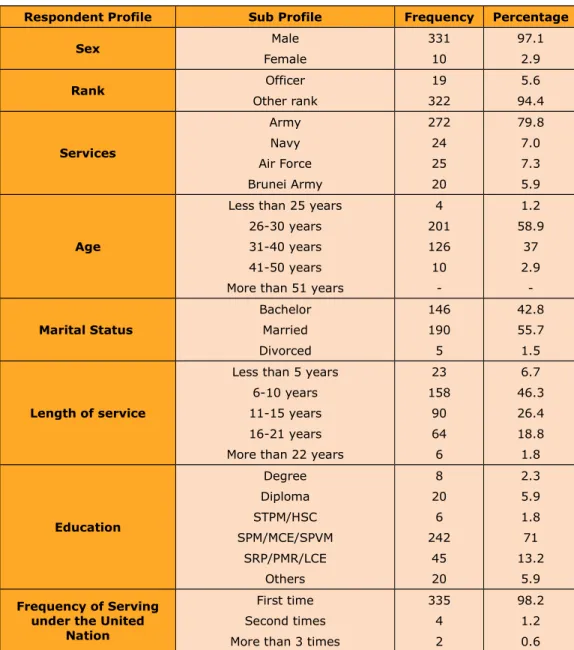
Table 1 shows that the majority respondent characteristics were males (97.1%), other ranks (94.4%), served in the Army (79.8%), ages between 26 to 30 years old (58.9%), married status (55.7%), served 6-10 years (46.3%), SPM/MCE/SPVM holders (71%), and first time serving under the United Nation (98.2%).
Respondent Profile Sub Profile Frequency Percentage
Sex Male Female 331 10 97.1 2.9 Rank Officer Other rank 19 322 5.6 94.4 Services Army Navy Air Force Brunei Army 272 24 25 20 79.8 7.0 7.3 5.9 Age
Less than 25 years 26-30 years 31-40 years 41-50 years More than 51 years
4 201 126 10 -1.2 58.9 37 2.9 -Marital Status Bachelor Married Divorced 146 190 5 42.8 55.7 1.5
Length of service
Less than 5 years 6-10 years 11-15 years 16-21 years More than 22 years
23 158 90 64 6 6.7 46.3 26.4 18.8 1.8 Education Degree Diploma STPM/HSC SPM/MCE/SPVM SRP/PMR/LCE Others 8 20 6 242 45 20 2.3 5.9 1.8 71 13.2 5.9
Frequency of Serving under the United
Nation
First time Second times More than 3 times
335 4 2 98.2 1.2 0.6 Note: SPM/MCE: Sijil Pelajaran Malaysia/ Malaysia Certificate of Education; STPM/HSC: Sijil Tinggi Pelajaran Malaysia/ Higher School Certificate; PMR/SRP/LCE: Penilaian Menengah Rendah/Sijil Rendah Pelajaran/Lower School Certificate
4.1.1. Validity and Reliability Analyses for the Instrument
Table 2 shows the results of convergent and discriminant validity analyses. All constructs had the values of average variance extracted (AVE) larger than 0.5 indicating that the met the acceptable standard of convergent validity (Barclay, Higgins & Thompson, 1995; Fornell & Larcker, 1981; Henseler et al., 2009). Besides that, all constructs had the values of AVE square root in diagonal were greater than the squared correlation with other constructs in off diagonal, showing that all constructs met the acceptable standard of discriminant validity (Henseler et al., 2009).
AVE Assurance Empathy PerceivedValue Reliability Responsive-ness Tangible
Assurance 0.650501 0.807
Empathy 0.736249 0.602127 0.858
Perceived Value 0.660627 0.617055 0.712318 0.813
Reliability 0.644568 0.516136 0.473623 0.520507 0.803
Responsiveness 0.647205 0.626690 0.558154 0.519738 0.614420 0.804
Tangible 0.613077 0.271991 0.323377 0.315715 0.356603 0.330304 0.783
Table 2. Fornell-Larcker Criterion Test
Construct/Items Assurance Empathy PerceivedValue Reliability Responsiveness Tangible
Comfortable 0.764513 0.474956 0.479537 0.455775 0.481908 0.212627
Polite 0.802493 0.481127 0.481163 0.412586 0.514211 0.244023
Confident 0.841491 0.460299 0.506539 0.379273 0.495002 0.190916
No complaint 0.803174 0.491941 0.482369 0.374472 0.484431 0.193215
Believe 0.819044 0.518338 0.534983 0.457601 0.548302 0.254114
Cooperation 0.505102 0.857821 0.619182 0.419062 0.467264 0.251573
Need 0.505587 0.840688 0.577771 0.379198 0.447576 0.255094
Understanding 0.554511 0.886899 0.618524 0.397386 0.513451 0.305872
Delivery 0.501057 0.846046 0.627076 0.427930 0.485391 0.295729
Benefit 0.450400 0.582287 0.762044 0.441015 0.454392 0.243386
Good value 0.476029 0.589266 0.838889 0.422423 0.350778 0.229717
Fairness 0.517565 0.637484 0.834918 0.415775 0.416192 0.286380
Adequate information 0.564499 0.567758 0.854149 0.439616 0.409266 0.264244
Convenient 0.496591 0.510525 0.769434 0.395944 0.489724 0.257677
Solving 0.412580 0.400697 0.430287 0.861663 0.497240 0.314460
Good service 0.436689 0.420058 0.402821 0.827031 0.512645 0.365579
Schedule 0.385869 0.309549 0.418923 0.780820 0.403540 0.257874
Performance 0.421012 0.389598 0.416263 0.736308 0.558013 0.207464
Feedback 0.473098 0.401541 0.369583 0.492097 0.813446 0.247862
Priority 0.501108 0.489691 0.420572 0.427085 0.793724 0.377189
Take care 0.492266 0.381712 0.390547 0.554785 0.834611 0.201767
Urgent action 0.536456 0.501534 0.472898 0.501383 0.774952 0.230990
Adequate equipment 0.235473 0.319366 0.303427 0.263631 0.226890 0.835446
Suitable equipment 0.174049 0.266358 0.212050 0.210291 0.234880 0.824060
Suitable location 0.220112 0.179727 0.228672 0.336733 0.288797 0.747011
Communication
network 0.214399 0.229202 0.226212 0.309690 0.295822 0.719191
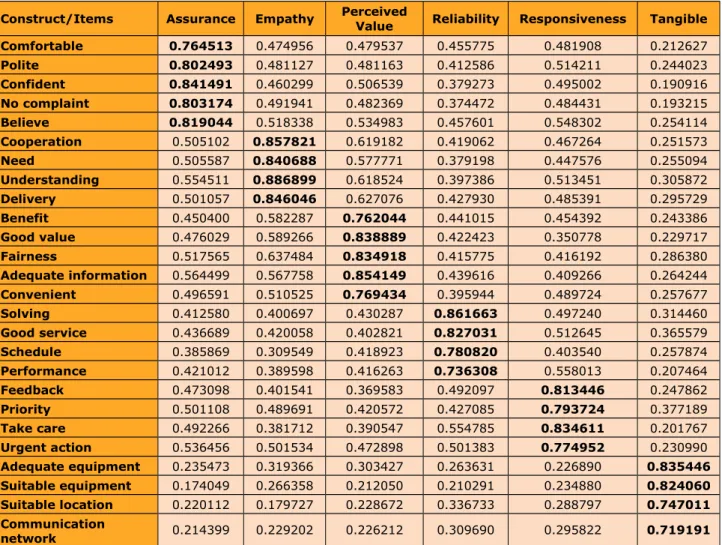
Table 3 shows the factor loadings and cross loadings for different constructs. The correlation between items and factors had higher loadings than other items in the different constructs. The loadings of variables more strongly on their own constructs in the model, greater than 0.7 are considered adequate (Chin, 1998; Fornell & Larcker, 1981; Gefen & Straub, 2005; Henseler et al., 2009). In sum, the measurement model has met the validity criteria.
Table 4 shows the results of reliability analysis for the instrument. The composite reliability and Cronbach’s Alpha had values of greater than 0.8, indicating that the measurement scale used in this study had high internal consistency (Henseler et al., 2009; Nunally & Benstein, 1994; Sekaran & Bougie, 2010).
Construct Composite Reliability Cronbachs Alpha
Assurance 0.902885 0.865405
Customer Satisfaction 0.917770 0.880454
Empathy 0.906642 0.870866
Reliability 0.878475 0.814426
Responsiveness 0.879987 0.818821
Tangible 0.863251 0.789347
Table 4. Composite Reliability and Cronbach’s Alpha
4.1.2. Analysis of the Constructs
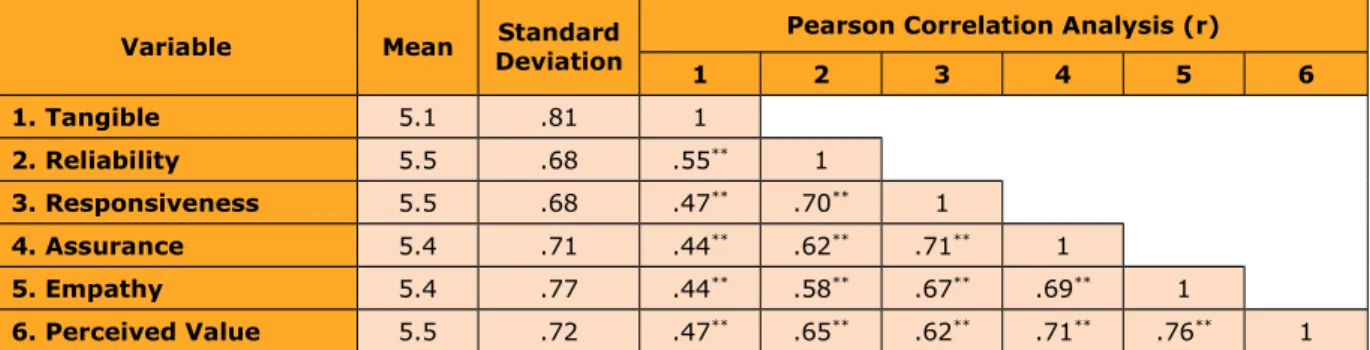
Table 5 shows the results of Pearson correlation analysis and descriptive statistics. The means for the variables range from 5.1 to 5.5 signifying the levels of tangible, reliability, responsiveness, assurance, empathy and perceived value ranging from high (4) to highest level (7). The correlation coefficients for the relationship between the independent variables (i.e., tangible, reliability, responsiveness, assurance, and empathy) and the dependent variable (i.e., perceived value) were less than 0.90, indicating the data were not affected by serious collinearity problem (Hair, Black, Babin, Anderson & Tatham, 2006).
Variable Mean DeviationStandard Pearson Correlation Analysis (r)
1 2 3 4 5 6
1. Tangible 5.1 .81 1
2. Reliability 5.5 .68 .55** 1
3. Responsiveness 5.5 .68 .47** .70** 1
4. Assurance 5.4 .71 .44** .62** .71** 1
5. Empathy 5.4 .77 .44** .58** .67** .69** 1
6. Perceived Value 5.5 .72 .47** .65** .62** .71** .76** 1
Note: Significant at **p<0.01. Reliability Estimation is Shown in a Diagonal
4.1.3. Outcomes of Testing Hypotheses 1, 2, 3, 4 and 5
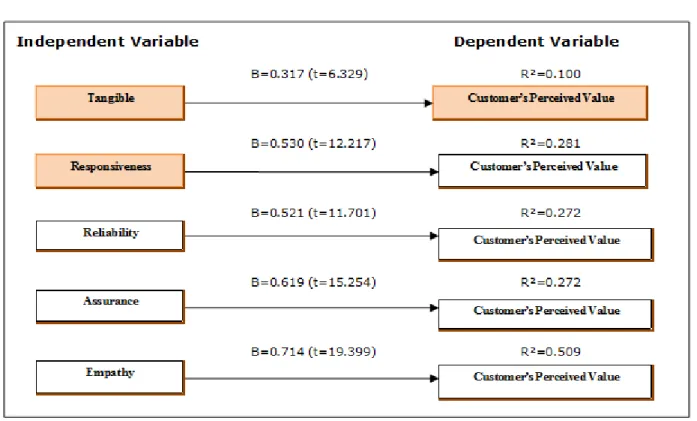
Table 6 shows that the quality of model predictions in the analysis was demonstrated by the score of R square. The inclusion of the service quality features in the analysis showed that tangible had explained 10 percent in the variance of customer’s perceived value, responsiveness had explained 28 percent in the variance of customer’s perceived value, reliability had explained 27 percent in the variance of customer’s perceived value, assurance had explained 38 percent in the variance of customer’s perceived value, and empathy had explained 51 percent in the variance of customer’s perceived value.
Specifically, the outcomes of testing hypothesis using SmartPLS displayed five important findings: first, tangible significantly correlated with customer’s perceived value (β=317; t=6.329), therefore H1 was supported. Second, responsiveness significantly correlated with customer’s perceived value (β=0.530; t=12.217), therefore H2 was supported. Third, reliability significantly correlated with customer’s perceived value (β=0.521; t=11.701), therefore H3 was supported. Fourth, assurance significantly correlated with customer’s perceived value (β=0.619; t=15.254), therefore H4 was supported. Fifth, empathy significantly correlated with customer’s perceived value (β=0.714; t=19.399), therefore H5 was supported. In sum, this result demonstrates that tangible, responsiveness, reliability, assurance, and empathy act as important determinants of customers’ perceived value in the studied organizations.
Table 6. The Results of SmartPLS Path Model Showing the Relationship between Service Quality and Customer’s Perceived Value
5. Discussion and Implications
The findings of this study show that service quality has been an important determinant of customer’s perceived value in the organizational sample. In the context of this study, the service provider (i.e., MALBATT Headquarters) has taken a proactive action to plan, lead and monitor its service based on the broad policies and regulations set up by the United Nation (Peacekeeping Operation). The majority soldiers perceived that all service quality features, namely tangible, responsiveness, reliability, assurance and empathy have been well planned and implemented in delivering services to the soldiers who participating in operation, administration and logistics divisions. As a result of this implementation, it may lead to an enhanced customer’s perceived value about the quality programs in the peacekeeping mission.
al. (2004), Hu et al. (2009), Saibou & Kefan (2010) Chang and Wang (2011), Ryu et al., (2012) and Razavi et al. (2012). A careful observation about the findings shows that the relationship between service quality features and customers’ perceived value is significant, but the role of service quality features as an important predicting variable is low in the hypothesized model. This result may be indirectly affected by perceptions of different respondent characteristics. First, they may have different evaluations and acceptance about the importance of each service quality feature in helping them to achieve the goals of peacekeeping mission. Second, they may have dissimilar talents and capabilities to comply service quality guidelines and methods in accomplishing their peacekeeping duties and responsibilities. This situation may overrule the effectiveness of service quality in the peacekeeping mission.
Regarding the robustness of research methodology, the survey questionnaires used in this study have exceeded the minimum standard of validity and reliability analyses. This resulted to the production of accurate and reliable findings. With respect to practical contribution, the findings of this study can be used as guidelines by management to improve the service quality of peacekeeping missions in other conflicting countries. The possible suggestions are: firstly, quality service training programs for peacekeeping management staff need to be provided to increase their competencies in fulfilling front line soldier needs in the operation areas. Secondly, stress training programs to soldiers need to be provided in order to increase their skills in handling physiological and psychological stresses in the conflicting situations. Thirdly, foreign language training programs need to be provided to soldiers in order to enable them to communicate with foreign people who live in the conflicting countries. Fourthly, pay levels for peacekeeping management staff need to be increased in order to recognize their commitment in ensuring service quality for front line soldiers. Fifthly, recruitment and selection policies need to pay high attention on hiring soldiers who have good information technology skills in order to enable them handling and repairing sophisticated communication devices in the operation areas. If these suggestions are heavily considered this may attract, retain and motivate good soldiers to participate in peacekeeping mission operations.
6. Conclusion
customer’s perceived value in the organizational sample. This result has also supported and broadened the workplace service quality research literature mostly published in most Western countries. Therefore, current research and practice within the workplace service quality models needs to consider tangible, responsiveness, reliability, assurance and empathy as critical dimensions of the total quality organization domain. The findings of this study further suggest that the ability of service providers to appropriately implement the tangible, responsiveness, reliability, assurance and empathy in delivering services will strongly invoke positive subsequent attitudinal and behavioural outcomes (e.g., satisfaction, retention, loyalty, positive moral values, cooperation and service performance). Hence, these positive outcomes may lead to sustained and supported the organizational strategy and goals in an era of global conflicts and violence.
The conclusions drawn from the results of this study should consider the following limitations. Firstly, this study was a cross-sectional research design where the data was taken at one point of time within the duration of this study. In this sense, this research design did not capture the developmental issues (e.g., intra-individual change and restrictions of making inference to participants) and/or causal connections between variables of interest (Sekaran & Bougie, 2010). Secondly, this study only examined the relationship between latent/unobserved variables (i.e., tangible, responsiveness, reliability, assurance, empathy and customer’s perceived value) and the conclusion drawn from this study does not specify the relationship between specific indicators for the independent variable and dependent variable. Thirdly, the outcomes of SmartPLS path model have focused on the level of performance variation explained by the regression equations and it is also helpful to indicate the amount of dependent variable variation that is not explained (Henseler et al., 2009; Riggle, Edmondson & Hansen, 2009). Although a substantial amount of variance in dependent measure that is explained by the significant predictors is identified, there are still a number of unexplained factors that can be incorporated to identify the causal relationships among variables and their relative explanatory power. Therefore, one should be cautious about generalizing the statistical results of this study. Finally, the sample of this study uses only the Malaysian armed forces contingent and they are selected by using a convenient sampling technique. The nature of this sample may decrease the ability of generalizing the results of this research to other organizational contexts.
personal (e.g., gender, age, education and position) variables as potential factors that can influence the effect of service quality on customer’s perceived value needs to be further examined. Using these variables may provide meaningful perspectives for the understanding of how individual similarities and differences affect service quality programs within an organization. Thirdly, the cross-sectional research design has a number of shortcomings; therefore other research designs such as longitudinal studies could be employed as a procedure for collecting data and describing the patterns of change and the direction and magnitude of causal relationships between variables of interest. Fourthly, the findings of this study rely very much on the sample taken from a single organizational sector. To fully understand the effects of service quality on customer attitudes and behavior, more organizational sectors (e.g., armed forces contingents from other countries like the United States, France, Britain and Australia) need to be used in future research. Finally, other personal outcomes of customer’s perceived value such as retention, loyalty and behavioral intention should be considered in future research because they are given more attention in considerable service quality literature (Ismail et al., 2009; Raza et al., 2012; Saibou & Kefan, 2010). The importance of these issues needs to be further elaborated in future research.
Acknowledgment
The authors would like to thank the Ministry of Higher Education, Malaysia for sponsoring this research project.
References
ABDULLAH, F.; SUHAIMI, R.; SABAH, G.; HAMALI, J. (2010). Bank Service Quality (BSQ) I n d e x . International Journal of Quality & Reliability Management, 28(5): 542-555.
http://dx.doi.org/10.1108/02656711111132571
ADAMS, J.S. (1963). Towards an understanding of inequality. Journal of Abnormal and Normal Psychology, 67: 422-436. http://dx.doi.org/10.1037/h0040968
BARCLAY, D.; HIGGINS, C.; THOMPSON, R. (1995). The Partial Least Squares (PLS) approach to causal modeling: Personal computer adoption and use as an illustration. Technology Study, 2(2): 285-309.
BOKSBERGER, P.E.; MELSEN, L. (2011). Perceived value: A critical examination of definitions, concepts and measures for the service industry. Journal of Services Marketing, 25(3): 229-240. http://dx.doi.org/10.1108/08876041111129209
BOLTON, R.N.; DREW, J.H. (1991). A longitudinal analysis of the impact of service changes on customer attitudes. Journal of Marketing, 55(1): 1-9. http://dx.doi.org/10.2307/1252199
CARUANA, A.; MONEY, A.H.; BERTHON, P.R. (2000). Service quality and satisfaction – the moderating role of value. European Journal of Marketing, 34(11/12): 1338-1352.
http://dx.doi.org/10.1108/03090560010764432
CHANG, H.H.; WANG, H.W. (2011). The Moderating Effect Of Customer Perceived Value On Online Shopping Behaviour. Online Information Review, 35(3): 333-359.
http://dx.doi.org/10.1108/14684521111151414
CHEN, H.; LIU, J.Y.; SHEU, T.S.; YANG, M. (2012). The Impact Of Financial Services Quality And Fairness On Customer Satisfaction. Managing Service Quality, 22(4): 399-421.
http://dx.doi.org/10.1108/09604521211253496
CHIN, W.W. (1998). The Partial Least Squares approach to Structural Equation Modeling. In R.H. Hoyle (Eds.). Statistical strategies for small sample research (pp.307-341). Thousand Oaks–California: Sage Publication, Inc.
CLOTTEY, T.A.; COLLIER, D.A. (2008). Drivers of Customer Loyalty in a Retail Store Environment. Journal of Service Science, 3rd Quarter. In CRONIN, J.J., BRADY, M.K., & HULT, G.T.M. (2000). Assessing the effects of quality, value, and customer satisfaction on behavior intentions in service environments. Journal of Retailing, 76(2): 193–218.
CRESWELL, J.W. (2012). Educational Research: Planning, Conduct, and Evaluating Quantitative and Qualitative Research (Fourth Edition). Boston: Pearson.
CRONIN JR, J.J.; BRADY, M.K.; HULT, G.T.M. (2000). Assessing the effects of quality, value, and customer satisfaction on consumer behavioral intentions in service environments. Journal of Retailing, 76(2): 193-218. http://dx.doi.org/10.1016/S0022-4359(00)00028-2
CRONIN, J.J.; TAYLOR, S.A. (1992). Measuring Service Quality: A Reexamination and Extension. Journal of Marketing, 6: 55-68. http://dx.doi.org/10.2307/1252296
CROSBY, P.B. (1978). Quality is free – The Art of Making Quality Certain. New York: McGraw-Hill.
DELGADO, C.; FERREIRA, M.; BRANCO, M.C. (2010). The Implementation of Lean Six Sigma in Financial Services Organizations. Journal of Manufacturing Technology Management, 21(4): 512-523. http://dx.doi.org/10.1108/17410381011046616
EGGERT, A.; ULAGA, W. (2002). Customer perceived value: A substitute for satisfaction in business markets?. Journal of Business and Industrial Marketing, 17(2/3): 107-118.
http://dx.doi.org/10.1108/08858620210419754
EIGLIER, P.; LANGEARD, E. (1987). Servication: Le marketing des services. Paris: McGraw-Hill.
FORNELL, C.; LARCKER, D.F. (1981). Evaluating structural equation models with unobservable variables and measurement error. Journal of Marketing Research, XVIII(February): 39-50.
http://dx.doi.org/10.2307/3151312
FOSTER, S.T. (2004). Managing Quality: An Integrative Approach. New Jersey: Prentice Hall.
FROST, F.A.; KUMAR, M. (2000). INTSERVQUAL: an internal adaptation of the GAP model in a large service organization. Journal of Services Marketing, 14(5): 358-377.
http://dx.doi.org/10.1108/08876040010340991
GAZZOLI, G.; HANCER, M.; PARK, Y. (2010). The Role And Effect Of Job Satisfaction And Empowerment On Customers' Perception Of Service Quality: A Study In The Restaurant Industry. Journal of Hospitality & Tourism Research, 34 (1): 56-77.
http://dx.doi.org/10.1177/1096348009344235
GEFEN, D.; STRAUB, D. (2005). A practical guide to factorial validity using PLS-Graph: Tutorial and annotated example. Communication of the Association for Information Systems, 16(1), 91-109.
GRONROOS, C. (1984). A Service Quality Model and Its Marketing Implications. European Journal of Marketing, 18(4): 36-44. http://dx.doi.org/10.1108/EUM0000000004784
HAFEEZ, S.; MUHAMMAD, B. (2012). The Impact Of Service Quality, Customer Satisfaction And Loyalty Programs On Customer’s Loyalty: Evidence From Banking Sector Of Pakistan. International Journal of Business and Social Science, 3(16): 200-209.
HAIR, J.F.; BLACK, W.C.; BABIN, B.J.; ANDERSON, R.E.; TATHAM, R.L. (2006). Multivariate Data Analysis. Upper Saddle River: Pearson Prentice Hall.
HAMEED, F. (2013). The Effect of Advertising Spending on Brand Loyalty Mediated by Store Image, Perceived Quality and Customer Satisfaction: A Case of Hypermarkets. Asian Journal of Business Management, 5(1): 181-192.
HEININEN, K. (2004). Reconceptualizing customer perceived value: the value of time and place. Managing Service Quality, 14(2/3): 205-215.
http://dx.doi.org/10.1108/09604520410528626
HENSELER, J.; RINGLE, C.M.; SINKOVICS, R.R. (2009). The Use of Partial Least Squares Path Modeling in International Marketing. In: R.R. SINKOVICS & P.N. GHAURI (Eds.), Advances in International Marketing (pp. 277-320). Bingley: Emerald.
HU, H.H.; KANDAMPULLY, J.; JUWAHEER, T.D. (2009). Relationships and impacts of service quality, perceived value, customer satisfaction, and image: An empirical study. The Service Industries Journal, 29(2): 111-125. http://dx.doi.org/10.1080/02642060802292932
ISMAIL, A.; ABDULLAH, M.M.; FRANCIS, S.K. (2009). Exploring the relationships among service quality features, perceived value and customer satisfaction. Journal of Industrial Engineering and Management, 2(1): 230-250. http://dx.doi.org/10.3926/jiem.2009.v2n1.p230-250
JOSE, A.; MARTINEZ, J.A.; MARTINEZ, L. (2010). Some Insights On Conceptualizing And Measuring Service Quality. Journal of Retailing and Consumer Services, 17(1): 29–42.
http://dx.doi.org/10.1016/j.jretconser.2009.09.002
JURAN, J.M. (1988). Juran’s Quality Control Handbook. Fremont, USA: McGraw-Hill.
JUWAHEER, T.D.; ROSS, D.L. (2003). A study of guest perceptions in Mauritius. International Journal of Hospitality Management, 15(2): 105-115.
KHAN, M.A. (2010). An Empirical Assessment of Service Quality of Cellular Mobile Telephone Operators in Pakistan. Asian Social science, 6(10): 164-177.
KHAN, M.A.; KASHIF-UR-REHMAN; IJAZ-UR-REHMAN; SAFWAN, N.; AHMAD, A. (2011). Modeling Link Between Internal Service Quality In Human Resources Management And Employees Retention: A Case Of Pakistani Privatized And Public Sector Banks. African Journal of Business Management, 5(3): 949-959.
KIM, B.C.; LEE, G.; MURRMANN, S.K.; GEORGE, T.R. (2012). Motivational Effects of Empowerment on Employees' Organizational Commitment: A Mediating Role of Management Trustworthiness. Cornell Hospitality Quarterly, 53(1): 10-19.
http://dx.doi.org/10.1177/1938965511426561
KIMPAKORN, N.; TOCQUER, G. (2010). Service Brand Equity And Employee Brand Commitment. Journal of Services Marketing, 24(5): 378-388.
http://dx.doi.org/10.1108/08876041011060486
LADHARI, R.; MORALES, M. (2007). The role of emotions in dining experience. Proceedings/Actes, 28(23): 80.
LADHARI, R.; PONS, F.; BRESSOLLES, G.; ZINS, M. (2011). Culture And Personal Values: How They Influence Perceived Service Quality. Journal of Business Research, 64(9): 951-957.
http://dx.doi.org/10.1016/j.jbusres.2010.11.017
LAI, W-T.; CHEN, C-F. (2011). Behavioral intentions of public transit passengers- The roles of service quality, perceived value, satisfaction and involvement. Transport Policy, 18(2): 318-325. http://dx.doi.org/10.1016/j.tranpol.2010.09.003
LU, H.; BARRIBALL, K.L.; ZHANG, X.; WHILE, A.E. (2012). Job Satisfaction Among Hospital Nurses Revisited: A Systematic Review. International Journal of Nursing Studies, 49: 1017-1038. http://dx.doi.org/10.1016/j.ijnurstu.2011.11.009
MATTSSON, J. (1992). A Service Quality Model Based On Ideal Value Standard. International Journal of Service Industry Management, 3(3): 18-33.
http://dx.doi.org/10.1108/09564239210015148
NORIZAN, K.; NOR ASIAH, A. (2010). The Effect Of Perceived Service Quality Dimensions On Customer Satisfaction, Trust, And Loyalty In E-Commerce Settings: A Cross Cultural Analysis. Asia Pacific Journal of Marketing and Logistics, 22(3): 351-371.
http://dx.doi.org/10.1108/13555851011062269
NUNALLY, J.C.; BERNSTEIN, I.H. (1994). Psychometric Theory. New York: McGraw-Hill.
OH, H. (1999). Service quality, customer satisfaction and customer value: A holistic perspective. International Journal of Hospitality Management, 18: 67-82.
http://dx.doi.org/10.1016/S0278-4319(98)00047-4
PARASURAMAN, A.; ZEITHAML, V.A.; BERRY, L.L. (1985). A conceptual model of service quality and its implication for future research. Journal of Marketing, 49(Fall): 41-50.
http://dx.doi.org/10.2307/1251430
PARASURAMAN, A.; ZEITHAML, V.A.; BERRY, L.L. (1988). SERVQUAL: A multiple scale for measuring consumer perceptions of service quality. Journal of Retailing, 64(Spring): 12-40.
RACHEL, W.Y.; ANDY, C.L.; YEUNG, T.C.; CHENG, E. (2010). An Empirical Study Of Employee Loyalty, Service Quality And Firm Performance In The Service Industry. International Journal of Production Economics, 124(1): 109–120. http://dx.doi.org/10.1016/j.ijpe.2009.10.015
RAZAVI, S.M.; SAFARI, H.; SHAFIE, H. (2012). Relationships Among Service Quality, Customer Satisfaction And Customer Perceived Value: Evidence From Iran's Software Industry. Journal of Management and Strategy, 3(3): 28-37. http://dx.doi.org/10.5430/jms.v3n3p28
RIGGLE, R.; EDMONDSON, D.; HANSEN, J. (2009). A Meta-analysis of the relationship between perceived organizational support and job outcomes: 20 years of research. Journal of Business Research, 62(10): 1027-1030. http://dx.doi.org/10.1016/j.jbusres.2008.05.003
RINGLE, C.M.; WENDE, S.; WILL, A. (2005). SmartPLS 2.0 (M3) Beta, Hamburg. Available at:
http://www.smartpls.de.
RYU, K.; LEE, H.R.; KIM, W.G. (2012). The Influence Of The Quality Of The Physical Environment, Food, And Service On Restaurant Image, Customer Perceived Value, Customer Satisfaction, And Behavioral Intentions. International Journal of Contemporary Hospitality Management, 24(2): 200-223. http://dx.doi.org/10.1108/09596111211206141
SADEH, E.; MOUSAVI, L.; GARKAZ, M.; SADEH, S. (2011). The Structural Model of E-Service Quality, E-Customer Satsifaction, Trust, Customer Perceived Value and E-Loyalty. Australian Journal of Basic and Applied Sciences, 5(3): 532-538.
SAIBOU, H.; KEFAN, X. (2010). The Relationships Among Quality, Value, Satisfaction and Behavioral Intention in Health Care Provider Choice: A Study Based on the Case of Niger. IEEE, (6): 225-228. 2010, 2nd International Conference on Computer Engineering and Technology.
SANGEETHA, J.S.; MAHALINGAM, S. (2011). Service Quality Models In Banking: A Review. International Journal of Islamic and Middle Eastern Finance and Management, 4(1): 83-103.
http://dx.doi.org/10.1108/17538391111122221
SANTOS, J. (2003). E-service quality: A model of virtual service quality imensions. Managing service Quality, 13(3): 233-246. http://dx.doi.org/10.1108/09604520310476490
SARSTEDT, M.; SCHLODERER, M.P. (2010). Developing a measurement approach for reputation of non-profit organizations. International Journal of Nonprofit and Voluntary Sector Marketing, 15(3): 276–299.
SEKARAN, U.; BOUGIE, R. (2010). Research Methods for Business: A Skill Building Approach. New York: John Wiley & Sons, Inc.
SERRA, D.; SERNEELS, P.; BARR, A. (2011). Intrinsic motivations and the non-profit health sector: Evidence from Ethiopia. Personality and Individual Differences, 51(3): 309–314.
http://dx.doi.org/10.1016/j.paid.2010.04.018
SHETH, J.N.; NEWMAN, B.I.; GROSS, B.I. (1991). Consumption Values and Market Choice. Cincinnati: South Western Publishing Company.
SIDDIQI, K.O. (2011). Interrelations between Service Quality Attributes, Customer Satisfaction And Customer Loyalty in the Retail Banking Sector in Bangladesh. International Journal of Business and Management, 6(3): 12-36. http://dx.doi.org/10.5539/ijbm.v6n3p12
STEVEN, A.B.; DONG, Y.; DRESNER, M. (2012). Linkages Between Customer Service, Customer Satisfaction And Performance In The Airline Industry: Investigation Of Non-Linearities And Moderating Effects Transportation Research Part E. Logistics and Transportation Review, 48(4): 743–754. http://dx.doi.org/10.1016/j.tre.2011.12.006
SULTAN, P.; WONG H.Y. (2010). Service Quality In Higher Education – A Review And Research Agenda. International Journal of Quality and Service Sciences, 2(2): 259-272.
http://dx.doi.org/10.1108/17566691011057393
SURESHCHANDAR, G.S.; RAJENDRAN, C.; ANANTHARAMAN, R.N. (2002). The relationship between service quality and customer satisfaction – a factor specific approach. Journal of Services Marketing, 16(4): 363-379. http://dx.doi.org/10.1108/08876040210433248
SWEENEY, J.C.; SOUTAR, G.N.; JOHNSON, L.W. (1997). Retail service quality and perceived v a l u e . Journal of Consumer Services, 4 ( 1 ) : 3 9 - 4 8 . http://dx.doi.org/10.1016/S0969-6989(96)00017-3
TUNG, L.L. (2004). Service quality and perceived value’s impact on satisfaction, intention and usage of short message service (SMS). Information Systems Frontiers, 6(4): 353-368.
http://dx.doi.org/10.1023/B:ISFI.0000046377.32617.3d
TURKYILMAZ, A.; AKMAN, G.; OZKAN, C.; PASTUSZAK, Z. (2011). Empirical Study of Public Sector Employee Loyalty and Satisfaction. Industrial Management & Data Systems, 111(5): 675-696. http://dx.doi.org/10.1108/02635571111137250
VARKI, S.; COLGATE, M. (2001). The role of price perceptions in an integrated model of behavioural intentions. Journal of Service Research, 3(3): 232-240.
http://dx.doi.org/10.1177/109467050133004
WALKER, R.H.; JOHNSON, L.W.; LEONARD, S. (2006). Re-thinking the conceptualization of customer value and service quality within the service-profit chain. Managing Service Quality, 16(1): 23-36. http://dx.doi.org/10.1108/09604520610639946
WETZELS, M.; ODEKERKEN-SCHRODER, G.; VAN OPPEN, C. (2009). Using PLS path modeling for assessing hierarchical construct models: Guidelines and empirical illustration. MIS Quarterly, 33(1): 177-195.
WILLIAMS, P.; NAUMANN, E. (2011). Customer Satisfaction And Business Performance: A Firm-Level Analysis. Journal of Services Marketing, 25(1): 20-32.
http://dx.doi.org/10.1108/08876041111107032
YOGESH, P.; SATYANARAYANA, T.C. (2013). Dimensions Of Hospital Service Quality: A Critical Review Perspective of patients from global studies. International Journal of Health Care Quality Assurance, 26(4): 308-340. http://dx.doi.org/10.1108/09526861311319555
ZEITHAML, V.A. (1988). Consumer perceptions of price, quality, and value: A means-end model and synthesis of evidence. Journal of Marketing, 52(July): 2-22.
http://dx.doi.org/10.2307/1251446
Intangible Capital, 2014 (www.intangiblecapital.org)
Article's contents are provided on a Attribution-Non Commercial 3.0 Creative commons license. Readers are allowed to copy, distribute and communicate article's contents, provided the author's and Intangible Capital's names are included. It must not be used for