Bridging the Gap: Using
Extrapolation to Reduce the
Experimental Burden in Children
Ian Wadsworth, BSc., MSc.
Submitted for the degree of Doctor of Philosophy at Lancaster University,
Bridging the Gap: Using Extrapolation to
Reduce the Experimental Burden in Children
Ian Wadsworth, BSc., MSc.
Department of Mathematics and Statistics, Lancaster University
Submitted for the degree of Doctor of Philosophy at Lancaster University, February 2018.
Abstract
When developing a new drug product for children, it is important to provide safe and effective medicines whilst minimising the experimental burden where possible. Extrapolating data from clinical trials in adults or other relevant populations has the potential to reduce the number or size of clinical trials required to obtain a licence for a new drug in the paediatric population. The ethical and practical ben-efits extrapolation can provide, such as speeding up access to medicines, reducing drug development costs and avoiding replication of existing information, have to be balanced against potential risks i.e. if extrapolation from adults is incorrectly deemed to be appropriate, children could be exposed to a harmful or ineffective treatment. Extrapolation is therefore a challenging but important aspect for future paediatric medicine development.
per-Extrapolation can be a potentially controversial approach to take in drug develop-ment, so the opinion of experts within a target clinical setting is incredibly valu-able. Chapters 4 and 5 describe the process and outcome of seeking the opinion of clinical experts regarding extrapolation in epilepsy drug development. Based on this expert opinion, an outline for a new drug development paradigm is presented allowing for simultaneous recruitment of adults and paediatric patients aged 2 years and older, from Phase II onwards.
In order for the extrapolation of efficacy data from adult trials to the paediatric population to be plausible and appropriate, strong assumptions regarding similar-ity between these populations are required. One important assumption is whether adults and children can be said to have similar pharmacokinetic-pharmacodynamic (PK-PD) relationships. In Chapter 6, an approach is developed to use data from existing studies of adults and adolescents, along with expert opinion, to quantify prior uncertainty regarding the similarity of PK-PD relationships in adults and younger children. A bias-adjusted meta-analysis of existing adult and adolescent data allows the derivation of prior distributions quantifying our uncertainty about the extrapolation assumption and calculation of the prior probability that the extrapolation assumption holds. This approach could be extended to quantify-ing prior uncertainty in other contexts; here we consider PK-PD relationships in adults and younger children to provide a clear focus.
Acknowledgements
I would like to thank Dr. Lisa Hampson and Prof. Thomas Jaki for the invaluable supervision, advice and encouragement throughout my PhD and for giving me such a fantastic opportunity. I have learned a great deal from both over the last four years, not only with what I have found a very interesting PhD topic, but also generally about research, academia and that I am more capable than I thought!
The work presented in this thesis was funded by two grants: the National Institute for Health Research (NIHR) grant NIHR-RMOFS-2013-03-05; and the Medical Research Council (MRC) grant MR/M013510/1. I am thankful for this funding and all of the hard work Lisa (as PI) and everyone else involved put into those grant applications. Thanks also to Prof. Anne Whitehead who, along with Jack, gave me my first research job and convinced me that I could do a PhD at Lancaster. Lancaster University has given me a great deal over the last decade and I have achieved much more here than I ever thought I could.
Thanks also to Dr. Graeme Sills, whose clinical input and discussions have been a huge help, as has the support from Prof. Tony Marson, Dr. Richard Appleton and all epilepsy experts that have taken time to contribute their knowledge and experience. Visiting Dr. Bj¨orn Bornkamp at the Novartis campus in Basel was a very valuable experience and his support has been a great help. Thanks also to the useful discussions had with Dr. Linh Van, also of Novartis.
Declaration
I declare that this thesis is my own work and has not been submitted elsewhere for the award of any other degree.
List of papers
This thesis includes the following four papers:
• I. Wadsworth, L. V. Hampson, and T. Jaki. Extrapolation of efficacy and other data to support the development of new medicines for children: A systematic review of methods. Statistical Methods in Medical Research, 2016. Published online ahead of print. DOI: 10.1177/0962280216631359.
• I. Wadsworth, T. Jaki, G. J. Sills, R. Appleton, J. H. Cross, A. G. Marson, T. Martland, A. McLellan, P. E. Smith, J. M. Pellock, and L. V. Hamp-son. Clinical drug development in epilepsy revisited: a proposal for a new paradigm streamlined using extrapolation. CNS Drugs, vol. 30, no. 11, pp. 1011–1017, 2016.
• I. Wadsworth, L. V. Hampson, T. Jaki, G. J. Sills, A. G. Marson, R. Apple-ton. A quantitative framework to inform extrapolation decisions in children.
Under review
• I. Wadsworth, L. V. Hampson, B. Bornkamp, T. Jaki. Exposure-response modelling approaches for determining optimal dosing rules in children. Un-der review
Contents
List of Tables xiv
List of Figures xviii
1 Introduction 1
1.1 Decision making in clinical research . . . 1
1.2 Paediatric clinical trials . . . 5
1.3 Extrapolation . . . 8
1.4 Epilepsy . . . 11
1.5 Meta-analysis . . . 12
1.6 Elicitation of expert opinion . . . 17
2 Thesis Summary 24 3 Extrapolation of efficacy and other data to support the devel-opment of new medicines for children: A systematic review of methods 26 3.1 Introduction . . . 26
3.2 Methods . . . 30
3.4.1 Bayesian methods . . . 34
3.4.2 Frequentist methods . . . 46
3.5 Discussion . . . 53
4 Background to ‘Clinical drug development in epilepsy revisited’ paper 57 4.1 Introduction . . . 57
4.2 One-day meeting outline . . . 58
5 Clinical drug development in epilepsy revisited: A proposal for a new paradigm streamlined using extrapolation 60 5.1 Introduction . . . 60
5.2 Considerations . . . 62
5.2.1 Are paediatric patients just small adults? . . . 62
5.2.2 Are all paediatric patients the same? . . . 63
5.2.3 If a drug is safe in adults, is it safe in paediatrics? . . . 64
5.2.4 When is it reasonable to use therapies in paediatrics that are licensed only for adults? . . . 65
5.2.5 Can we extrapolate efficacy data from adjunctive therapy to monotherapy? . . . 66
5.3 An alternative paradigm for developing medicines for focal epilepsies 67 5.3.1 Phase I trials . . . 67
5.3.2 Phase IIa and IIb trials . . . 67
5.3.3 Phase III trials . . . 68
5.4 Conclusions . . . 70
6 A quantitative framework to inform extrapolation decisions in children 73 6.1 Chapter background . . . 73
6.2 Introduction . . . 74
6.3 Using existing data to inform an extrapolation decision . . . 78
6.3.1 Motivation . . . 78
6.3.2 Extrapolation criterion . . . 81
6.3.3 Bayesian bias adjusted meta-analytic model for existing data 82 6.3.4 Effective sample size . . . 85
6.4 Eliciting prior opinion on external biases . . . 87
6.4.1 Overview . . . 87
6.4.2 Rationale for the elicitation scheme . . . 88
6.4.3 Elicitation protocol . . . 91
6.5 Simulation study . . . 97
6.5.1 Epilepsy application extrapolation criterion . . . 97
6.5.2 Simulating historical PK-PD data in adults and adolescents 98 6.5.3 Meta-analysis of simulated historical PK-PD studies . . . 101
6.6 Results . . . 102
6.6.1 Meta-analysis of historical data . . . 102
6.6.2 ESS of the approximate joint posterior for βA and βI . . . . 102
6.6.3 Prior probability that PK-PD curves are similar in adults and younger children . . . 104
6.8 Appendix: OpenBUGS code . . . 113
7 Exposure-response modelling approaches for determining optimal dosing rules in children 114 7.1 Chapter background . . . 114
7.2 Introduction . . . 114
7.3 Motivating example . . . 118
7.4 Exposure-Response models . . . 118
7.5 Estimating the exposure-response relationship . . . 120
7.5.1 Linear model fit with categorical age covariates . . . 120
7.5.2 MOB and PALM trees . . . 121
7.5.3 Bayesian penalised B-splines . . . 122
7.6 Dosing recommendations . . . 125
7.6.1 Optimisation criterion . . . 125
7.6.2 Identifying an optimal number of age groups in our dosing rule . . . 126
7.7 Design of the simulation study . . . 127
7.7.1 Evaluating different approaches to modelling the E-R rela-tionship . . . 129
7.7.2 Measuring the accuracy of dosing rules . . . 131
7.8 Results . . . 132
7.9 Extension to Emax model . . . 137
7.9.1 Bayesian penalised B-splines . . . 139
7.10 Discussion . . . 144
8 Discussion 146 8.1 Summary . . . 146
8.2 Limitations . . . 148
8.3 Further work . . . 149
8.4 Wider application . . . 153
Bibliography 155 Appendices 172 A Supplementary material to accompany Chapter 3. 173 A.1 Systematic review search strategy . . . 174
A.2 Data extraction form used to record relevant information from ar-ticles identified by the systematic review . . . 176
A.3 Search strategy for software implementing methods identified by the systematic review. . . 182
B Online supplementary material to accompany Chapter 6. 183 B.1 Prior elicitation scheme screenshots . . . 184
B.2 Additional plots of the probability of the extrapolation assumption holding . . . 193
B.3 Supplementary tables . . . 196
C Online supplementary material to accompany Chapter 7. 210 C.1 Worked example of methods . . . 211
C.3 Inclusion of additional covariate . . . 218
C.4 Supplementary tables . . . 223
List of Tables
6.1 Population means of the effects of age (γA) and the interaction
be-tween age and exposure (γI) for adults and adolescents in the six
PK-PD simulation models, with the interpretation of each model. The population median PD response refers to exp{mY}−110, where
mY = M(Y) is calculated setting PK-PD model parameters equal
to their population means. . . 99
6.2 Standard deviations for the intercept (σ0) and effects of exposure
(σC), age (σA) and the interaction between age and exposure (σI)
chosen to reflect low, moderate, high and very high levels of between-trial heterogeneity. . . 100
6.3 Prior distributions placed on unknown model parameters defined in Section 6.3.3. . . 102
B.1 Means, empirical standard deviations and mean squared error over the 1000 replications of each scenario’s meta-analysis results for the effects of age and the interaction between age and exposure - Low between-trial heterogeneity 1 of 2 . . . 197
B.3 Means, empirical standard deviations and mean squared error over the 1000 replications of each scenario’s meta-analysis results for the effects of age and the interaction between age and exposure -Moderate between-trial heterogeneity 1 of 2 . . . 199
B.4 Means, empirical standard deviations and mean squared error over the 1000 replications of each scenario’s meta-analysis results for the effects of age and the interaction between age and exposure -Moderate between-trial heterogeneity 2 of 2 . . . 200
B.5 Means, empirical standard deviations and mean squared error over the 1000 replications of each scenario’s meta-analysis results for the effects of age and the interaction between age and exposure - High between-trial heterogeneity 1 of 2 . . . 201
B.6 Means, empirical standard deviations and mean squared error over the 1000 replications of each scenario’s meta-analysis results for the effects of age and the interaction between age and exposure - High between-trial heterogeneity 2 of 2 . . . 202
B.7 Means, empirical standard deviations and mean squared error over the 1000 replications of each scenario’s meta-analysis results for the effects of age and the interaction between age and exposure - Very high between-trial heterogeneity 1 of 2 . . . 203
B.8 Means, empirical standard deviations and mean squared error over the 1000 replications of each scenario’s meta-analysis results for the effects of age and the interaction between age and exposure - Very high between-trial heterogeneity 2 of 2 . . . 204
B.10 Means and empirical standard deviations over the 1000 replications of each scenario’s probability of the extrapolation assumption hold-ing - Moderate between-trial heterogeneity . . . 206
B.11 Means and empirical standard deviations over the 1000 replications of each scenario’s probability of the extrapolation assumption hold-ing - High between-trial heterogeneity . . . 207
B.12 Means and empirical standard deviations over the 1000 replications of each scenario’s probability of the extrapolation assumption hold-ing - Very high between-trial heterogeneity . . . 208
B.13 Means and empirical standard deviations of the average ESS over the 1000 replications - Model 1 . . . 209
C.1 True E-R model parameter values for age groupings in scenarios 1 to 5 . . . 223
C.2 True E-R model parameter values for age groupings in scenarios 6 to 8. . . 224
C.3 Average absolute bias, empirical standard deviation (ESD) and em-pirical mean squared error (EMSE) for the estimated B-spline in-tercept/slope over age curve, integrated over age for each scenario considered. . . 224
C.4 Average absolute bias, empirical standard deviation (ESD) and em-pirical mean squared error (EMSE) for the estimated bootstrapped PALM intercept/slope over age curve, integrated over age for each scenario considered. . . 225
List of Figures
3.1 Paediatric Study Decision Tree: Image reproduced from Food and Drug Administration1. . . 29 3.2 Flow diagram of systematic review results . . . 32
3.3 Plot showing distribution of methods across four main areas . . . . 33
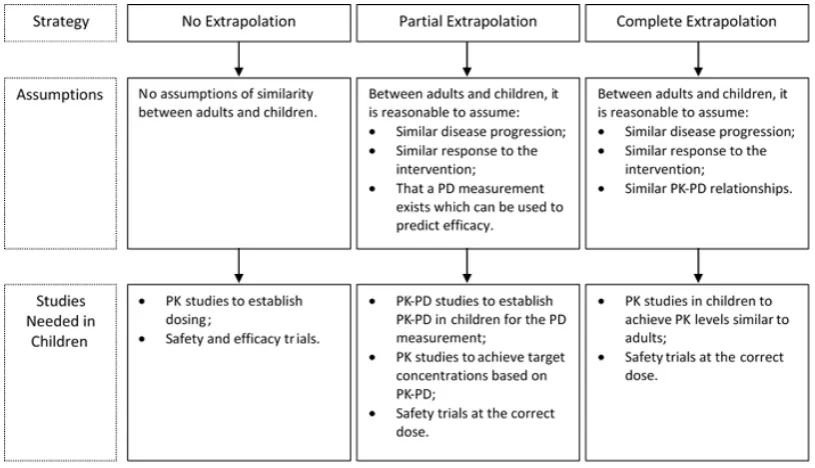
6.1 Extrapolation strategies, assumptions made and required studies, based on the FDA paediatric decision tree.1 . . . . 76
6.2 (a) Simulated adult and adolescent IPD and lines of best fit. (b) Elicited modal values of the dose-response relationship in younger children, captured in expert prior E1, with corresponding 90% cred-ibility interval. Also plotted are adult and adolescent lines of best fit obtained from the simulated IPD. . . 96
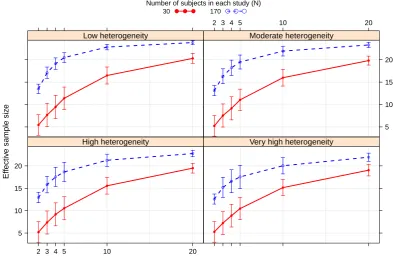
6.3 Average ESS under bias prior E1 when the true PK-PD relation-ships in adults and adolescents follows Model 1, with bars of ± 1 standard deviations of the mean . . . 103
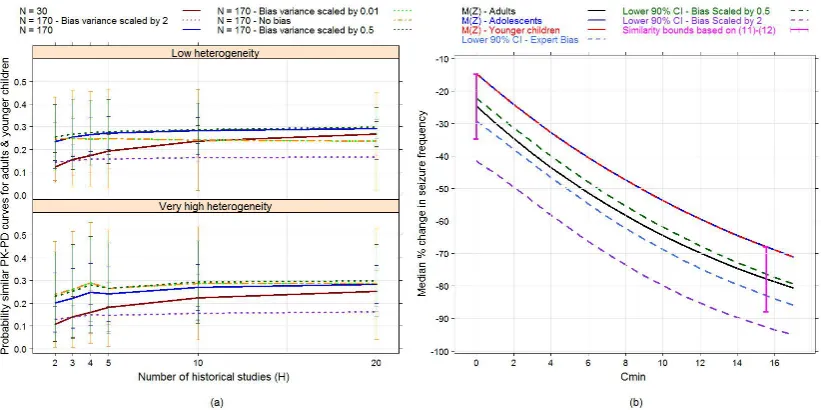
6.5 (a) Average probability of the extrapolation assumption under bias prior E1, with bars of±1 standard deviations of the mean, when the true PK-PD relationships in adults and adolescents follows model S1 (when no differences between PK-PD curves in adults and ado-lescents). (b) Median PK-PD curves for adults, adolescents and younger children following model S1, along with lower bounds of 90% empirical credibility intervals for the median response in younger children resulting from the expert bias prior E1 when its variance matrix is unscaled; or scaled by a factor of 0.5 or 2. Cred-ibility intervals are calculated conditioning on the true values of the adult and adolescent PK-PD parameters. Similarity bounds at placebo and the EC90 given by criteria (6.11) and (6.12) are also
shown. . . 106
6.6 (a) Average prior probability that PK-PD relationships in adults and younger children satisfy criteria (6.11)-(6.12), with bars of± 1 standard deviations from the mean. The true PK-PD relationships in adults and adolescents follow model S3. (b) Median PK-PD curves for adults, adolescents and younger children following model S3, along with lower bounds of 90% empirical credibility intervals for the median response in younger children resulting from the expert bias prior E1 when its variance matrix is unscaled; or scaled by a factor of 0.5 or 2. Credibility intervals are calculated conditioning on the true values of the adult and adolescent PK-PD parameters. Similarity bounds at placebo and the EC90 given by criteria (6.11)
6.7 (a) Average probability of the extrapolation assumption under bias prior E1, with bars of±1 standard deviations of the mean, when the true PK-PD relationships in adults and adolescents follows model S4 (when clearly large differences between PK-PD curves in adults and adolescents). (b) Median PK-PD curves for adults, ado-lescents and younger children following model S4, along with lower bounds of 90% empirical credibility intervals for the median re-sponse in younger children resulting from the expert bias prior E1 when its variance matrix is unscaled; or scaled by a factor of 0.5 or 2. Credibility intervals are calculated conditioning on the true values of the adult and adolescent PK-PD parameters. Similarity bounds at placebo and the EC90 given by criteria (6.11) and (6.12)
are also shown. . . 109
7.1 Plot showing how the intercept of the E-R model changes with age in simulation scenarios 1-11. . . 128
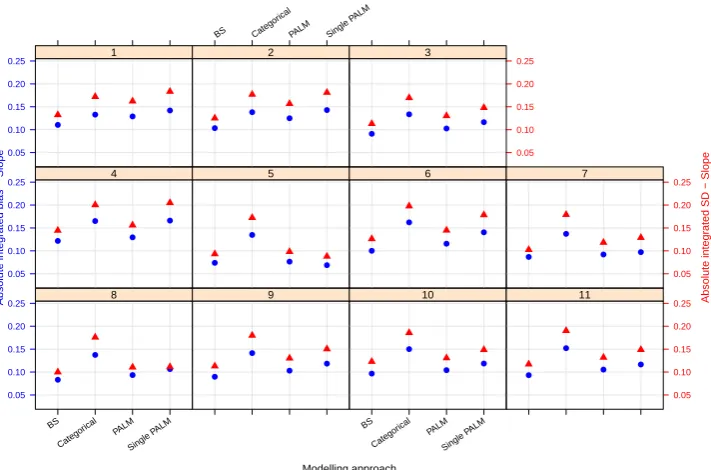
7.2 Plot showing how the slope of E-R model changes with age in sim-ulation scenarios 1-11. . . 129
7.4 Integrated absolute bias (blue circles) and integrated empirical SD (red triangles) for the slope of the E-R model. On the horizontal axis, ‘BS’ refers to the Bayesian penalised B-splines approach, ‘Cat-egorical’ the linear model adjusting for a categorical age covariate, and ‘PALM’ and ‘singlePALM’ label the bootstrapped PALM tree approach and single PALM tree, respectively. . . 134
7.5 Integrated absolute bias (blue circles) and integrated empirical SD (red triangles) for the expected response. On the horizontal axis, ‘BS’ refers to the Bayesian penalised B-splines approach, ‘Categor-ical’ the linear model adjusting for a categorical age covariate, and ‘PALM’ and ‘singlePALM’ label the bootstrapped PALM tree ap-proach and single PALM tree, respectively. . . 135
7.6 Integrated absolute difference between the target response and true expected response when children are dosed according to theKgroup optimal dosing rule. Results are shown for dosing rules obtained modelling the E-R relationship using Bayesian penalised B-splines (solid blue line) and bootstrapped PALM trees (dashed red line). . 136
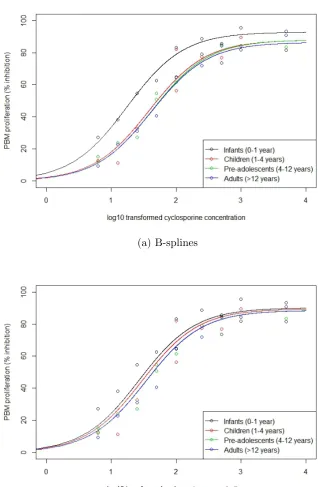
7.8 Fitted curves of the relationship between log base-10 transformed cyclosporine concentrations and PBM proliferation based on fre-quentist two parameter Emax model fit for each of the four age groups considered. Fitted curves are the solid lines and the points are simulated data. . . 138
7.9 Plots of the Bayesian penalised B-spline and bootstrapped MOB fits of (a) the Emax parameter and (b) the EC50 parameter. The median of each parameter, with 2.5th and 97.5th quantiles, over the 1000 simulated bootstrap samples and true parameter values given by the green dotted lines are also shown. . . 141
7.10 Fitted relationships between log base-10 transformed cyclosporine concentrations and PBM proliferation based on parameter estimates for the four age groups obtained with (a) the Bayesian penalised B-spline approach and (b) the bootstrapped MOB approach. . . 142
7.11 Plot of the objective function values from the optimisation proce-dure used to identify age groups for the Bayesian penalised B-splines approach (blue line) and bootstrapped MOB (red line). . . 143
B.1 App screen capture illustrating step 2 of the elicitation scheme. . . 185
B.2 App screen capture illustrating step 3 of the elicitation scheme. . . 186
B.3 App screen capture illustrating step 3 of the elicitation scheme. . . 187
B.4 App screen capture illustrating step 4 of the elicitation scheme. . . 188
B.5 App screen capture illustrating step 4 of the elicitation scheme. . . 189
B.6 App screen capture illustrating step 5 of the elicitation scheme. . . 190
B.7 App screen capture illustrating step 6 of the elicitation scheme. . . 191
B.9 (a) Average probability of the extrapolation assumption under bias prior E1, with bars of±1 standard deviations of the mean, when the true PK-PD relationships in adults and adolescents follows model S2. (b) Median PK-PD curves for adults, adolescents and younger children following model S2, along with lower bounds of 90% empir-ical credibility intervals for the median response in younger children resulting from the expert bias prior E1 when its variance matrix is unscaled; or scaled by a factor of 0.5 or 2. Credibility intervals are calculated conditioning on the true values of the adult and ado-lescent PK-PD parameters. Similarity bounds at placebo and the EC90 given by criteria (11) and (12) are also shown. . . 193
B.11 (a) Average probability of the extrapolation assumption under bias prior E1, with bars of±1 standard deviations of the mean, when the true PK-PD relationships in adults and adolescents follows model S6. (b) Median PK-PD curves for adults, adolescents and younger children following model S6, along with lower bounds of 90% empir-ical credibility intervals for the median response in younger children resulting from the expert bias prior E1 when its variance matrix is unscaled; or scaled by a factor of 0.5 or 2. Credibility intervals are calculated conditioning on the true values of the adult and ado-lescent PK-PD parameters. Similarity bounds at placebo and the EC90 given by criteria (11) and (12) are also shown. . . 195
C.1 Example to demonstrate the structure of a single PALM tree fitted to simulated data, produced from the ‘partykit’ package.2, 3 . . . 213 C.2 (a) Plot of the the intercept parameter over age from the
C.3 (a) Plot of the the intercept parameter over age from the B-spline fit to the simulated example data, showing the median intercept with 2.5th and 97.5th quantiles and true parameter values given by the green dotted lines. (b) Plot of the the slope parameter over age from the B-spline fit to the simulated example data, showing the median slope with 2.5th and 97.5th quantiles and true parameter values given by the green dotted lines. . . 216
C.4 Plots for the supplementary scenario showing (1) the true underly-ing E-R relationship; (2) how the intercept of the E-R model changes with age; (3) how the slope of the E-R model changes with age. . . 219
C.5 Directed acyclic graph illustrating the causal relationships between age, observed/unobserved covariates and response. . . 220
C.6 Integrated absolute bias (blue circles) and integrated empirical SD (red triangles) for (1) E-R model intercept; (2) E-R model slope; (3) expected response. On the horizontal axis, ‘BS’ refers to the Bayesian penalised B-splines approach, ‘Categorical’ the linear model adjusted for a categorical age covariate, and ‘PALM’ and ‘singlePALM’ label the bootstrapped PALM tree approach and single PALM tree, respectively. Panels display the supplementary scenario with and without the additional covariate in the analysis model. . . 221
C.8 Percentage of 1000 simulations in which K∗, the optimal number of age groups in the dosing rule, takes each value shown. K∗ is selected according to the algorithm described in Section 7.6.2 for Bayesian penalised B-spline (blue) and bootstrapped PALM tree (pink) approaches. The values of K∗ chosen by applying the algo-rithm in Section 7.6.2 to the true underlying E-R relationships in the supplementary scenario are shown by the yellow bars. . . 222
Chapter 1
Introduction
1.1
Decision making in clinical research
In order for new medicines to be approved for use in humans, evidence must be accrued demonstrating a medicine’s efficacy, safety and correct dosage before a decision regarding licencing (and subsequent use in the general population) can be made. The primary approach to accrue this evidence is to perform clinical trials. Clinical trials are defined as planned investigations of a treatment in human sub-jects with the aim of assessing one or more of the following: safety; efficacy; clinical effects; pharmacokinetics (PK; what effect the body has on an administered drug i.e. absorption, distribution, metabolism and excretion); pharmacodynamics (PD; the effect an administered drug has on the body); and adverse reactions.4, 5
Before clinical research can begin, there is a preclinical phase of testing the treat-ment in vitro and in vivo on animal subjects which allows for a preliminary as-sessment of the safety of a treatment for the proposed investigation in humans.7 Early phase clinical research begins with first-in-man Phase I studies which are designed to address the initial safety, PK and PD of a treatment. These are usually performed in healthy volunteers, unless the test treatment is likely to be unsafe for healthy subjects, such as in oncology studies. Phase II studies seek to assess whether the treatment may be potentially efficacious in a larger group of subjects with the condition to be treated, providing a threshold to be crossed when moving to Phase III, though not with enough certainty to provide definitive conclusions. Additionally, Phase II studies may inform the design of future Phase III studies, such as the identification of an appropriate dose range. Phase III studies are large confirmatory studies which aim to confirm whether a treatment can be considered efficacious and intend to provide adequate evidence in favour of the treatment being licensed for use. Phase IV studies take place after the treatment has been approved and marketed and explore the use of the treatment in practice. Safety is an important aspect and is monitored throughout all phases of clinical research. Seamless Phase II/III studies aim to combine Phase II and III studies into one trial consisting of two stages: the first stage focuses on treatment, dose or sub-group selection; the second stage then aims to definitively compare the selected treatment/dose/subgroup with control.8, 9
made. If participants are not made aware of what treatment they have been as-signed, then the trial is said to be blinded; this is used in an attempt to reduce the bias associated with the placebo effect. Researchers may also be blinded from treatment allocation in order to eliminate the risk of bias from any preferential care which may arise or blinded from the assessment of outcomes to reduce chance of bias in estimating treatment effects.10 There are often situations where
blind-ing is not possible, for example where treatment involves physical therapy, surgery or qualitatively different interventions. The gold standard for clinical trials are randomised controlled trials (RCT) which allow for causal inferences to be made regarding the effects of a treatment relative to control.11
Clinical trials are designed in such a way that inferences made regarding a param-eter, sayθ (e.g. a treatment effect), can be considered reliable whilst looking for a clinically meaningful result. For frequentist studies, they are designed to control type I and II error rates at chosen levels whilst testing a null hypothesis, H0 (for
example, no treatment effect, θ = 0) against an alternative hypothesis, H1 (e.g.
positive treatment effect exists,θ >0, or some treatment effect exists,θ 6= 0). The type I error rate, α, is the probability of rejecting H0 given that it is true. The
type II error rate,β, is the probability of failing to rejectH0 when it is in fact false;
the power of a trial is 1−β. When a hypothesis test is performed, a p-value and confidence interval for the parameter of interest can be calculated. The p-value is the probability of obtaining a test statistic at least as extreme as the result observed, under the null hypothesis; that is, how much probability is contained in the tail(s) of the distribution of the test statistic underH0, beyond the test result
observed. If the alternative hypothesis is only in one direction from H0 (as with
interval is defined such that if one were to repeat an experiment according to some protocol many times, (1−α)100% of the confidence intervals calculated according to the same method would contain the true value of the parameter of interest.
In contrast to the frequentist approach, in a Bayesian study model parameters are also considered to be random variables and suitable prior distributions for the pa-rameters of interest (such as treatment effects) are updated with accumulated data from the clinical trial using Bayes Theorem to produce posterior distributions for parameters.12 These posterior distributions can then be used to make probability
statements about the parameters of interest, e.g. the true value of the treatment effect has a 95% probability of lying between a and b. Such an interval is called a credibility interval, and has a much more simple interpretation than the frequen-tist confidence interval. Choice of prior distributions for parameters in a Bayesian study is an important step. Options include specifying priors as: non-informative (such as flat priors placing equal weight on all possibilities); vague/diffuse (to pro-vide minimal information on specific parameters and have little influence on the posterior); operational (chosen to ensure certain operating characteristics under different scenarios); or informative (based on existing data or expert opinion). For informative priors we discuss the use of expert opinion in Section 1.6 and the paper presented in Chapter 3 provides details of some approaches where prior dis-tributions are formed from existing data. Many Bayesian models can be complex and analytically intractable, meaning that explicit evaluation of posterior distri-butions is not possible and numeric approaches to sample from the posterior must be taken, for example, using Markov chain Monte Carlo (MCMC) methods. Mod-ern statistical computing software such as OpenBUGS13 and Stan14 (e.g. using
the ‘RStan’ package15run through R16) have made analysing complex models in a
When small populations would mean recruiting to both treatment and control arms would be difficult, existing data may be taken as evidence of the control to compare to a single arm trial. Eichler et al.18 define a threshold crossing approach
for situations where RCTs are not feasible. Defining the factual as the average outcome on an experimental treatment and the counterfactual as how patients would have responded on average if not given the new treatment (i.e. given noth-ing or another treatment known to be effective), Eichler et al. state that a RCT is the standard way to assess the factual over the counterfactual. Eichler et al. propose the following threshold crossing framework: use existing data to decide on an efficacy threshold that a new single arm trial must successfully cross for the new treatment to be deemed effective and a futility threshold that if not crossed would mean the new treatment is deemed ineffective, otherwise if between these thresholds the treatment would be deemed to be ‘promising’ with either a second single-arm trial (where success is only possible by exceeding the efficacy threshold) or a RCT (if feasible) being performed.18
In this thesis, emphasis will be on how to inform the development of medicines for children.
1.2
Paediatric clinical trials
Paediatric clinical trials are important for the development of safe and effective medicines for children. However, Bourgeois et al.19 looked at the proportion of
heterogeneity of the paediatric population.20 Batchelor and Marriott21 state that anatomical and physiological differences between younger and older children and adults can create differences for drug PK. Furthermore, there may be age-related changes in the safety profile and pharmacodynamics of a drug, although Stephen-son22 states that adults’ and children’s responses to many drugs have much in
common. To capture this heterogeneity, the ICH E11 guideline23 suggests one
possible set of age groupings to categorise paediatric patients: preterm newborn infants, term newborn infants (0 to 27 days), infants and toddlers (28 days to 23 months), children (2 to 11 years), adolescents (12 to 16/18 years, dependent on region); though it is emphasised that any classification of the paediatric population into age categories is somewhat arbitrary and that there is considerable overlap in terms of physical, cognitive, and psychosocial developmental issues across those categories suggested.
Within paediatric trials there can be an issue of gaining consent, with parents and guardians having to give consent on behalf of the child in most cases; in most EU countries the legal age for independent consent in paediatric clinical trials is 18, below this often only assent is sought for differing age ranges.24 Clearly, there are
no healthy volunteers in paediatric clinical trials, so trials are always in the pop-ulation with the condition to be treated. There is also a common perception that recruitment into paediatric trials will be challenging, with clinicians, parents and guardians being reluctant to expose children to experimental treatments.25 How-ever, recent research has shown that there is a willingness from both parents and practitioners to enter children into trials, so barriers to recruitment are perhaps not as great as perceived.26 Funding of paediatric trials has also had challenges,
with Bourgeois et al.19 identifying that between 2006 and 2011 the primary
In 2006 the EU Paediatric Regulation (EC 1901/2006) came into effect, with the objective of motivating the development of new medicinal products in children aged 0 to 17 years, and to ensure that new medicines are appropriately licensed for use across the paediatric population.27, 28 Following this regulation, for all new
medicines an agreed paediatric investigation plan (PIP) is required, with results of studies as described in the PIP needed for marketing authorisation. PIPs are defined as prospectively agreed documents stipulating how the development of a new medicine should proceed in children and outline all of the studies that are to be conducted, detailing the conditions, indications and age groups concerned. Proposals for PIPs are submitted to the Paediatric Committee (PDCO) of the European Medicines Agency (EMA) for consideration; the Paediatric Regulation states submission should be no later than completion of adult PK studies.27 The
PDCO is responsible for agreeing or refusing the PIP, with positive PIP opinion (adopted by the PDCO) summarising the binding elements of an agreed develop-ment plan. In order to get the approval to market a medicine, all applications must include the results of any studies described in the agreed PIP, unless the medicine is exempt because of a deferral or waiver.29 Prior to the introduction of the EU Paediatric Regulation, it has been estimated that at least 50% of drugs prescribed for children have never been tested in the paediatric population.28, 30, 31
However, Weda et al.32 concluded that the introduction of the Paediatric
Regula-tion (1901/2006/EC) does not seem to have led to a lower prevalence of off-label use, where they define off-label use as “intentional use of an authorised product not covered by the terms of its marketing authorisation”. Based on data from 16 EU Member States, 32 studies of hospital based paediatric off-label drug prescription showed a range of 13-69% of investigated drugs being used off-label.32
Hampson et al.33 reviewed 73 PIP opinions to explore strategies that were adopted
ing extrapolation assumptions in paediatric medicine development.
1.3
Extrapolation
The European Medicines Agency (EMA) defines extrapolation as:
‘extending information and conclusions available from studies in one or more subgroups of the patient population (source population(s)), or in related conditions or with related medicinal products, in order to make inferences for another subgroup of the population (target popula-tion), or condition or product, thus reducing the amount of, or general need for, additional information (types of studies, design modifications, number of patients required) needed to reach conclusions’.34, 35
Examples of extrapolation in practice include extrapolating from historical data to predict drug effects in contemporary patients, extrapolating from one geographic region to another to predict clinical benefits, or extrapolating from adults to sup-port licensing decisions in the paediatric population. In order for extrapolations to be appropriate, strong assumptions on similarity are required between the source and target populations; a big challenge is deciding whether and to what extent extrapolation is appropriate. The US FDA1 and International Council for Har-monisation of Technical Requirements for Pharmaceuticals for Human Use (ICH) E1123 guidelines outline an algorithmic, assumptions based approach to
are deemed reasonable, extrapolations can range from no extrapolation, through partial extrapolation, to complete extrapolation. According to Dunne et al.,36 for each level of extrapolation the evidence required in the paediatric population is as follows: for no extrapolation a full development programme is required; for partial extrapolation the evidence needed ranges from a single adequate, well-controlled trial to confirm efficacy to a PK-PD study to confirm response; for complete ex-trapolation only PK studies, to establish dosing, and safety studies are needed (in certain cases only safety data may be needed). Hampson et al.33 describe this type of extrapolation, where uncertainty regarding extrapolation assumptions is not accommodated, as ‘deterministic extrapolation’.
tional post-authorisation data may need to be gathered.35 Such an approach to extrapolation, where knowledge regarding extrapolation assumptions can be up-dated and verified, is referred to by Hampson et al.33 as ‘stochastic extrapolation’.
A benefit of extrapolation in the setting of paediatric trials is the potential to reduce the number and size of studies required to demonstrate efficacy of a new medicine in children. This is important as it may be difficult to recruit children into clinical trials, there may not be many children meeting inclusion criteria for recruitment (e.g. having already been exposed to the drug off-label) and there may be constraints on the number and type of clinical measurements which can be taken from children. Additionally, there is a tradeoff between risk and benefit for testing medicines in children: if a highly effective treatment already exists there may be a reluctance to expose children to a potentially harmful new treatment; however, if there is currently an unmet medical need in children, it would be con-sidered ethical to trial a drug without proven efficacy, even with the potential for adverse events. Conversely, the consequences of extrapolating when the assump-tions do not hold could include exposing children to an ineffective medicine or exposing children to an unacceptably toxic dose.
Examples of extrapolation in practice can be seen in the cases of Zmax (azithromycin extended-release) for treating Community-Acquired Pneumonia, where use in the paediatric population (6 months and older) is based on extrapolation of adult efficacy data with additional safety and PK data in paediatric patients;37 and
noted that this extrapolation was made with the knowledge that oxcarbazepine was already approved as monotherapy for paediatric patients in the EU.
1.4
Epilepsy
Much of the work in this thesis will be placed in the context of epilepsy clini-cal trials as there is a consensus of expert groups that extrapolation of efficacy from adults to younger children can be appropriate for focal epilepsies. Epilepsy is defined as “a tendency to suffer recurrent epileptic seizures” and is one of the most common groups of neurological disorders.39 Epilepsy may occur at any age, but most commonly starts in childhood and old age.40 There are many types
of epilepsy (called epilepsy syndromes) and many types of seizures. Seizures can be defined as “a disturbance of movement, feeling or consciousness occasioned by sudden, inappropriate and excessive electrical discharges in the grey matter of the brain”.41 Epileptic seizures are usually grouped into either generalised or focal
(also called partial) seizures. A seizure is called a focal seizure if the discharge remains in one part of the brain; there are a range of possible focal seizures de-pending on the location of the discharge. Generalised seizures involve all parts of the brain. A primary generalised seizure involves all parts of the brain at the seizure’s onset. The discharge of a focal seizure can also lead to a focal seizure with secondary generalisation, where the focal discharge can spread through the brain, initiating a generalised seizure discharge.
With regard to focal epilepsies, whilst there is evidence to suggest that differences between treatment effects in adults and children would be quantitative rather than qualitative42 there has been some disagreement between expert groups regarding
what age is acceptable to extrapolate from adults down to. French et al.,43 a
acceptable. The FDA recently concluded that extrapolation of efficacy from adult to paediatric patients aged greater than 4 years of age with focal epilepsies is acceptable.45
1.5
Meta-analysis
Meta-analytic methods involve quantitatively synthesising evidence across multi-ple related but independent studies in order to make inference based on a body of relevant research and potentially allow for an increase in power to detect a treatment effect over all included studies.46, 47 The term ‘meta-analysis’ was first used by Glass48 to mean “The statistical analysis of a large collection of analysis
results from individual studies for the purpose of integrating the findings”; since then, more modern meta-analyses do not necessarily rely on a “large collection” of results, with Davey et al.49 reporting that from 2011 and earlier, 36% of the
22453 meta-analyses listed in the Cochrane Database of Systematic Reviews were based on two studies, whilst 75% were based on five or fewer studies.
Meta-analyses may synthesise summary measures reported from completed studies in an aggregate data meta-analysis or make use of the original individual partic-ipant data (IPD) from each included study. An IPD meta-analysis may be per-formed in either a one-step or two-step approach, described by Riley et al.50 as follows. In a one-step approach, the IPD over all studies are fitted together in one overall model, whilst ensuring that the clustering of each study is handled appropriately (e.g. by inclusion of study as a factor in the model47). In a two-step
of a two-step IPD meta-analysis are equivalent. There are many benefits to IPD meta-analyses such as greater consistency in analysis across studies (inclusion / exclusion criteria, analysis methodology, summary measures used, consistency in handling missing data); potential verification of original study results and mod-elling assumptions; possible long-term follow-up results may be available for in-clusion; and publication bias can be reduced by inclusion of unpublished studies, where available.50 The primary disadvantage of IPD meta-analyses is how heavily
resource intensive they can be; expert statistical input will likely be required for the more advanced meta-analytic methods used, whilst obtaining, understanding and cleaning each set of IPD can take a considerable amount of time and contact with original study investigators, with no guarantee that the original data will always be completely available.50 A disadvantage of any meta-analysis is that if
included studies are not of high quality then any biases contributing from indi-vidual studies will result in inferior overall results. Though, there are approaches available for measuring (and adjusting for) the risk of bias in studies to be included in a meta-analysis.51, 52
When performing a meta-analysis there are two ways to model between-study vari-ability: fixed-effects, where study-specific treatment effects are considered to be the same across all studies; and random-effects, where study-specific treatment effects are allowed to be different between studies, allowing for the incorporation of between-study heterogeneity.47 Focusing on the case of aggregate data for sim-plicity of presentation, a fixed-effects meta-analysis can be described as follows. Let the parameter of interest, θ, be the overall population treatment effect and summary measuresYj, forj = 1, . . . , H trials, be estimates of this treatment effect.
The Yj can be modelled as:
where thej’s are random error terms and follow a normal distribution with mean
0 and varianceσj2; typically the variancesσj2 are taken to be the estimated variance of the Yj summary measure, s2j =var(Yc j). As such, the Yj can be assumed to be
taken from a distribution:
Yj ∼N(θ, s2j),
with mean θ;46, 47 the Y
j and s2j are summaries that could be calculated in a
two-step IPD meta-analysis.
For a random-effects meta-analysis, summary measures Yj are taken to be
esti-mates of study-specific treatment effectsθj and can be modelled as realisations of
a study-specific distribution:
Yj ∼N(θj, s2j).
That is, the random-effects model assumes that treatment effects in each study can be different and that theseθj effects are themselves realisations from a population
distribution:
θj ∼N(θ, τ2),
with mean θ, the overall treatment effect, and τ2 which measures the
between-study variance. As such, summary measuresYj can be modelled as:
Yj =θ+ξj+j,
where thej terms are defined as in the fixed-effects approach and model the
vari-ability within study, and the ξj are random error terms which are normally
The between-trial heterogeneity term τ2 is often unknown and will be estimated as part of the random-effects meta-analysis.46, 47
Deciding between fixed and random effects meta-analyses can be based on a prior understanding of the underlying population. For example, if studies included in the meta-analysis were spaced apart in time, standard of care could have changed slightly resulting in each study giving a different (though still relevant) estimate of treatment effect. Alternatively, a test of whether there exists significant between-study heterogeneity can also be performed. One such approach is to consider Cochran’s Q statistic, which can be used to test for heterogeneity of study treat-ment effects.46, 53 The Q statistic is found as a weighted sum of squared deviations
between the summary measures in each trial and the fixed-effect overall treatment effect estimate:
Q=
H
X
j=1
wj(Yj −θ)b2,
whereθb=
PH j=1wjYj
PH
j=1wj is an estimate of the overall treatment effect and the weights,
wj = 1/s2j, are the reciprocal of the estimated variances of theYj summary
mea-sures. Under the null hypothesis of no between-trial heterogeneity this Qstatistic is approximately Chi-square distributed with H −1 degrees of freedom, so at a specified significance level a standard hypothesis test can be performed to test for heterogeneity between trials.46, 54 However, Hardy and Thompson54 show that
a multivariate meta-analysis is possible.55 In the bivariate random-effects case the following illustrates this idea. Summary measures Y1,j and Y2,j are taken to be
estimates of study-specific treatment effectsθ1,j and θ2,j, respectively, and can be
modelled as realisations of a study-specific bivariate normal distribution:
Y1,j
Y2,j
∼N
θ1,j
θ2,j
, s2
1,j ρjs1,js2,j
ρjs1,js2,j s22,j
,
wheres2
1,j and s22,j are estimated variances of the Y1,j and Y2,j summary measures
and ρj is the within-study correlation.56 The θ1,j and θ2,j treatment effects are
themselves realisations from a population bivariate normal distribution:
θ1,j
θ2,j
∼N
θ1 θ2 , τ2 1 τ12
τ12 τ22
,
This multivariate meta-analysis allows borrowing of information between the θ1,j
andθ2,jparameters and is used in this thesis in Chapter 6 in a Bayesian framework.
Compared to the frequentist approaches already discussed in this section, Bayesian methods differ in that the model parameters, such as the between-study variance, are also considered to be random variables and must be assigned prior distribu-tions. One benefit of the Bayesian approach is the potential to approximate the information contained in the existing studies of a meta-analysis as a prior distri-bution, which could be used for the design or analysis of a future related study, see for example the meta-analytic predictive priors of Schmidli et al.57 Sutton and
Abrams58describe several advantages and disadvantages of the Bayesian approach
uncertainty can be accounted for in the analysis, the potential for easier extension to more complex models and the ability to incorporate external evidence (including expert opinion) in informative prior distributions.
1.6
Elicitation of expert opinion
The elicitation of expert prior opinion is the process of constructing a probability distribution that represents the knowledge and uncertainty extracted from an ex-pert regarding one or more unknown quantities, such as a probability or treatment effect. Elicitation of expert opinion can be a useful way to quantify the state of knowledge about an unknown quantity prior to data collection. For rare diseases or small populations, where a conventional, well powered frequentist trial may not be feasible, elicited expert prior distributions can be used in the design and anal-ysis of a future Bayesian clinical trial to improve the understanding of a treatment.
Based on a thorough review of literature, O’Hagan et al.59 suggest the following
steps to a model for the whole elicitation process: (a) background and preparation, including identifying quantities of interest and planning the elicitation session; (b) identifying and recruiting experts; (c) motivating and training experts, includ-ing explaininclud-ing probability, probability distributions, common rules and instinctive processes people use when forming judgments (heuristics, such as anchor-and-adjustment), possible biases and trialling practice elicitation questions; (d) struc-turing and decomposition, including considering any dependencies and reviewing the available evidence base with experts; and (e) the elicitation itself, eliciting spe-cific summaries from experts, constructing the probability distribution to represent these summaries, assessing adequacy and having the expert iteratively update if needed. Of course, many alternate approaches are possible.59 As mentioned in
example, the anchor-and-adjustment heuristic is where a judgment is based on the adjustment from an initial starting value, called an anchor. This can be an issue as when making such quantitative judgments, experts often stay too close to the anchor value and fail to adjust far enough in either direction. It is important to keep such heuristics in mind when developing elicitation schemes to try to at least reduce the risk of associated biases.
The aim of prior elicitation is to quantify expert opinion as a useful probabil-ity distribution, X. When eliciting opinion, the choice of probability distribution used to quantify expert knowledge will depend on the unknown quantity of inter-est. For example, opinion on a probability may be appropriately modelled by a beta distribution, whilst opinion on a continuous variable which can take any real number could be modelled by a normal distribution. Clearly, if the expert opin-ion is to be quantified by a continuous distributopin-ion, it is impossible to elicit their opinion for the infinite number of probabilities contained within that distribution. Instead, several probabilities or specific summary measures of the distribution can be elicited and the probability distribution can be inferred from these elicited val-ues.59 Specific summaries of the distribution may include location measures (e.g.
mean, median or mode) and measures of variability (e.g. standard deviation). However, measures of variability are difficult to elicit directly,59 instead the spread
of the distribution is often inferred by quantiles or credibility intervals, which can be used to give a value for the desired parameter by taking into consideration the mathematical properties of the distribution in question.
The bisection method begins by the statistical facilitator eliciting from the expert the median of X, that is, the value x0.5 such that P(X < x0.5) = 0.5; an expert
may be asked to give a value such thatXis equally likely to be less than or greater than the value given.59 Following this, the expert is then asked to bisect the
that P(X < x0.25) = 0.25 and P(X < x0.75) = 0.75. For a normal distribution
this provides more points along the distribution than the number of parameters, meaning that unlessx0.25 andx0.75are symmetrical aroundx0.5, a perfect fit to the
expert’s values will not be possible. The minimum number of questions needing answers to be elicited is equal to the number of parameters in the chosen probabil-ity distribution. Eliciting more quantities than the number of parameters means that it is unlikely a set of parameter values will be found that gives a distribution matching the elicited opinion exactly, instead the parameters of the distribution could be chosen in an optimal way; for the normal case, if eliciting more than one quantile for the measure of variability, the variance parameter could be chosen to minimise the sum of the absolute or squared differences between elicited and fitted quantiles of the distribution. Compared to absolute differences, squared differences give larger weight to large differences when optimising. For particularly complex elicitation problems, eliciting the answers to more questions will help with stabil-ity when fitting the elicited distribution. Additionally, the redundant information can be useful for assessing modelling assumptions; if the quantiles are dramati-cally asymmetric, and one is confident that the expert has indeed understood the questions, a symmetric distribution may not appropriately capture expert belief.
An alternative method could be to elicitX as a histogram.61, 62 In this approach,
X is split into bins and the expert is asked to place a certain number of ‘chips’ (representing probability) amongst the bins to represent their belief regarding the probability distribution X. Placing all chips in one bin suggests that the expert is completely certain that X lies within that bin and placing an equal number of chips in every bin would suggest complete uncertainty regarding X.62 With a
an expert finds it difficult to adequately assign their probability to bins, a small number of chips may make the task more manageable to reflect their opinion. The elicited histogram could then be used to approximate a parametric distribution for X, for example, by considering quantiles of the histogram.
When eliciting opinion from a group of experts there are several approaches to combining opinion in to one overall prior distribution.59 One approach is to elicit individual prior distributions from each expert and mathematically combine them, for example, as a weighted sum. Such a weighted sum could either assign equal weight to all experts or could weight individual experts differently, say by clinical experience, though such weightings would be highly subjective. Alternatively, a consensus opinion over all experts could be quantified by having experts give their individual opinions, then join together to agree on one final prior distribution through constructive and open discussion; care must be made by the statistical facilitator to ensure that experts equally share opinion, come to one agreed prior and no one expert dominates the discussion.63 Advantages of this type of
be-havioural aggregation include the automatic averaging over all experts opinion; drawing on every experts opinion at once to form one prior without the need for a complex mathematical aggregation model; and all experts must agree on a final prior distribution (compared to mathematical aggregation, where a weighted com-bination of priors could result in a distribution no expert agrees with). However, the statistical facilitators job is more challenging, strong personalities could heav-ily influence the final results, more reserved personalities may not contribute their valuable experience and it may not be clear how to proceed if experts are unable to agree on a final prior.
An example of a user-friendly software for eliciting probability distributions is contained in the Sheffield Elicitation Framework (SHELF).64 SHELF is a formal
elicitation to elicit expert opinion on an uncertain quantity and to quantify this opinion as a probability distribution. SHELF offers templates to structure and record elicitation sessions (called SHELF workshops) and an R16 package which allows interactive elicitation, fitting and visualisation of expert opinion as proba-bility distributions; the approaches to prior elicitation can either be performed in an interactive Shiny65 application or by the facilitator manually inputting elicited
quantities. SHELF allows the use of several methods to elicit opinion: quar-tile method (bisection approach described earlier); terquar-tile approach (similar to bisection, though rather than splitting the distribution into four parts with equal probability, the distribution is split into three parts); and the roulette method (the histogram approach described earlier). SHELF proposes first eliciting opinion from individuals, then having experts regroup to share their expertise and opinions, be-fore eliciting a group consensus distribution. To answer the issue of experts not all coming to a perfect agreement regarding the consensus prior distribution, SHELF asks the experts to consider the opinion of a rational impartial observer (RIO); after the RIO has seen all individual expert opinion and heard all discussions, experts must agree on a prior distribution that the RIO might reasonably believe to be true about the uncertain quantity of interest.
There are numerous examples of prior elicitation in practice across many fields, such as engineering, physics, psychology, agriculture, economics and medicine.59, 61, 66 One example of elicitation being used in a clinical trials context is that of the MYPAN study (mycophenolate mofetil for childhood polyarteritis nodosa) where expert prior opinion was elicited for a future Bayesian RCT testing mycopheno-late mofetil (MMF) against cyclophosphamide (CYC) for the treatment of children aged 4–18 years old with polyarteritis nodosa (PAN).67, 68 A Bayesian trial design
non-rates on both treatments assumed to be 70% would have required 513 patients on each treatment arm, with previous studies of PAN suggesting recruitment would have taken over 30 years.68 The Bayesian approach taken in the MYPAN trial began by first eliciting expert opinion on the 6-month remission rate on CYC (pC)
and the log-odd ratio,θ, between the 6-month remission rate on PAN (pE) andpC.
Expert opinion on pC and θ was elicited by asking six questions about different
probabilities and proportions, marking answers on a visual analogue scale ranging from 0 to 1, with answers rounded to the nearest 0.05 probability. The prior forpC
was modelled as a beta distribution and experts were asked questions to establish the mode and lower quartile to infer the distribution. The prior for θ was taken to be a normal distribution, asking experts questions to establish the prior proba-bility that pE > pC and pE −pC <−0.1; answers to these questions were used to
infer values for the mean and variance of the prior distribution for θ. Redundant questions regarding pE were also asked in order to assess goodness of fit of the
model and the consistency of expert opinion. Individual experts had plots of the probability density functions forpC and pE, fitted based on their elicited opinion,
presented to them and were allowed to make changes to previously answered ques-tions until they felt the plots represented their prior belief. All experts were then brought together to discuss their individual opinions and had a further opportu-nity to revise their answers. By taking the means and medians of the expert’s final answers to the elicitation questions, a set of consensus prior distributions were de-termined that all experts agreed upon. Further to this, Hampson et al.67 elicited
expert opinion regarding the relevance of a related trial of MMF and CYC treating a different (but related) condition to PAN. The 6-month remission rates for both treatments between both study populations were related by log-odds ratios λC
(for CYC) andλE (for MMF). TheseλC and λE parameters were used to measure
individual opinions to begin with and then came together to reach a consensus opinion and agree on a single set of answers to the elicitation questions, giving consensus prior distributions. Existing data from the relevant trial were then re-vealed, updating the prior probability densities forpC,pE andθ to be shared with
the experts. Ultimately, the experts agreed on these updated prior distributions (incorporating the relevant trial data) as the consensus prior distribution to be used for the Bayesian trial.67 This example highlights the complexity of expert
Chapter 2
Thesis Summary
This thesis aims to explore extrapolation in paediatric medicine development and consists of four substantive pieces of work: a systematic review of methods for extrapolating between populations; conclusions of a focus group of epilepsy ex-perts eliciting their opinions regarding extrapolation in paediatrics; a quantitative framework to inform extrapolation decisions in younger children using existing data from trials of adults and adolescents; and approaches to quantify how parameters of an E-R model vary over age to derive dosing rules.
Chapter 3 contains the systematic review paper entitled “Extrapolation of efficacy and other data to support the development of new medicines for children: A systematic review of methods”.69
Chapter 4 gives some background to the focus group of epilepsy experts. This leads to the second published paper included in this thesis which is contained in Chapter 5, entitled “Clinical drug development in epilepsy revisited: A proposal for a new paradigm streamlined using extrapolation”.70
relationships between adults and younger children.
The final piece of work contained in this thesis is given in Chapter 7 and is entitled “Exposure-response modelling approaches for determining optimal dosing rules in children”. This chapter considers approaches to quantify how parameters of a PK-PD model vary over a continuous age range and, given this, an approach for deriving optimal dosing rules which account for pharmacological differences between paediatric age groups.
Chapter 3
Extrapolation of efficacy and
other data to support the
development of new medicines for
children: A systematic review of
methods
3.1
Introduction
Extrapolation has been defined as extending data and conclusions available from studies conducted in a ‘source population’ to make or support inferences for a ‘tar-get population’.34 Extrapolating from existing data, also commonly referred to as
bridging or borrowing strength, is common in drug development.36, 71 Examples include incorporating historical data into the analysis of contemporary clinical tri-als72–74 and, more controversially, using information on a drug’s short-term effect to draw conclusions about its long-term effect.75 Alternatively, one may seek to
confirming it is beneficial for patients from another locality. In such cases, it may suffice to conduct a smaller ‘bridging’ study in the new region that will collect efficacy and safety data to support the extrapolation of data from other localities to this site.76
The use of extrapolation to facilitate the development of safe and effective medicines for children has received much attention.1, 23, 36, 77 Adult data are often available at the time development of a new medicine begins in children. Moreover, trials in children can be more challenging to conduct due to practical constraints on available sample sizes and pharmacokinetic sampling.25 There is also a common
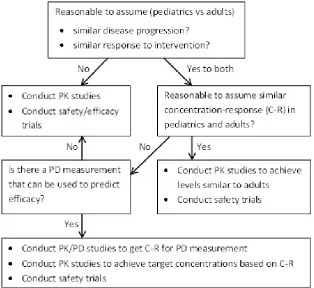
perception that recruitment into paediatric trials will be challenging, although this has been contradicted by recent research finding that parents and practition-ers are willing to enter children into trials.26 Dunne et al.36 discuss the paediatric study decision tree1, 23 shown in Figure 3.1, which is an algorithmic approach to determining which additional data are needed in children to support paediatric licensing decisions. The level of extrapolation is determined by whether adults and children can be assumed to be similar in terms of key characteristics, such as disease progression and the pharmacokinetic-pharmacodynamic (PK-PD) rela-tionship of the drug. While this framework clearly identifies scenarios in which different extrapolation strategies are appropriate, it neither accommodates un-certainty about extrapolation assumptions nor allows for differences between age groups of children. To capture the heterogeneity of growth, development and phar-macokinetics in the population, the ICH E11 guideline23 suggests one possible age
grouping: preterm newborn infants, term newborn infants (0 to 27 days), infants and toddlers (28 days to 23 months), children (2 to 11 years) and adolescents (12 to 16/18 years, dependent on region). Batchelor and Marriott21 state that there
may be age related changes in drug pharmacokinetics caused by anatomical and physiological differences between younger and older children and adults. However, Stephenson22 notes that adults’ and children’s responses to many drugs have much in common. The European Medicines Agency (EMA)34 has proposed a general
Figure 3.1: Paediatric Study Decision Tree: Image reproduced from Food and Drug Administration1
data will be generated in the target population, and these data should, in turn, be used to verify the extrapolation concept.
In Section 3.4, we give a detailed account of the methods found, grouped accord-ing to four common approaches. We conclude in Section 3.5 with a discussion of the suitability of these methods for making extrapolations in paediatric drug development.
3.2
Methods
Articles were identified by searching the Science Citation Index Expanded (SCI-EXPANDED) database of the Web of Science. Searches were restricted to English language papers listed on Web of Science prior to 31st January 2014 in the follow-ing categories: biology; mathematical and computational biology; mathematics (applied, interdisciplinary applications); medical informatics; research and exper-imental medicine; pediatrics; and statistics and probability. Preliminary searches were also made of other databases (JSTOR, PubMed) but no additional relevant articles were found. Separate searches of the SCI-EXPANDED database were made to identify potentially relevant papers proposing statistical methods for: (a) incorporating historical data into contemporary clinical trials; (b) using data on short-term endpoints to support inferences on long-term outcomes; (c) paediatric clinical trials; and (d) bridging clinical trials. Since there was considerable overlap between the search terms needed to identify papers on the last two topics, these were combined so that a total of three separate searches were made. Search terms can be found in the web based materials accompanying this manuscript (Appendix A.1). We searched for papers containing these search terms either in the title, ab-stract or keywords.
statistics (returned because one search term, ‘bridge’, occurs in many contexts). A full text review of the remaining articles was then performed. At this stage manuscripts were excluded if they did not consider statistical methods; if they used source population data only to inform the design of a future trial; or if they considered trials using a historical control arm without consideration of possible differences between populations. From each paper we extracted details of all statis-tical methods relevant for extrapolating data from a source population to support inferences for a target population. Methods for establishing whether data from source and target populations are consistent were regarded as relevant, assuming that if commensurability is established it would be appropriate to analyse data pooled across populations. A data extraction form (Appendix A.2) was completed for each statistical method and the number of methods extracted from each paper was recorded. When identical methods were found in more than one paper, we recorded the method as it appeared in the earliest publication. Papers presenting only duplicate methods were excluded from the review. Data were extracted by one author (IW) seeking guidance from others (LVH, TJ) where necessary.
3.3
Results
Searches identified 52 papers satisfying the stated inclusion/exclusion criteria as summarised in Figure 3.2, from which we extracted 102 methods. A single method was extracted from each of 34 papers. Of the remaining papers, eight presented two methods each, while 10 presented three or more methods each.
Figure 3.2: Flow diagram of systematic review results
Figure 3.3: Plot showing distribution of methods across four main areas
Of the 102 methods, 100 expected data from the source and target populations to make inferences about key parameters in the latter group, and as such are appro-priate for making partial extrapolations. An example of a method that did not expect data from the target population, Nedelman et al.38 suggest that a necessary
condition for using adult efficacy data to support conclusions about the efficacy of oxcarbazepine as a monotherapy for children with epilepsy, is that PK-PD re-lationships should be similar in adults and children receiving oxcarbazepine as an add-on therapy.